Educational Robot Market Size and Share
Market Overview
| Study Period | 2020 - 2031 |
|---|---|
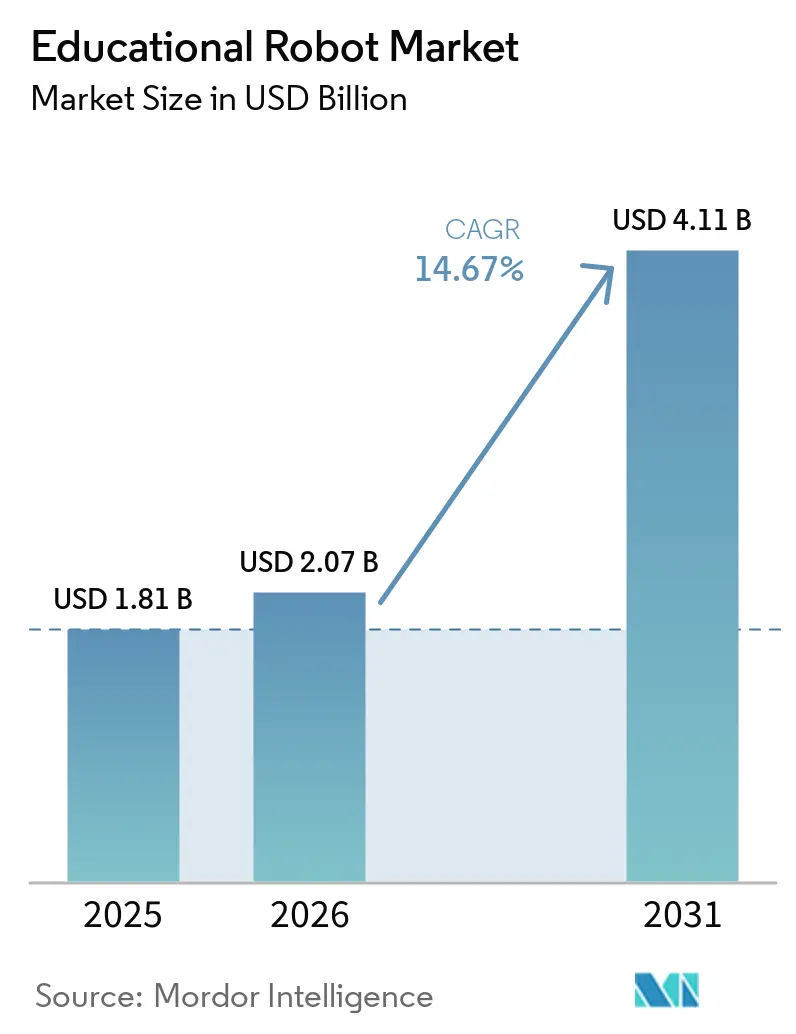
| Market Size (2026) | USD 2.07 Billion |
| Market Size (2031) | USD 4.11 Billion |
| Growth Rate (2026 - 2031) | 14.67% CAGR |
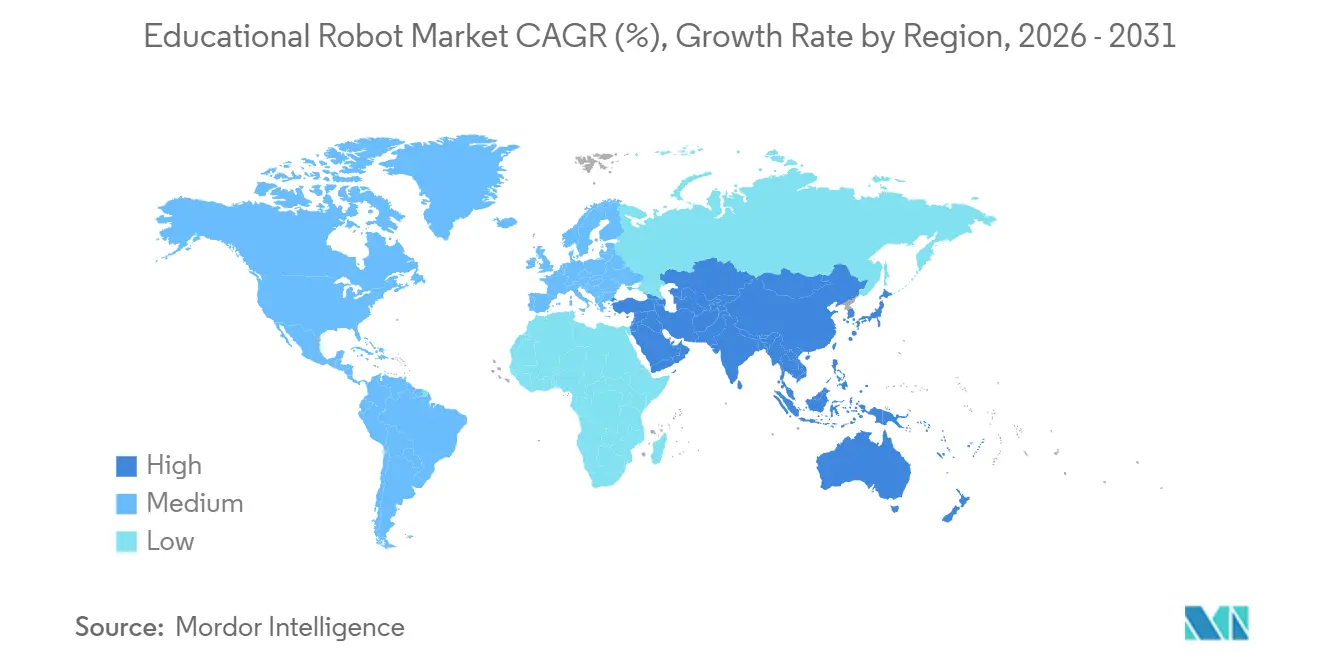
| Fastest Growing Market | Middle East |
| Largest Market | Asia Pacific |
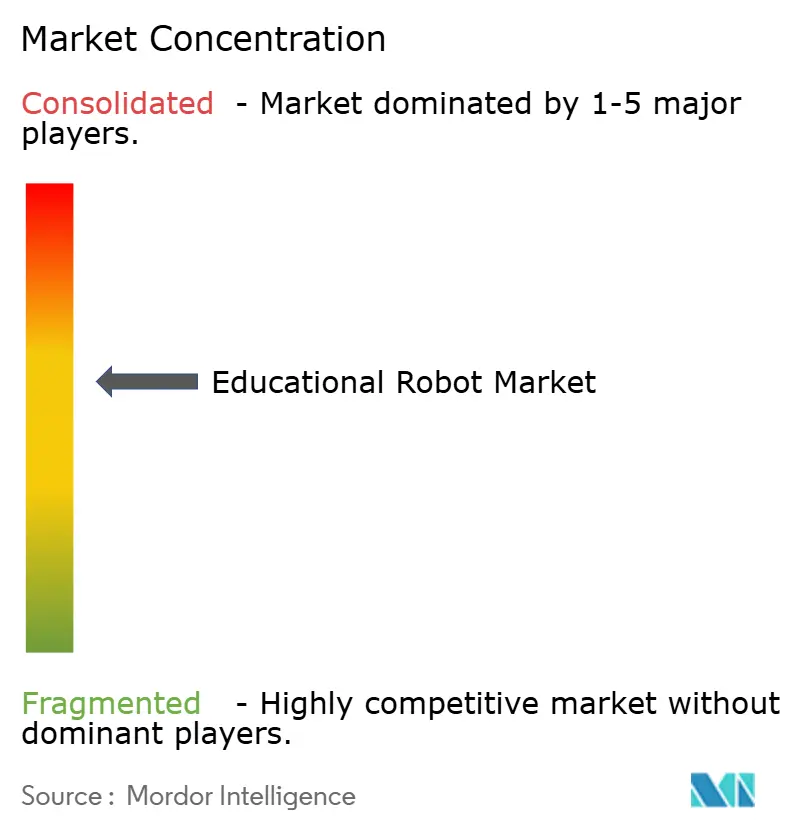
| Market Concentration | Medium |
Major Players *Disclaimer: Major Players sorted in no particular order Image © Mordor Intelligence. Reuse requires attribution under CC BY 4.0. | |
Educational Robot Market Analysis by Mordor Intelligence
The Educational Robot Market size is expected to grow from USD 1.81 billion in 2025 to USD 2.07 billion in 2026 and is forecast to reach USD 4.11 billion by 2031 at 14.67% CAGR over 2026-2031. The upward curve rests on policy mandates in Europe and China that embed robotics into national curricula, public grants that underwrite university‐level procurement in the United States and Canada, and the fast adoption of AI-enabled social robots for language tutoring across East Asia. Falling component prices, particularly Shenzhen-made servo motors now selling for USD 3.50-48.90, have moved entry-level kits below USD 150, widening access for price-sensitive districts. At the same time, cloud-linked content subscriptions and LMS integrations are shifting margins from hardware to software, while compliance requirements such as GDPR push vendors toward on-device data processing. Competitive intensity is moderate, with the top five vendors holding 45% educational robot market share in 2025, yet regional specialists and ed-tech aggregators continue to capture white-space niches in therapeutic robotics and vocational training.
Key Report Takeaways
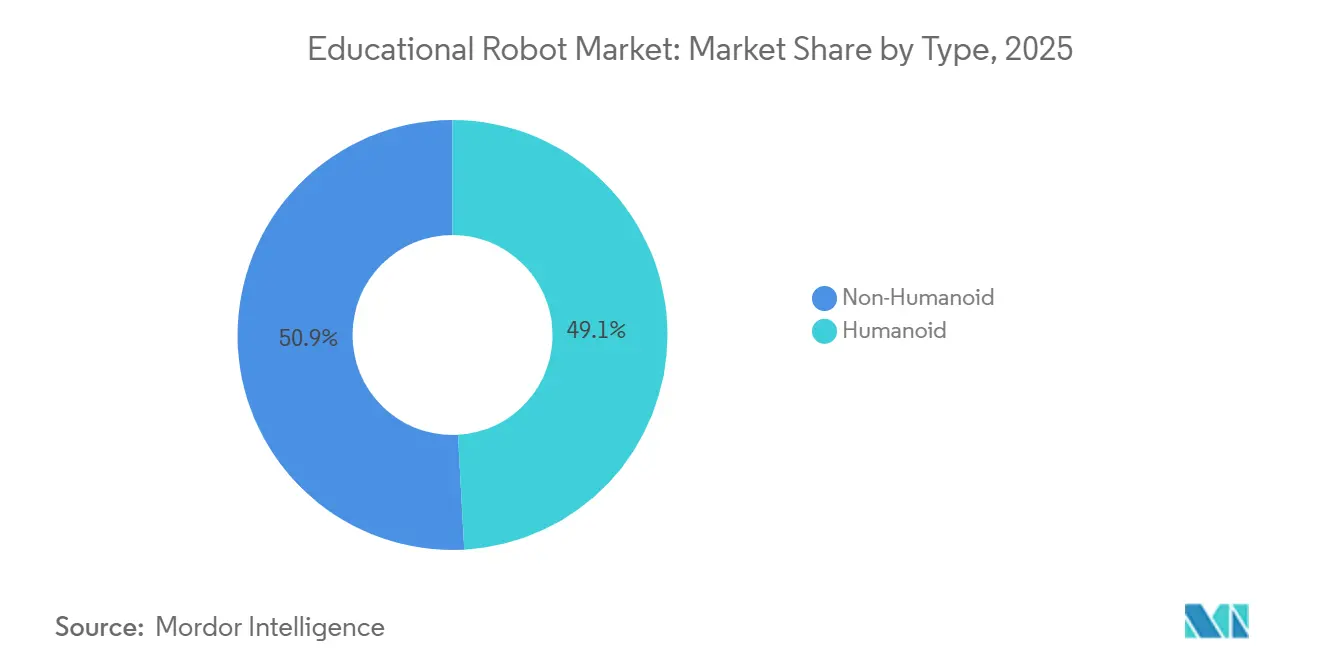
- By form factor, humanoid robots led the educational robot market with 49.13% market share in 2025, and the same segment is forecast to expand at a 15.03% CAGR through 2031.
- By component, hardware commanded 58.36% of the educational robot market in 2025, while software posted the highest forecast growth at a 16.17% CAGR to 2031.
- By education level, primary education accounted for 36.81% of 2025 revenue, whereas special education is projected to grow at an 18.63% CAGR through 2031.
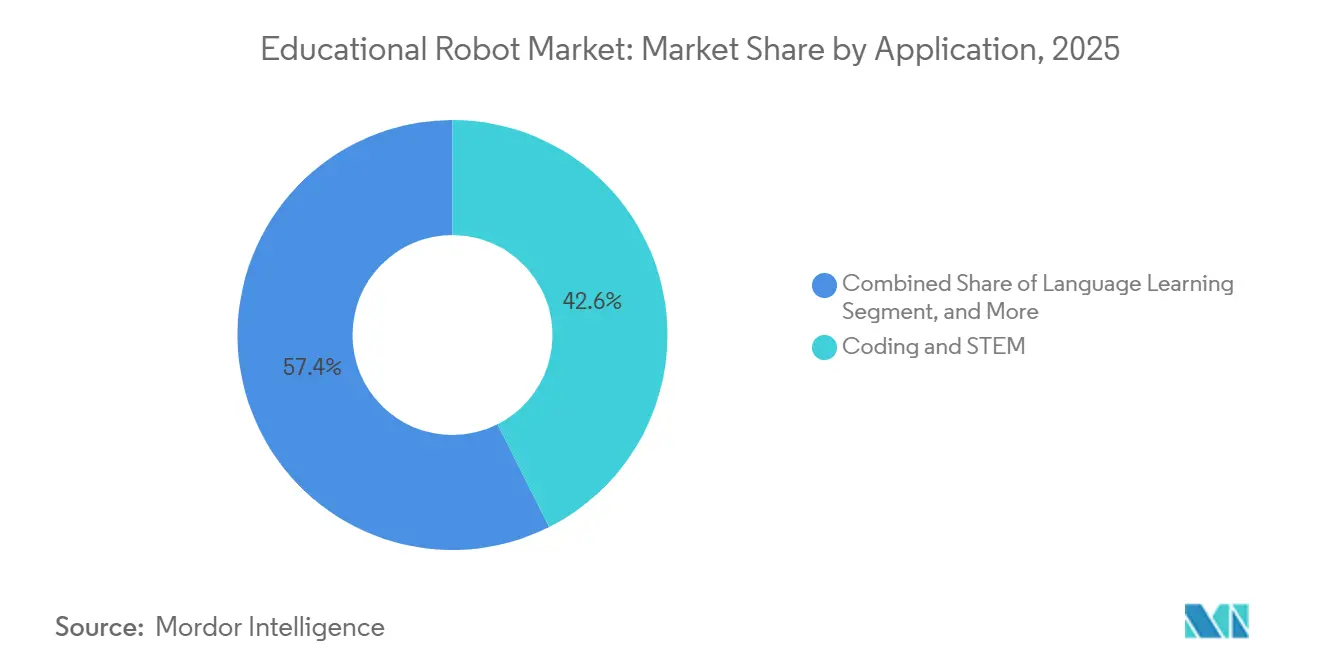
- By application, coding and STEM held 42.58% of demand in 2025, yet AI and robotics research is projected to advance at a 17.23% CAGR over the outlook period.
- By end user, schools accounted for 40.23% of 2025 revenue, but ed-tech companies are poised for the fastest expansion, with an 18.31% CAGR through 2031.
- By geography, Asia-Pacific dominated with 34.40% market share in 2025, while the Middle East records the strongest forecast CAGR at 17.92% through 2031.
Note: Market size and forecast figures in this report are generated using Mordor Intelligence’s proprietary estimation framework, updated with the latest available data and insights as of January 2026.
Global Educational Robot Market Trends and Insights
Drivers Impact Analysis*
| Driver | (~) % Impact on CAGR Forecast | Geographic Relevance | Impact Timeline |
|---|---|---|---|
| AI-enabled social robots for early-childhood language tutoring | +2.8% | East Asia, spreading into Southeast Asia | Medium term (2-4 years) |
| Mandatory robotics curriculum in K-12 schools in Europe | +3.2% | European Union, United Kingdom | Long term (≥ 4 years) |
| Government-funded STEM initiatives in North American universities | +2.5% | United States, Canada | Medium term (2-4 years) |
| Falling prices of education-grade servo motors and sensors | +2.1% | Global, strongest in Asia-Pacific and Latin America | Short term (≤ 2 years) |
| Remote and hybrid learning adoption of telepresence robots | +1.9% | North America, Europe, urban Asia-Pacific | Short term (≤ 2 years) |
| Corporate CSR budgets funding robotics labs in Middle East public schools | +1.6% | Saudi Arabia, United Arab Emirates, Qatar | Medium term (2-4 years) |
| Source: Mordor Intelligence | |||
Mandatory Robotics Curriculum in K-12 Schools Across Europe
The European Commission’s 2025 STEM Education Strategic Plan obliges every member state to weave computational thinking and robotics into core K-12 standards by the 2027-28 academic year.[1]European Commission, “STEM Education Strategic Plan,” Ministries of education now negotiate multi-year framework contracts, favoring ISO-certified vendors able to guarantee CE-compliant hardware and curriculum alignment. Finland earmarked EUR 120 million (USD 135.6 million) in 2025 to outfit 2,400 primary schools, while Germany reserved EUR 500 million (USD 565 million) through 2028 under Digital Pact 2.0. Because the directive insists robotics account for at least 10% of STEM contact time, the addressable classroom pool effectively doubles, and replacement demand will mirror curriculum-revision cycles rather than wear-and-tear schedules. By shifting purchasing power to national agencies, the rule stabilizes volume forecasts and encourages vendors to invest in local language content and long-term professional-development services.
Government-Funded STEM Initiatives Fueling University Procurement in North America
The U.S. National Science Foundation expanded its RITEL program in 2025, pledging USD 85 million over three years and stipulating that 40% of awards finance hardware for underserved institutions. Historically Black and Hispanic-serving colleges now access humanoid research platforms they previously could not afford, while Canadian counterpart NSERC committed CAD 60 million (USD 44.4 million) to create 15 regional robotics hubs. Grant recipients must publish open-source curriculum modules, trimming content-development costs for later adopters and accelerating usage beyond the initial grantees. Peer-reviewed evidence from these universities feeds district procurement cycles, reducing risk perceptions and moving educational robot market adoption further down the cost curve.
Adoption of AI-Enabled Social Robots for Early-Childhood Language Tutoring in East Asia
China’s 2025 policy requires every K-12 student to log at least eight hours of AI literacy annually, driving municipal orders for child-safe humanoid tutors. Seoul deployed 200 English-tutoring robots in 2024, observing 18% oral fluency improvements over one semester. Japan’s METI subsidized JPY 12 billion (USD 80.4 million) for robot-assisted language learning in rural prefectures. Efficacy data showing 0.38 standard-deviation vocabulary gains, according to a 2024 meta-analysis, bolster institutional confidence. Demographic pressures, namely aging teachers and shrinking class sizes, make humanoid tutors a cost-effective, scalable alternative to one-to-one human instruction.
Falling Prices of Education-Grade Servo Motors and Sensors
Shenzhen manufacturers now offer 180-degree analog servos for USD 3.50-48.90, versus USD 80-120 in 2020. Ultrasonic sensors dropped to USD 2.50-8.00 after Seeed Studio and others scaled production. Entry-level kit bills of materials have compressed from USD 250-400 to USD 80-150, allowing public schools in India, Brazil, and Indonesia to pilot robotics using local funds. Although 2025 U.S. tariffs erased 12-18% of the savings for American buyers, global total cost of ownership still registers 40-50% below 2020 levels. Brands with vertically integrated PCB lines, such as Makeblock, pass savings downstream faster than competitors reliant on contract assemblers, heightening price-tier segmentation inside the educational robot market.
Restraints Impact Analysis*
| Restraint | (~) % Impact on CAGR Forecast | Geographic Relevance | Impact Timeline |
|---|---|---|---|
| High battery-pack failure rates in tropical classrooms | -1.5% | Southeast Asia, Sub-Saharan Africa, Central America | Short term (≤ 2 years) |
| Limited multilingual content for non-Latin scripts | -1.2% | Middle East, South Asia, Sub-Saharan Africa | Medium term (2-4 years) |
| GDPR-driven compliance costs for cloud robots | -1.3% | European Union, United Kingdom | Long term (≥ 4 years) |
| Shortage of certified robotics instructors in rural Africa | -0.8% | Sub-Saharan Africa | Long term (≥ 4 years) |
| Source: Mordor Intelligence | |||
GDPR-Driven Data-Privacy Compliance Costs for Cloud-Connected Robots in Europe
GDPR threatens fines of EUR 20 million (USD 23.22 million) or 4% of global turnover, forcing vendors to implement consent workflows, conduct impact assessments, and conduct third-party audits that cost EUR 50,000-150,000 (USD 56,500-169,500) per European school district. Districts with per-pupil IT budgets below EUR 120 (USD 135) struggle to absorb the outlay, slowing deployments in Southern and Eastern Europe. Privacy-by-design clauses also shift processing to the device, elevating the bill of materials by 30-40% for edge AI chips. Non-compliant bidders are barred, as seen in France’s 2024 cancellation of a USD 12 million tender.[2]Commission Nationale de l’Informatique et des Libertés, “GDPR Enforcement Actions,” cnil.fr Extraterritorial reach means even non-EU vendors must appoint EU data officers, adding USD 40,000-80,000 in annual overhead that compresses margins on sub-USD 500 robots.
High Failure Rates of Battery Packs in Tropical Classrooms
Lithium-polymer batteries degrade 20-35% annually in humid heat, forcing Southeast Asian and African schools to replace packs every 18-24 months instead of the marketed 3-5-year span, inflating total ownership cost by up to 60%. Budget-limited districts respond by shelving robots after batteries fail, depressing utilization rates and elongating payback periods. Vendors are experimenting with active cooling casings and solid-state chemistries, but unit prices remain prohibitive for scale deployment. Until a durable solution arrives, administrators in tropical bands adopt shorter leasing contracts or pivot to tethered power supplies, dampening the educational robot market’s near-term penetration.
*Our forecasts treat driver/restraint impacts as directional, not additive. The impact forecasts reflect baseline growth, mix effects, and variable interactions.
Segment Analysis
By Type: Humanoid Form Factor Drives Social-Emotional Learning Premium
Humanoid robots captured 49.13% educational robot market share in 2025 and are projected to expand at a 15.03% CAGR through 2031. Their anthropomorphic design supports eye contact, gesture recognition, and proxemics that align with special-education and language-acquisition frameworks, prompting ministries to favor these units in compliance-driven tenders. A 2024 study showed children sustained attention 42% longer with humanoid tutors than with tablets. NAO and Yanshee dominate through curriculum partnerships that reduce teacher preparation time.
Non-humanoid platforms, including wheeled rovers and modular kits, lead in coding and maker spaces because schools can buy a full classroom set for the price of two humanoids. Improved durability extends replacement cycles to seven years, so vendors now bundle cloud content to maintain revenue. As therapeutic robots earn FDA clearances, insurance reimbursement moves humanoid purchases into clinical budgets, intensifying the bifurcation between premium social-learning devices and cost-focused STEM kits.


By Component: Software Subscriptions Outpace Hardware as Margins Shift
Hardware accounted for 58.36% of the educational robot market in 2025, yet software is growing fastest at a 16.17% CAGR. Districts pay USD 5-15 per student annually for curriculum libraries that integrate with Google Classroom and Canvas, reducing onboarding friction for teachers. Single Sign-On mandates, now at 62% of U.S. districts, create technical barriers while imposing switching costs once integrations are complete.
Hardware growth moderates as servos reach 50,000-cycle durability and schools stretch refresh intervals. Services revenue remains under-penetrated, but vendors offering multi-year professional development report 25% lower churn because teachers who log 20+ training hours weave robots into daily instruction. The longer-term trajectory points to software-defined classrooms where hardware functions as a durable endpoint while analytics and AI personalization engines monetize learning data.
By Education Level: Special Education Surges on Therapeutic Validation
Primary classrooms held 36.81% revenue in 2025, reflecting European and North American mandates. Special education, however, is the fastest riser at 18.63% CAGR thanks to FDA breakthrough designations that qualify therapeutic robots for Medicaid and private-insurance reimbursement.
Secondary education benefits from competition ecosystems such as VEX Robotics Competition, but participation dipped 12% between 2023 and 2025 amid post-pandemic extracurricular shifts.[3]National Center for Education Statistics, “K-12 Enrollment Projections,” nces.ed.gov Higher education splits between R1 institutions buying cutting-edge humanoids and teaching colleges opting for modular kits. Pre-primary adoption remains niche pending consensus on screen-time guidelines, yet humanoids’ ability to deliver screen-free storytelling may unlock uptake after 2027.
By Application: AI Research Platforms Gain University Traction
Coding and STEM accounted for 42.58% demand in 2025, sustained by block-based programming environments that flatten the learning curve. AI and robotics research is advancing at a 17.23% CAGR as universities seek ROS-compatible platforms for reinforcement-learning studies.
Language learning accounted for 24% of revenue, concentrated in East Asia, but expansion is limited by the scarcity of robust Arabic, Hindi, and Amharic content. Special-needs therapy overlaps with the special-education segment, growing as Medicaid coverage widens. Telepresence remains small but posted 35% year-over-year growth in 2025 as hybrid schedules endure, driving demand for Zoom-enabled mobile bases.

By End User: Ed-Tech Aggregators Scale Faster Than Individual Schools
Schools accounted for 40.23% of revenue in 2025, yet ed-tech companies are set to grow at an 18.31% CAGR, as content platforms such as ClassDojo bundle robotics modules into existing dashboards. LMS integration eliminates separate credentialing steps and offers district-wide analytics, shrinking procurement cycles.
Universities contribute 22% revenue, backed by public grants, though undergraduate CS enrollment slipped 9% from 2023-2025. Vocational institutes are expanding their reshoring initiatives, with Germany allocating EUR 200 million (USD 226 million) to modernize training labs. Special-education centers rely on insurance and philanthropic funding, resulting in lumpy demand. Maker spaces depend on grant cycles, causing seasonal spikes aligned with competition calendars.
Geography Analysis
Asia-Pacific generated 34.40% revenue in 2025, buoyed by China’s nationwide AI literacy rule that touches 200,000+ primary schools.[4]Ministry of Education, “AI Literacy Curriculum Requirements,” en.moe.gov.cn Japan provided JPY 12 billion (USD 80.4 million) in subsidies, and Seoul’s pilots achieved 18% gains in English fluency. India’s National Education Policy pushes coding from grade 6, but roll-out lags due to USD 15-30 per-pupil IT budgets. Australia shows private-school skew, with 68% of robotics kits in fee-paying campuses that house only 35% of students.
North America held a 28% share in 2025, yet growth slows as deployment saturation meets fiscal headwinds from shrinking student cohorts. NSF-funded hubs and Title I programs are pushing robots into underserved districts, but customs disputes have delayed Mexico’s rural pilots.
Europe accounted for a 24% share in 2025, dominated by the forthcoming curriculum mandate and constrained by GDPR compliance levies. Finland and Germany front-load capital, yet Southern Europe struggles with per-pupil IT budgets under EUR 120 (USD 135).
The Middle East, led by Saudi Arabia and the UAE, logs the highest regional CAGR at 17.92% as Vision 2030 CSR funds sponsor urban robotics labs. South America wrestles with 60% Brazilian tariffs and currency swings, though Argentina deployed 800 kits in 2025. Africa remains below 5% share in 2025, hampered by the 9% baseline of digital-skill readiness among rural youth.

Competitive Landscape
The educational robot market is moderately fragmented. Lego Education, VEX Robotics, Makeblock, UBTECH, and Wonder Workshop together control around 45% revenue. Their scale advantages appear in proprietary software ecosystems and global competition leagues that create high switching costs. VEX’s annual championship convenes 20,000 teams, reinforcing recurring part upgrades, while Lego’s presence in 140,000+ schools underpins cross-selling of content subscriptions.
Chinese manufacturers dominate the sub-USD 200 tier by harnessing vertically integrated Shenzhen supply chains that undercut Western pricing by up to 60%. Makeblock’s PCB lines enable rapid cost pass-through, whereas UBTECH and SoftBank lead patent filings for multimodal interaction frameworks that meld gaze, speech, and gesture tracking.
Ed-tech aggregators such as ClassDojo and Kahoot leverage existing LMS footprints to tack on robotics APIs, bypassing hardware sales channels and monetizing data-driven personalization. Standards work by IEEE aims to open communication protocols, potentially reducing vendor lock-in and intensifying price competition once interoperability norms mature.
Educational Robot Industry Leaders
SoftBank Robotics Corp.
UBTECH Robotics Inc.
Hanson Robotics Ltd.
Lego Education (The Lego Group)
Wonder Workshop Inc.
- *Disclaimer: Major Players sorted in no particular order

Recent Industry Developments
- January 2026: VEX Robotics began shipping the federally funded 5,000-kit deployment to Title I schools, with teacher training scheduled through July 2026.
- December 2025: VEX Robotics partnered with the U.S. Department of Education to supply 5,000 robotics kits to 12 states under an USD 18 million Strengthening Career and Technical Education grant.
- November 2025: UBTECH unveiled Walker S2, a USD 12,500 humanoid offering edge NLP in eight languages and targeting GDPR-sensitive markets.
- October 2025: Makeblock raised USD 25 million Series D, earmarked for cloud curriculum and Latin American distribution centers.


Research Methodology Framework and Report Scope
Market Definitions and Key Coverage
Our study defines the educational robot market as interactive, programmable humanoid and non-humanoid machines that are sold ready for use in formal or informal learning settings, where they deliver STEM, language, or special-needs instruction through physical or virtual interaction. According to Mordor Intelligence, revenues are tracked at manufacturer selling price and include associated software and service bundles.
Scope Exclusions: Kits or modular parts intended solely for industrial prototyping or hobbyist self-assembly are kept outside the study.
Segmentation Overview
- By Type
- Humanoid
- Non-Humanoid
- By Component
- Hardware
- Software
- Services
- By Education Level
- Pre-Primary (Kindergarten)
- Primary Education
- Secondary Education
- Higher Education
- Special Education
- By Learning Mode / Application
- Coding and STEM
- Language Learning
- AI and Robotics Research
- Special-Needs Therapy
- Telepresence and Remote Instruction
- By End User
- Schools
- Universities and Colleges
- Vocational Institutes
- Ed-Tech Companies
- Special-Education Centers
- Maker Spaces and Robotics Clubs
- By Geography
- North America
- United States
- Canada
- Mexico
- Europe
- Germany
- United Kingdom
- France
- Italy
- Spain
- Russia
- Rest of Europe
- Asia Pacific
- China
- Japan
- India
- South Korea
- ASEAN
- Australia and New Zealand
- Rest of Asia Pacific
- South America
- Brazil
- Argentina
- Rest of South America
- Middle East
- Saudi Arabia
- UAE
- Turkey
- Rest of Middle East
- Africa
- South Africa
- Nigeria
- Rest of Africa
- North America
Detailed Research Methodology and Data Validation
Primary Research
Mordor analysts interviewed school district technology directors, university lab heads, robot OEM product managers, and Ed-Tech distributors across North America, Europe, and Asia-Pacific. These discussions clarified typical classroom fleet sizes, ASP erosion patterns, and future funding intent, which helped us close gaps left by desk research and triangulate assumptions.
Desk Research
We began with public statistics from bodies such as UNESCO Institute for Statistics, World Bank education-spend dashboards, OECD PISA datasets, and customs shipment codes for service robots. Trade association releases from IFR and the Consumer Technology Association offered unit-flow clues, which were cross-checked with company 10-Ks and investor decks. Paid repositories including D&B Hoovers and Dow Jones Factiva supplied school procurement contracts and vendor revenue splits that sharpened regional share estimates. The sources listed are illustrative, and many additional publications were reviewed to build and validate our evidence base.
Market-Sizing & Forecasting
A top-down construct begins with education expenditure by level and country, which is then linked to historical robot penetration rates observed in import logs and survey findings. Select bottom-up checks, including average selling price multiplied by sampled vendor volumes, temper the totals. Key drivers such as classroom digitization budgets, STEM curriculum mandates, sensor price curves, and humanoid servo cost declines feed a multivariate regression that generates the 2025-2030 outlook. Where supplier data were incomplete, we interpolated using regional adoption cascades validated with experts.
Data Validation & Update Cycle
Before release, every model passes a two-analyst peer review, variance thresholds trigger re-contacts, and the database refreshes annually, with ad-hoc updates after material policy or technology shocks.
Why Mordor's Educational Robot Baseline Earns Trust
Published values often differ because firms select varying robot categories, price bases, and refresh cadences.
Key Gap Drivers include whether refurbished kits are counted, if future government grants are front-loaded, and the degree to which ancillary software subscriptions are capitalized.
Benchmark comparison
| Market Size | Anonymized source | Primary gap driver |
|---|---|---|
| 1.8 B (2025) | Mordor Intelligence | |
| 1.38 B (2024) | Global Consultancy A | excludes software services and uses factory shipments only |
| 1.90 B (2024) | Industry Publisher B | wider scope that folds entertainment robots into education totals |
| 1.4 B (2022) | Sector Study C | older base year and static ASP assumption |
In summary, by anchoring scope to in-class pedagogical use, refreshing data every year, and validating top-down results with on-ground checks, Mordor Intelligence delivers a balanced baseline that decision-makers can reproduce and defend.


Key Questions Answered in the Report
How large is the educational robot market in 2026?
The educational robot market size is USD 2.07 billion in 2026 and is forecast to reach USD 4.11 billion by 2031.
Which form factor leads current sales?
Humanoid robots hold 49.13% educational robot market share in 2025 and are projected to grow at a 15.03% CAGR through 2031.
What segment is expanding fastest by application?
AI and robotics research platforms show the highest growth, advancing at a 17.23% CAGR as universities require ROS-compatible units.
Which region records the quickest future growth?
The Middle East is projected to expand at a 17.92% CAGR, driven by Vision 2030 CSR funding in Saudi Arabia and the UAE.
What key restraint slows adoption in Europe?
GDPR compliance adds EUR 50,000-150,000 in up-front costs per district and compels on-device data processing, raising hardware prices.
How are vendors shifting revenue models?
Companies increasingly bundle cloud-based curriculum subscriptions and analytics, moving margins from hardware to recurring software fees.
Page last updated on:


