
Dry Cleaning And Laundry Market Size and Share
Market Overview
| Study Period | 2020 - 2031 |
|---|---|
| Forecast Data Period | 2026 - 2031 |
| Market Size (2026) | USD 27.11 Billion |
| Market Size (2031) | USD 41.19 Billion |
| Growth Rate (2026 - 2031) | 8.71 % |
| Largest Market | Asia Pacific |
| Market Concentration | Low |
Major Players *Disclaimer: Major Players sorted in no particular order Image © Mordor Intelligence. Reuse requires attribution under CC BY 4.0. | |
Dry Cleaning And Laundry Market Analysis by Mordor Intelligence
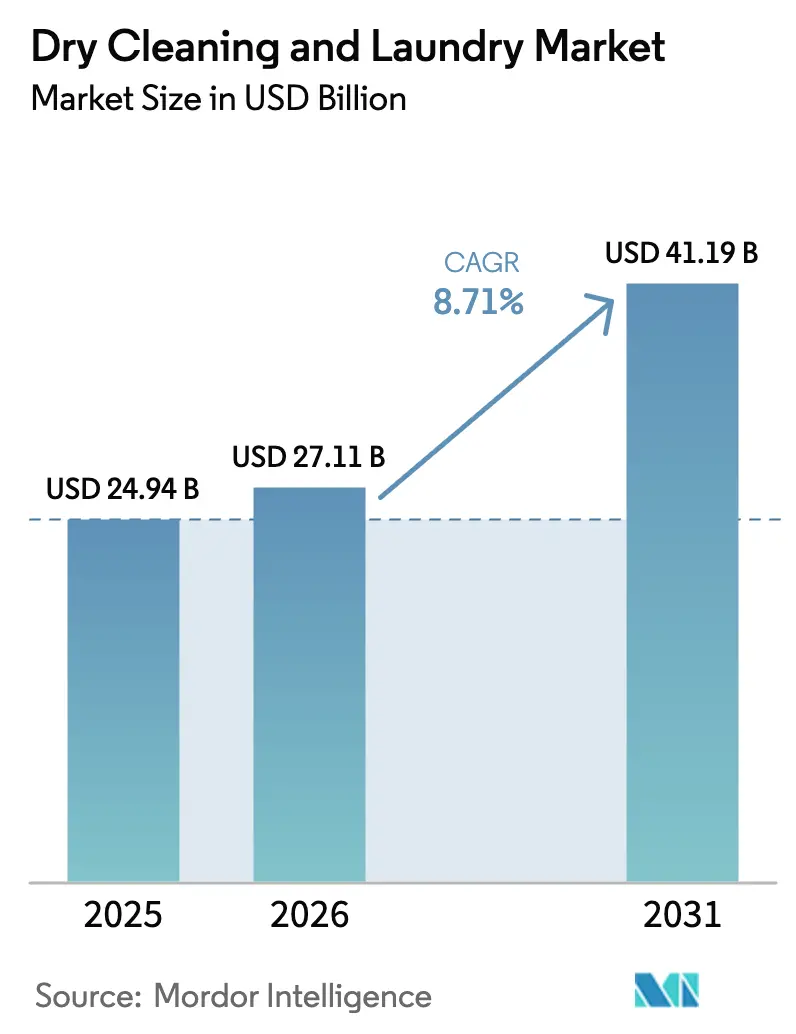
The dry-cleaning and laundry market size in 2026 is estimated at USD 27.11 billion, growing from 2025 value of USD 24.94 billion with 2031 projections showing USD 41.19 billion, growing at 8.71% CAGR over 2026-2031. Demand is underpinned by rapid urbanization, expanding middle-class spending, and lifestyle shifts that favour time-saving services, especially in metropolitan hubs across the Asia-Pacific. Regulatory bans on legacy solvents and concurrent investment in energy-efficient machinery are tilting competitive advantage toward operators that can fund plant upgrades. Meanwhile, corporate pressure to report Scope-3 emissions is prompting large enterprises to reassess laundry outsourcing contracts, thereby opening new premium service opportunities. Platform economics are also reshaping the competitive field as on-demand apps scale through multi-city acquisitions and franchise partnerships, compressing the long tail of independent storefronts.
Key Report Takeaways
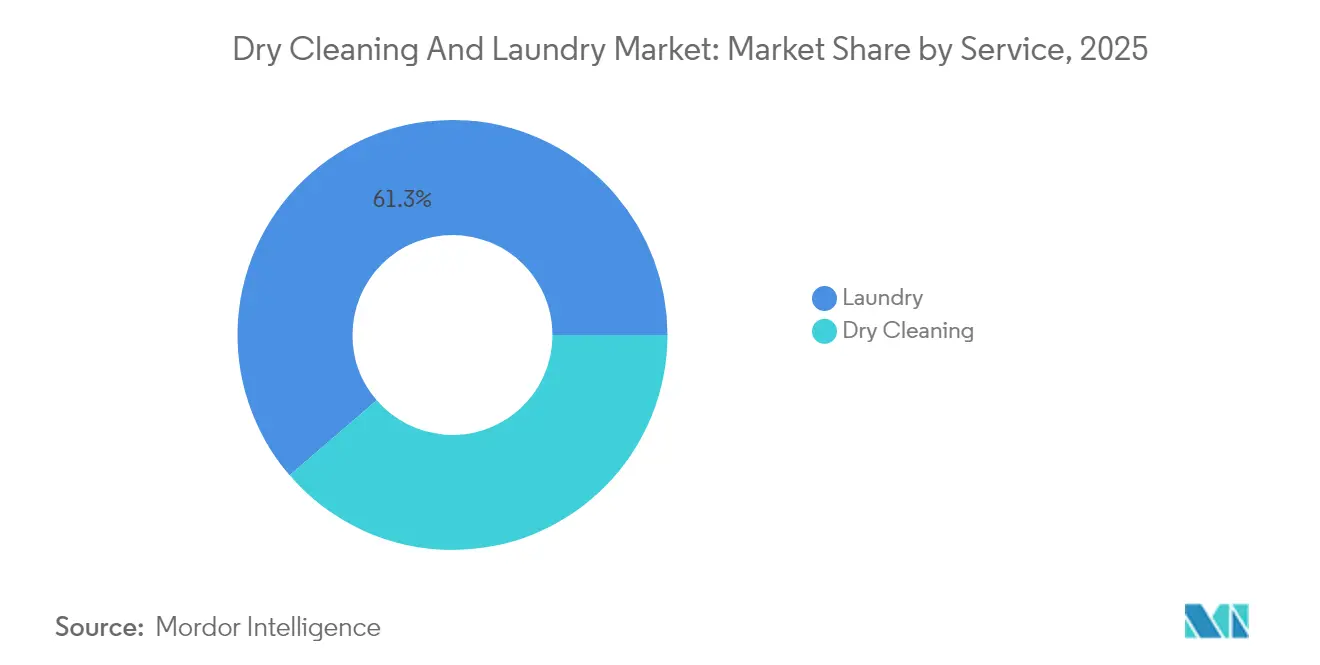
- By service, laundry captured 61.32% of the dry-cleaning and laundry market share in 2025; dry cleaning is projected to grow at an 8.14% CAGR through 2031.
- By application, commercial services accounted for 51.77% of the dry-cleaning and laundry market size in 2025, while residential services are expected to expand at a 9.56% CAGR to 2031.
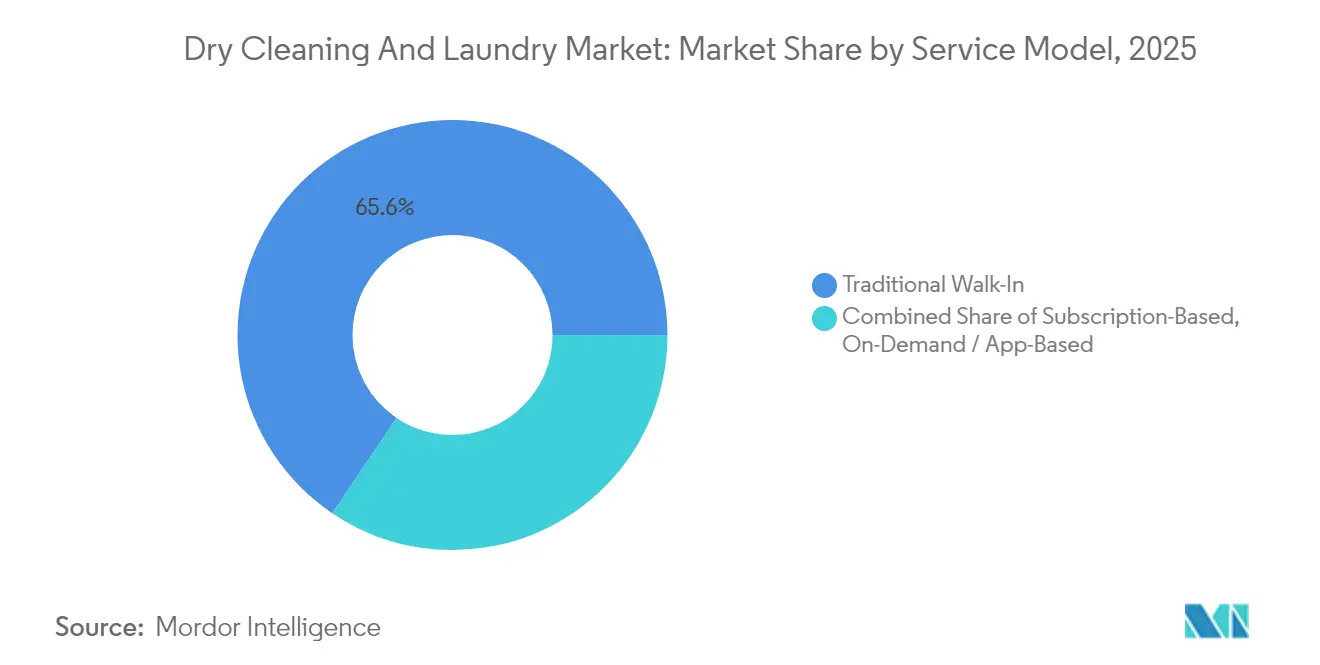
- By service model, traditional walk-in outlets held 65.55% revenue share of the dry-cleaning and laundry market in 2025; app-based platforms are forecast to register a 14.72% CAGR during 2026-2031.
- By geography, Asia-Pacific represented 37.42% of global revenue of the dry-cleaning and laundry market in 2025 and is advancing at a 9.06% CAGR through 2031.
Note: Market size and forecast figures in this report are generated using Mordor Intelligence’s proprietary estimation framework, updated with the latest available data and insights as of 2026.
Global Dry Cleaning And Laundry Market Trends and Insights
Drivers Impact Analysis*
| Driver | (~) % Impact on CAGR Forecast | Geographic Relevance | Impact Timeline |
|---|---|---|---|
| Rising dual-income urban households | +1.8% | Global urban centres | Medium term (2-4 years) |
| Growth of on-demand app-based services | +2.1% | North America & Asia-Pacific | Short term (≤ 2 years) |
| Hospitality & healthcare linen outsourcing | +1.5% | Mature healthcare and tourism markets | Long term (≥ 4 years) |
| Adoption of advanced wet-cleaning machinery | +0.9% | North America & Europe | Medium term (2-4 years) |
| ESG-driven shift to low-solvent processes | +1.2% | North America & Europe | Long term (≥ 4 years) |
| Corporate ESG disclosure mandates on Scope-3 emissions | +0.7% | Markets with mandatory ESG reporting | Long term (≥ 4 years) |
| Source: Mordor Intelligence | |||
Rising Dual-Income Urban Households Drive Service Demand
Time-pressed dual-income families in megacities continue to outsource garment care, and 70% of Japanese coin-laundry patrons surveyed in 2025 reported higher visit frequency versus the prior year [1]. Consumers cite hygiene, professional finishing quality, and the ability to process bulky items as top reasons for repeat use. The trend is reinforced, not cannibalized, by premium home-appliance adoption: Samsung’s Bespoke AI Laundry Combo surpassed 100,000 domestic sales within a single year, illustrating that households segment fabric-care decisions by garment type rather than substituting one channel for another [2]. Urban population density magnifies this preference because smaller apartments limit in-home washer capacity. As similar demographics scale across India, China, and Indonesia, volumes for pick-up-and-delivery operators are expected to accelerate. The resulting uplift contributes roughly 1.8 percentage points to global CAGR, especially in Asia-Pacific conurbations.
Growth of On-Demand App-Based Services Transforms Market Access
Mobile platforms remove location constraints by aggregating demand across neighbourhoods and then routing garments to centralized plants. Cents, whose SaaS software now runs more than 2,700 laundries, recently closed a USD 40 million Series B round to deepen route optimization and payment integration at TRYCENTS.COM [3] . Singapore operators are experimenting with café-laundromat hybrids and AI-enabled locker drop-off to elevate the customer experience and justify premium tariffs. App ecosystems also capture granular service data, enabling dynamic pricing and subscription bundles that stabilize revenue. Lower customer-acquisition cost and higher lifetime value are encouraging venture-capital inflows that speed regional roll-outs. The combination of funding, technology, and consumer convenience is forecast to add about 2.1 percentage points to CAGR over the near term.
Hospitality & Healthcare Linen Outsourcing Reinforces Commercial Revenue
Specialized laundry providers are winning long-term contracts from hospitals seeking infection-control certifications such as HLAC, and from hotels aiming to improve linen turnaround. Healthcare facilities in the United States are increasingly investing in linen management solutions, driven by the adoption of RFID tracking technology. This technology enables facilities to minimize linen loss rates and maintain accurate records of wash temperatures, which are critical for compliance during audits. This trend is contributing to a notable rise in healthcare linen expenditure across the country. Outsourcing lowers capital expenditure for end users and shifts labor compliance risks to professional operators. ESG reporting by hotel chains further favors accredited vendors able to quantify water and energy savings. Outside North America, upscale tourism corridors in the Middle East and Southeast Asia are following similar playbooks. These forces collectively contribute an estimated 1.5 percentage-point lift to the dry-cleaning and laundry market CAGR.
Adoption of Advanced Wet-Cleaning Machinery Accelerates
Next-generation wet-cleaning systems from Fagor Professional process 95% of traditionally “dry-clean only” garments by modulating drum rotation, detergent dosage, and humidity curves [4]. The approach eliminates perchloroethylene and reduces operator exposure to volatile organic compounds. With the U.S. Environmental Protection Agency imposing a 10-year sunset on new PCE machine purchases, owners are front-loading equipment upgrades to avoid stranded assets. European operators benefit from utility rebates that lower payback periods on high-efficiency washers. Manufacturers are responding with modular platforms that fit in existing footprints, minimizing retrofit downtime. As more cleaners cross the investment hurdle, the technology contributes a 0.9 percentage-point tailwind to market growth.
Restraints Impact Analysis*
| Restraint | (~) % Impact on CAGR Forecast | Geographic Relevance | Impact Timeline |
|---|---|---|---|
| Volatile commercial energy & utility costs | -1.4% | Global, acute in Europe | Short term (≤ 2 years) |
| Stringent solvent-use regulations | -0.8% | North America & Europe | Medium term (2-4 years) |
| Labor scarcity in urban centres | -1.1% | Developed urban markets | Medium term (2-4 years) |
| Consumers move toward do-it-yourself laundry tech | -0.6% | Technology-advanced markets | Long term (≥ 4 years) |
| Source: Mordor Intelligence | |||
Volatile Commercial Energy & Utility Costs Pressure Margins
Utilities typically represent 15-20% of revenue for self-service laundries, and recent electricity spikes pushed owners to execute mid-cycle price increases, according to Cents’ benchmarking dashboards. European plants contend with natural-gas volatility that disrupts financial planning and slows new-store openings. In reaction, operators negotiate bulk purchasing contracts or install heat-recovery systems, but upfront capital demands strain liquidity. Smaller independents, unable to absorb price swings, risk exit or consolidation. The margin squeeze subtracts roughly 1.4 percentage points from forecast CAGR, especially in price-sensitive neighbourhoods.
Stringent Solvent-Use Regulations Create Compliance Costs
The EPA’s nationwide ban on perchloroethylene and trichloroethylene forbids new machine installations effective immediately and mandates a complete phase-out within 10 years. European regulators are considering parallel measures, and several U.S. states are accelerating timelines beyond the federal rule. Operators must invest in hydrocarbon, silicone, or wet-cleaning systems that cost 20-40% more than legacy units. Although long-term environmental benefits are clear, near-term cash-flow pressure slows expansion projects. The regulatory burden drags the dry-cleaning and laundry market CAGR by an estimated 0.8 percentage points during the transition window.
*Our forecasts treat driver/restraint impacts as directional, not additive. The impact forecasts reflect baseline growth, mix effects, and variable interactions.
Segment Analysis
By Service: Laundry Dominance With Dry-Cleaning Innovation
Laundry services represented 61.32% of the dry-cleaning and laundry market share in 2025, underscoring the high-frequency, bulk-processing nature of sheets, towels, and everyday apparel. The segment scales efficiently through tunnel washers and continuous-batch dryers that cut per-pound utility costs. Commercial contracts from hotels and hospitals drive weekday plant utilization, while weekend self-service volumes smooth revenue cycles. Dry cleaning, though smaller, is projected to outpace at an 8.14% CAGR through 2031 thanks to solvent-free technologies that expand the addressable garment base. Operators are leveraging liquid silicone and professional wet-cleaning to position premium services that command higher ticket sizes per item, thereby elevating overall margins.
Second-order effects include ancillary revenue from garment repair, restoration, and preservation, which ride on the same storefront traffic. Cross-training staff to switch between wet and dry lines reduces downtime and spreads fixed labor across service categories. Marketing campaigns now emphasize allergen reduction and microfiber removal to align with consumer wellness trends. As regulations force PCE exits, early adopters gain brand value around safety and sustainability, reinforcing their ability to upsell additional items. Together, these factors ensure that dry-cleaning and laundry market revenues from both service types continue to climb in tandem.

By Application: Commercial Leadership With Residential Acceleration
In 2025, commercial operators accounted for 51.77% of the total revenue, with the healthcare linen segment demonstrating substantial market value within the U.S. market. The implementation of mandatory infection-control audits has heightened entry barriers, ensuring the establishment of multi-year contracts that contribute to consistent and predictable cash flows for service providers. Additionally, the adoption of RFID-enabled inventory systems has significantly reduced linen loss by up to 30%. This cost-saving measure is partially shared between hotels, hospitals, and service providers, further reinforcing the viability and attractiveness of the B2B outsourcing model in this sector. Corporate campuses are adding uniform programs to reinforce branding and hygiene, tacking incremental volume onto existing daily routes. These structural characteristics anchor commercial demand and help stabilize plant throughput during economic slowdowns.
Residential demand, however, is catching up as dual-income households outsource larger portions of weekly wash loads and specialty garment care. Delivery apps bundle wash-and-fold with subscription pickups, increasing customer lifetime value beyond traditional ticket averages. Operators partner with multifamily property managers to install locker-based drop points that eliminate courier wait times. In metro Tokyo and Seoul, delivery cleaning penetration among fashion-conscious consumers aged 20-40 already exceeds 22%. Consequently, residential volume growth at 9.56% CAGR is set to narrow the revenue gap with commercial accounts without cannibalizing institutional contracts.
By Service Model: Traditional Dominance Challenged by Digital Innovation
Traditional walk-in stores captured 65.55% of 2025 revenue because legacy neighbourhood locations still deliver same-day turnaround and personalized garment evaluation. Generational customer relationships sustain visit frequency even as real-estate costs climb. Many owners upgrade point-of-sale systems and add QR code tracking to remain competitive, blending analogue trust with digital convenience. Route planners optimize daily delivery runs to widen catchment areas without opening new bricks-and-mortar sites. These adjustments help heritage players retain market relevance.
App-based aggregators, however, are rewriting cost structures by deploying centralized plants that process garments at scale. Cents-enabled laundries report 15% higher machine utilization after adopting real-time pricing analytics. Cashless payments reduce handling errors and speed checkout, improving overall customer-satisfaction scores. Data exhaust from pickups informs localized marketing, allowing platforms to offer targeted promotions, which sustains a 14.72% CAGR for this model. Subscription hybrids that combine locked-in monthly volumes with à-la-carte upgrades are emerging, offering predictable revenue to operators and budget certainty to consumers. The interplay of models ensures that the dry-cleaning and laundry market retains multiple entry points for different customer segments.
Geography Analysis
Asia-Pacific generated 37.42% of global revenue in 2025, and its dry-cleaning and laundry market size is projected to advance at a 9.06% CAGR through 2031. China manufactured 79.96 million washing machines in 2023, underlining the region’s appliance penetration and export capacity. India’s organized garment-care chains are rapidly franchising in Tier-2 cities, where middle-class households seek branded service reliability. Government initiatives promoting women’s workforce participation further enlarge the customer base for outsourced laundry.
North America remains a high-revenue region owing to entrenched subscription models and well-capitalized plant infrastructure. Approximately 29,500 coin laundries generate nearly USD 5 billion in annual gross revenue, and modernization initiatives emphasize touchless payments and high-extract washers to shorten cycle time. The United States leads solvent-free regulation, pushing innovation toward wet-cleaning and liquid-carbon-dioxide machines. Canada’s hotel sector, buoyed by international events, is renewing linen service contracts that prioritize ESG metrics. Although growth is slower than in emerging economies, margin expansion through technology and sustainability surcharges keeps profitability attractive.
Europe posts steady but modest expansion as regulatory alignment around the Green Deal propels adoption of biodegradable detergents and water-recycling systems. The Netherlands alone expects more than USD 755 million in laundry-care revenue during 2025 underpinned by plant-based product preferences. German federal seed funding earmarked for waterless textile-cleaning prototypes illustrates public-sector backing for eco-innovations. Southern European tourism recovery lifts hotel linen volumes, while northern markets see corporate uniform programs rise with renewed manufacturing activity. Across the continent, digital labelling mandates under revision will require providers to embed QR codes that disclose garment-care footprints, fostering transparency and differentiation.
Regulatory Landscape
Environmental and chemical-management rules are tightening around solvent-based dry cleaning. In the United States, the Environmental Protection Agency (EPA) finalized a nationwide ban covering perchloroethylene (PCE) and trichloroethylene (TCE) in December 2024. The rule prohibits new machine installations effective immediately and sets a 10-year phase-out for existing machines, which accelerates the shift toward wet-cleaning and other low-solvent alternatives and increases compliance-driven capital needs for smaller operators.
Beyond chemical restrictions, large multinational providers increasingly face expanding ESG and supply-chain compliance obligations that shape procurement and contracting. In the European Union, Elis aligns disclosures to the EU Taxonomy Regulation (Regulation 2020/852) and CSRD reporting requirements. In the United States, Cintas maintains California Transparency in Supply Chains Act (SB-657) disclosures and files conflict-minerals reporting with the SEC (Form SD) aligned to OECD due-diligence expectations. Aramark reinforces supplier governance through its Global Supplier Code of Conduct and published an updated Modern Slavery Act statement dated March 31, 2026, reflecting the growing compliance burden around labor practices, traceability, and auditability across global sourcing.
Value Chain Analysis
The value chain covers equipment and consumables (commercial washers, dryers, finishing equipment, detergents and chemicals, RFID and POS systems), garment intake (walk-in, lockers, and pickup-and-delivery routing), processing at stores or centralized plants (sorting, washing/dry-cleaning or wet-cleaning, drying, pressing/finishing, and packaging), and last-mile delivery with customer support and billing. Technology and data layers are increasingly part of operations, particularly for route optimization, cashless payments, item tracking, and audit-ready sustainability reporting that commercial customers increasingly request.
Upstream, scale operators differentiate through formal supplier governance and risk controls that affect cost, quality, and compliance. Aramark applies a Sustainable Sourcing Framework that covers issue monitoring and stakeholder engagement through strategy setting, implementation, and tracking/reporting, and uses supplier sustainability assessments to manage environmental and social impacts. Cintas and Aramark supplier programs typically require adherence to codes of conduct, third-party audits (announced and unannounced), and corrective-action plans for zero-tolerance findings such as forced labor. Elis integrates ESG reporting disciplines tied to EU disclosure requirements, which makes supplier traceability and standardized metrics a practical requirement for winning and retaining multi-site commercial accounts.
Competitive Landscape
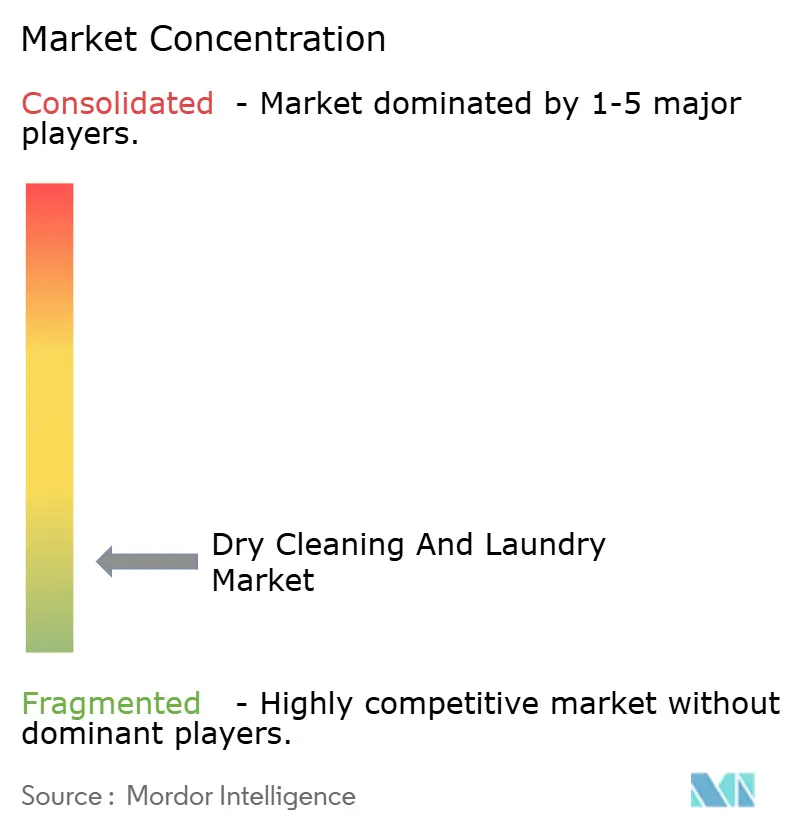
The sector is characterized by significant fragmentation, with leading players collectively contributing only a limited share to the overall global revenue. This indicates a competitive landscape where market dominance is distributed among numerous participants, highlighting opportunities for consolidation and strategic positioning. Cintas accelerated consolidation by acquiring Huebsch Services in February 2025, deepening its regional linen-rental density. EVI Industries followed with its USD 43 million purchase of Girbau North America, signaling appetite for vertical integration that marries equipment supply with service operations. These transactions highlight a strategy of scale procurement to negotiate utility rates and supplier discounts that smaller competitors cannot access.
Technology partnerships are just as pivotal. Samsung collaborates with commercial operators to pilot AI-driven cycle recommendations, cutting water usage by up to 20% per pound processed. Hydro Systems’ IoT dosing equipment provides real-time chemical-consumption dashboards, giving enterprise customers auditable sustainability data that reinforce long-term contracts. Clean Brands, parent to Martinizing and Lapels, standardizes solvent-free processes across its franchise base to lock in brand equity around green positioning.
Looking forward, public policy will continue to define competitive thresholds. Compliance with solvent bans and digital product passports requires capital intensity that favors well-funded chains. Yet localized service nuances—such as garment-care traditions and climate-driven fabric differences—still leave room for nimble regional specialists. Consequently, M&A momentum is expected to remain brisk as operators seek national scale without sacrificing local market knowledge.
Dry Cleaning And Laundry Industry Leaders
-
Cintas Corporation
-
Elis SA
-
Aramark Corporation
-
Johnson Service Group plc
-
CSC ServiceWorks
- *Disclaimer: Major Players sorted in no particular order
Market Opportunities and Future Outlook
Micro-fulfillment style urban hubs are emerging as a specific operating model for balancing convenience with plant-level efficiency as app-based and pickup-and-delivery models scale. Centralized processing paired with neighborhood lockers or drop points reduces courier dwell time and expands catchment areas without adding storefront real estate, which aligns with the market shift toward digital ordering and tracking. Funding and software penetration supports this approach, including Cents reaching more than 2,700 laundries on its SaaS platform and raising USD 40 million in Series B funding to deepen routing and payment integration.
Circular and sustainability-linked programs are also becoming a commercial differentiator that can be packaged into premium contracts, especially in workwear and linen rental where auditability matters. The EU’s CSRD and EU Taxonomy frameworks push large service providers to formalize climate and sourcing roadmaps and to standardize supplier data; Elis refreshed its 2030 CSR roadmap in March 2026 and maintains external ESG ratings (for example, CDP and MSCI at A), supporting bids built around measurable water, energy, and emissions performance. Aramark’s use of EcoVadis for supplier sustainability assessments points to a procurement norm where documented supply-chain performance is part of vendor selection, creating room for laundries that invest in traceability, verified sourcing, and measurable process efficiency rather than competing only on price.
Recent Industry Developments
- July 2026: Elis S.A. acquired 100% of ServBrasil Soluções Em Lavanderia Ltda in Brazil, effective July 1, 2026. The acquisition expands geographic coverage in Brazil with healthcare linen services, enhancing regional capacity. The move increases network density and strengthens service capabilities across the Latin America healthcare segment.
- June 2026: Elis S.A. acquired 100% of RS10 Servicios Tratamientos y Mantenimientos de Tejidos S.L. in Spain, effective June 1, 2026. This adds expansion into Spain's flat linen and workwear services. The acquisition strengthens European footprint and cross-border service mix.
- May 2026: Elis S.A. acquired 100% of Wäsche Perle in Switzerland, effective May 1, 2026. The deal expands Swiss hospitality linen services. It solidifies premium outsourcing capabilities in Western Europe.
Research Methodology Framework and Report Scope
Market Definition and Coverage
For this study, the market is defined as revenue earned from providing dry-cleaning and laundry services to residential and commercial customers. It includes order capture, cleaning, finishing, and delivery or pickup across organized and unorganized operators.
Scope exclusions: This market sizing excludes the sale of laundry appliances, detergents, and chemicals when they are not billed as part of a cleaning service.
Segmentation Overview
- By Service
- Laundry
- Dry Cleaning
- By Application
- Residential
- Commercial
- By Service Model
- On-Demand / App-Based
- Subscription-Based
- Traditional Walk-In
- By Geography
- North America
- United States
- Canada
- Mexico
- South America
- Brazil
- Peru
- Chile
- Argentina
- Rest of South America
- Europe
- United Kingdom
- Germany
- France
- Spain
- Italy
- BENELUX (Belgium, Netherlands, Luxembourg)
- NORDICS (Denmark, Finland, Iceland, Norway, Sweden)
- Rest of Europe
- Asia-Pacific
- China
- India
- Japan
- Australia
- South Korea
- South-East Asia (Singapore, Malaysia, Thailand, Indonesia, Vietnam, Philippines)
- Rest of Asia-Pacific
- Middle East & Africa
- United Arab Emirates
- Saudi Arabia
- South Africa
- Nigeria
- Rest of Middle East & Africa
- North America
Data Sources, Market Sizing, and Validation
Desk Research
Desk research is used to set the base structure of the model and to make sure our assumptions sit within real world operating conditions. We review public statistics on consumer spending and service inflation, and we also look at labor and wage trends, since labor is a major cost driver for laundry and dry-cleaning services.
Typical reference points include the US Bureau of Labor Statistics, the US Census Bureau, the World Bank, UN Comtrade, and national environment agencies that publish solvent and wastewater compliance guidance. We also use company filings, investor presentations, trade association updates, and reputable business press to understand shifts in service mix, including pickup and delivery. In addition, paid subscriptions for company financials and intelligence, news and financials, and an import or export shipment-level database were used selectively to validate unit economics, equipment sourcing signals, and expansion patterns. These desk sources are illustrative only, and additional references were used to collect data, validate assumptions, and clarify open questions.
Primary Interviews and Surveys
Primary work is used to pressure-test the desk view and to close gaps that are hard to observe in public data, such as average order values, the mix of wash-and-fold versus dry cleaning, and typical utilization patterns by outlet type. We speak with operators, franchise managers, equipment and chemical distributors, and commercial buyers from hospitality, healthcare, and uniform programs across major regions so pricing and volume assumptions reflect what is actually billed and delivered.
Distribution of primary research fieldwork respondents
| Company type | Respondent position | Region |
|---|---|---|
| Top tier: 37% | CXOs: 17% | APAC: 51% |
| Mid tier: 44% | Functional/Unit leaders: 24% | EMEA: 31% |
| Smaller Players: 19% | Managers: 59% | Americas: 18% |
Market-Sizing & Forecasting
Sizing starts with a top-down build where service revenues are reconstructed by linking addressable population and commercial linen demand pools to service penetration and spend per user, then filtering by observable pricing and inflation signals. Once the regional totals are formed, we corroborate them with selective bottom-up approximations, such as sampled outlet throughput checks, channel checks on pickup and delivery mix, and a sanity check using typical average ticket size multiplied by estimated order frequency.
Key model inputs include urbanization and working population trends, hospitality room supply and occupancy direction, healthcare activity proxies that influence linen turnover, service price inflation for personal services, and wage growth that can shift service pricing. For forecasting, scenario analysis is used so the model can reflect reasonable paths for app-based adoption, solvent compliance related capex, and the pace of commercial contract additions, then reviewed with expert feedback before finalizing the forward curve. Where local bottom-up inputs are thin, assumptions are anchored to similar city clusters and adjusted using region-specific price levels and service density.
Data Validation & Update Cycle
Outputs are cross-checked against independent signals, including macro consumer spend trends, service inflation movement, and commercial demand direction from end-user sectors, and then variances are investigated before sign-off. If a region shows an unusual jump in revenue per customer or an outlier growth rate, we re-check pricing, penetration, and mix assumptions and, when needed, reconnect with industry participants to confirm what changed.
Each report goes through multi-step analyst review so inputs, math, and narrative remain consistent across geographies. The dataset is refreshed annually, and interim updates are triggered when material events occur, such as regulatory changes affecting cleaning solvents or a major shift in delivery-led models. Before delivery, a final pass is completed to make sure clients receive the latest updated view.
Mordor Intelligence's Dry Cleaning and Laundry Market Size Compared With Other Published Estimates
It is common to see different market values for dry cleaning and laundry services because studies do not always count the same service lines, customer types, or service models in the same way. Numbers can also move when pricing is converted across currencies at different points in time and when the base year is not aligned.
By checking order-level pricing, outlet throughput, and the split between residential tickets and commercial contracts, Mordor Intelligence ties the total to billed service revenue and keeps laundromat-style self-service activity and product sales outside the market when they are not charged as a service.
Benchmark comparison
| Source | Market Size | Gaps in Research Methodology |
|---|---|---|
| Mordor Intelligence | USD 27.11 B (2026) | |
| Industry Data Publisher A | USD 117.70 B (2025) | Uses a broad industry classification that can include self-service facilities and a wider set of laundry service activities across many countries, which expands the counted revenue pool beyond billed full-service dry cleaning and laundry services. |
| Syndicated Research Outlet B | USD 70.00 B (2025) | Often applies broader service-provider and end-user coverage, and the gap can be driven by including industrial service lines plus different assumptions on price progression and adoption pace for mobile and full-service options. |
The spread across publishers is mainly explained by what is treated as a service transaction and how far the market is extended into self-service and industrial line items. Our method stays repeatable because the totals are built from clear demand pools, checked with real operator pricing and utilization inputs, and then reviewed for outliers before the final number is locked.
Key Questions Answered in the Report
What is the current global value of professional dry-cleaning and laundry services?
Global revenue reached USD 27.11 billion in 2026 and is forecast to climb to USD 41.19 billion by 2031, reflecting an 8.71% CAGR.
Which region delivers the fastest growth in professional garment-care services?
Asia-Pacific leads with a 9.06% CAGR through 2031, powered by urbanization, rising disposable income, and limited in-home washer capacity in dense cities.
How are environmental regulations affecting solvent-based dry cleaning?
The U.S. Environmental Protection Agency has banned new perchloroethylene and trichloroethylene machines and set a 10-year phase-out for existing units, accelerating investment in wet-cleaning and hydrocarbon systems.
Why are on-demand laundry apps gaining traction?
Mobile platforms bundle pickup, delivery, and real-time tracking, lowering customer-acquisition costs and supporting 14.72% CAGR growth for app-based services.
What is the main cost pressure facing laundromat owners today?
Utilities now account for 15-20% of revenue, and volatility in electricity and water rates is forcing many operators to raise prices or invest in high-efficiency equipment.