Dosimeter Market Size and Share
Market Overview
| Study Period | 2020 - 2031 |
|---|---|
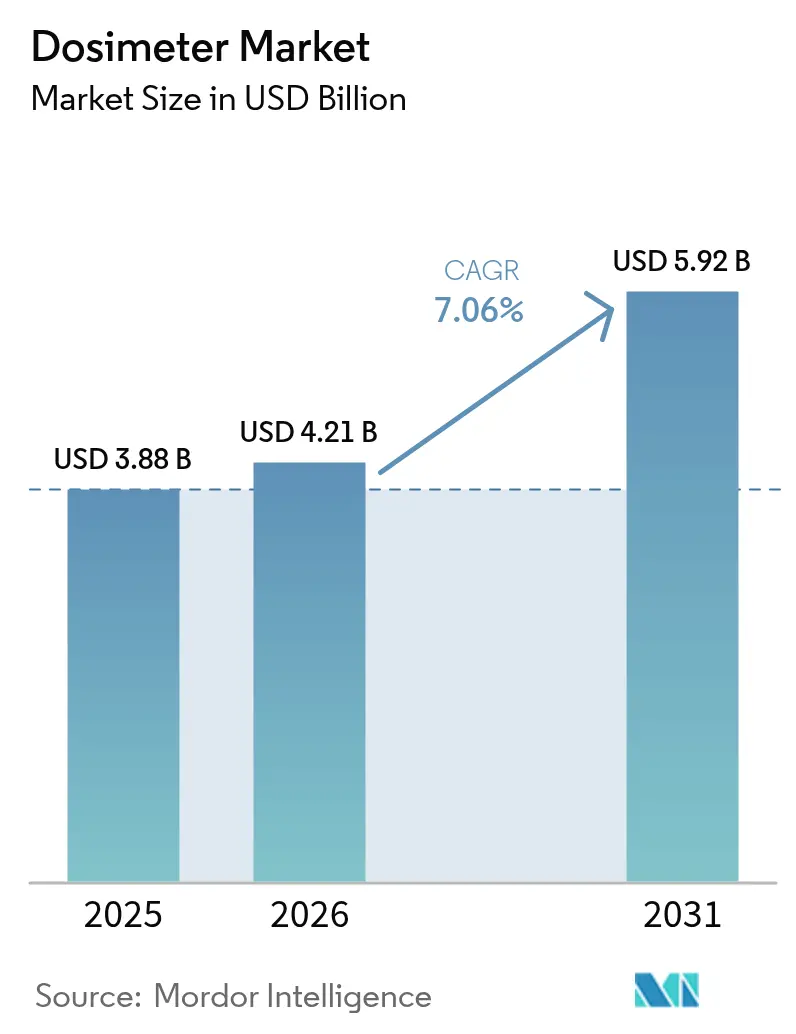
| Market Size (2026) | USD 4.21 Billion |
| Market Size (2031) | USD 5.92 Billion |
| Growth Rate (2026 - 2031) | 7.06% CAGR |
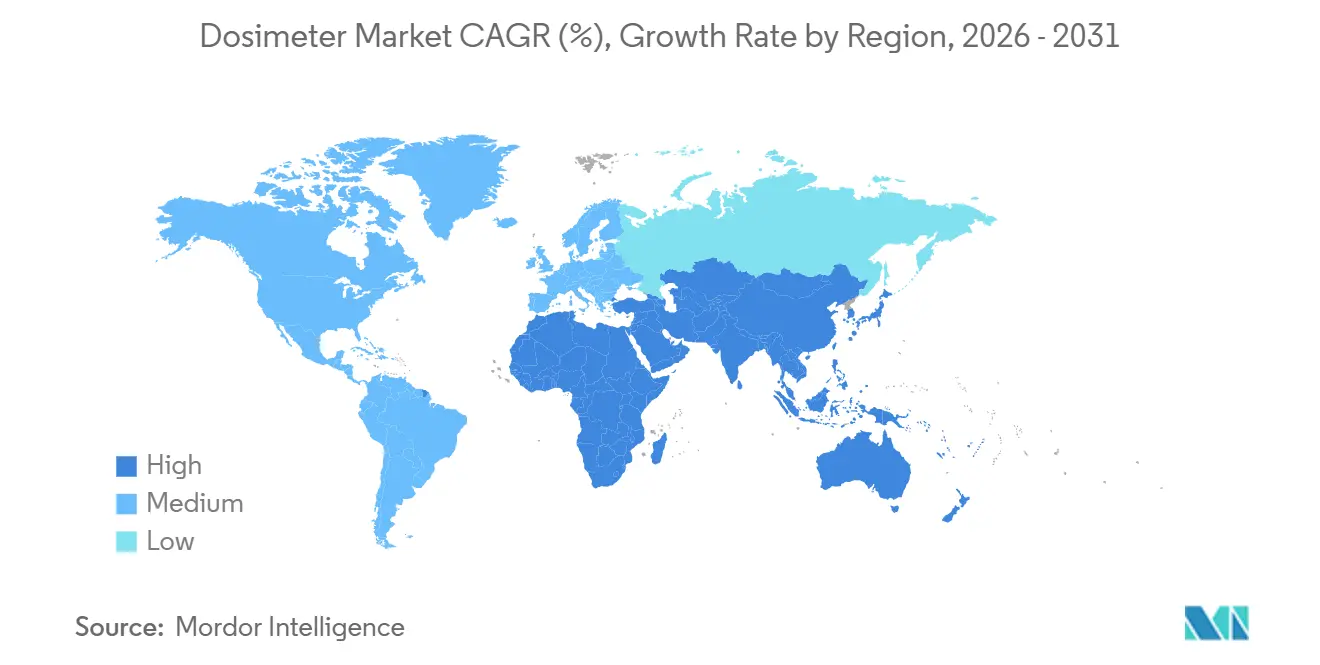
| Fastest Growing Market | Asia Pacific |
| Largest Market | Asia Pacific |
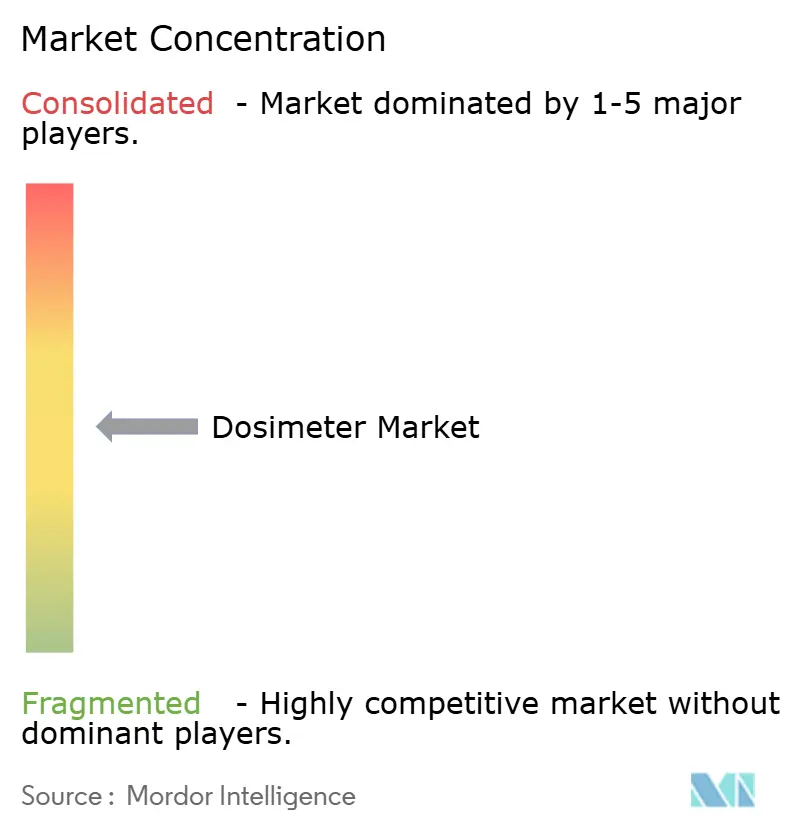
| Market Concentration | Medium |
Major Players *Disclaimer: Major Players sorted in no particular order Image © Mordor Intelligence. Reuse requires attribution under CC BY 4.0. | |
Dosimeter Market Analysis by Mordor Intelligence
The dosimeter market size was valued at USD 3.88 billion in 2025 and is estimated to grow from USD 4.21 billion in 2026 to reach USD 5.92 billion by 2031, at a 7.06% CAGR over 2026-2031. Regulatory tightening, expanding nuclear programs, and higher oncology imaging volumes are accelerating hardware replacement cycles. Hospitals are phasing out monthly badge exchanges in favor of real-time electronic personal dosimeters that alert wearers at 80% of threshold dose. Semiconductor detectors based on silicon-carbide substrates sustain accuracy in high-neutron fields, reducing recalibration costs for power-plant operators. Asia-Pacific leads installations because China and India alone plan 22 gigawatts of new capacity by 2030, while North American growth derives from life-extension projects rather than new builds. Moderate vendor concentration encourages niche specialists to offer rugged low-cost alternatives for emerging regions.
Key Report Takeaways
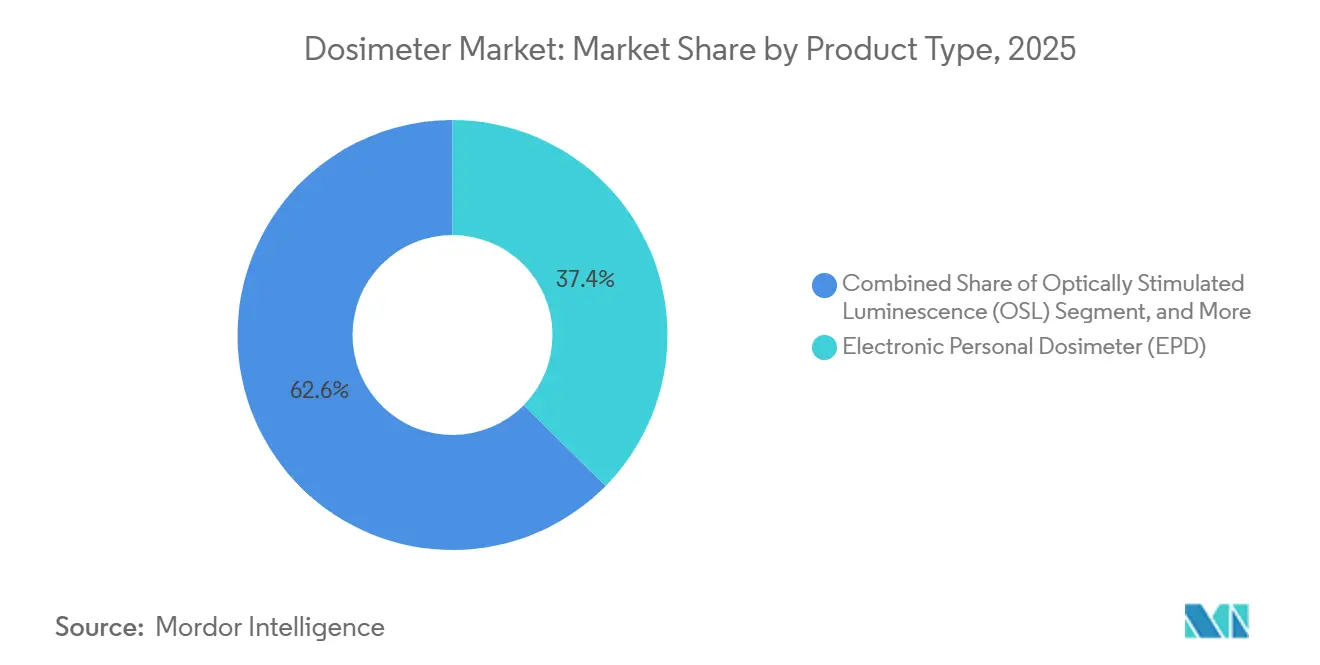
- By product type, electronic personal dosimeters held 37.38% revenue share in 2025, whereas optically stimulated luminescence is forecast to expand at a 7.11% CAGR through 2031.
- By application, active dosimetry accounted for 52.84% of the dosimeter market share in 2025 and is projected to advance at 7.41% CAGR to 2031.
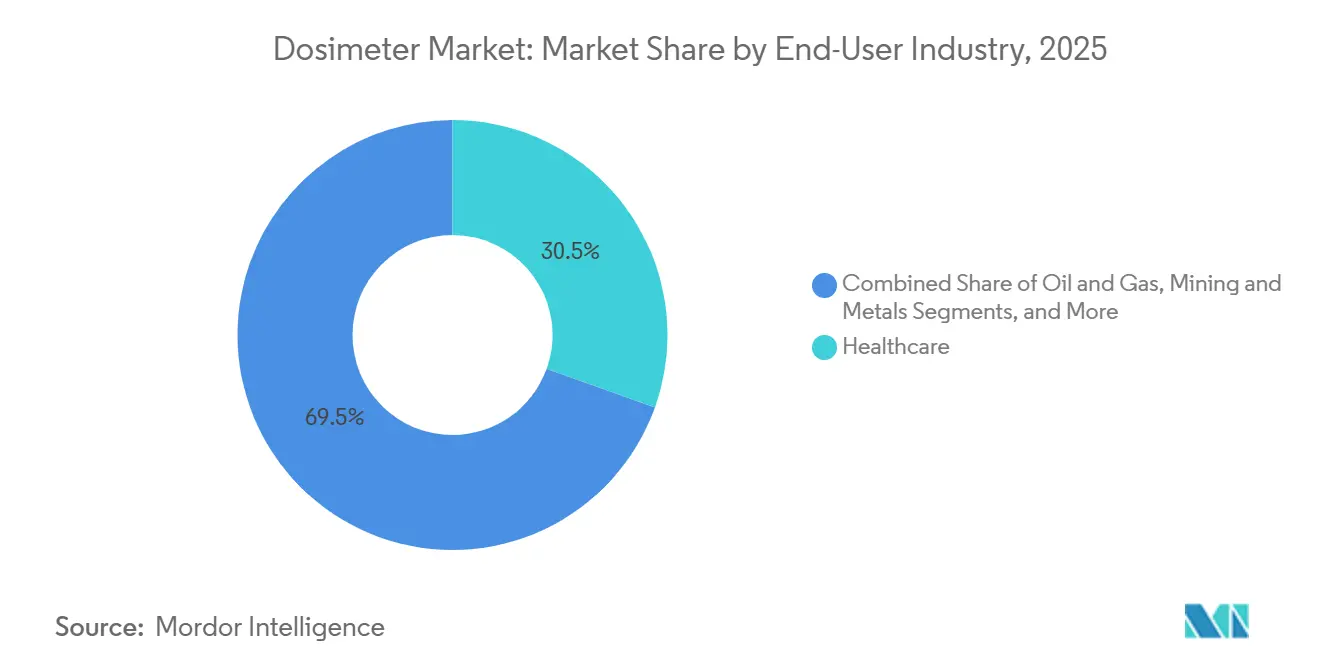
- By end-user, healthcare led with 30.48% of revenue in 2025, while defense and security are expected to grow the fastest at 7.34% CAGR during 2026-2031.
- By detection technology, semiconductor detectors commanded 33.91% of the dosimeter market size for components in 2025 and should climb at a 7.09% CAGR through 2031.
- By geography, Asia-Pacific generated 36.82% of 2025 revenue and is on track for a 7.82% CAGR to 2031, outpacing North America’s 6.4% and Europe’s 6.1%.
Note: Market size and forecast figures in this report are generated using Mordor Intelligence’s proprietary estimation framework, updated with the latest available data and insights as of 2026.
Global Dosimeter Market Trends and Insights
Drivers Impact Analysis*
| Driver | (~) % Impact on CAGR Forecast | Geographic Relevance | Impact Timeline |
|---|---|---|---|
| Heightened oncology imaging and radiotherapy volumes | +1.2% | Global, with concentration in North America, Europe, and Asia-Pacific urban centers | Medium term (2-4 years) |
| Expansion of nuclear-power capacity (SMRs and life-extension projects) | +1.5% | Asia-Pacific core, spill-over to Middle East and Eastern Europe | Long term (≥ 4 years) |
| Tightening eye-lens dose limits and real-time compliance audits | +1.0% | Global, driven by ICRP and national regulators (NRC, Euratom, AERB) | Short term (≤ 2 years) |
| Industrial radiography digitization (pipe-weld QC, 5G infra build-out) | +0.9% | North America and Asia-Pacific, with emerging uptake in Middle East oil and gas | Medium term (2-4 years) |
| AI-enabled dose-analytics platforms bundled with EPD hardware | +0.8% | North America and Europe early adopters, expanding to Asia-Pacific | Medium term (2-4 years) |
| Rising emerging-market biodosimetry labs for emergency surge response | +0.6% | Asia-Pacific, Middle East, and Africa, supported by WHO frameworks | Long term (≥ 4 years) |
| Source: Mordor Intelligence | |||


Heightened Oncology Imaging and Radiotherapy Volumes
Cancer diagnoses climbed 18% between 2024 and 2025, increasing interventional procedures that expose staff to scattered radiation.[1]World Health Organization, “Cancer Incidence and Mortality Statistics 2025,” WHO.INT Hospitals must now meet the International Commission on Radiological Protection eye-lens limit of 20 millisieverts averaged over five years, prompting quarterly badge exchanges and demand for electronic personal dosimeters. Real-time vibration alarms cut accidental overexposures, satisfying liability-insurer requirements for prospective monitoring. Interventional suites test software that correlates dose with procedure complexity so managers can balance staffing. This convergence of clinical demand and compliance pressure anchors sustained shipments across the dosimeter market.
Expansion of Nuclear-Power Capacity (SMRs and Life-Extension Projects)
The International Atomic Energy Agency expects 90-100 gigawatts of small modular reactor capacity online by 2030, centered in China, India, and the Middle East.[2]International Atomic Energy Agency, “Energy, Electricity and Nuclear Power Estimates to 2050,” IAEA.ORG Each module employs up to 200 workers during construction and 50 permanent operators, all subject to continuous dose monitoring. Concurrent 20-year life-extension programs at legacy reactors in France and the United States triple transient worker counts during outages, boosting badge demand. Fuel-cycle facilities are converting from film to OSL badges that tolerate higher gamma fields, underscoring a structural shift toward reusable media. Semiconductor detectors with silicon-carbide diodes withstand intense neutron fluxes, reducing replacement intervals and attracting utilities seeking lower lifetime cost.
Tightening Eye-Lens Dose Limits and Real-Time Compliance Audits
ICRP Publication 139, adopted by regulators in early 2024, reduced the annual eye-lens limit from 150 millisieverts to 20 millisieverts.[3]International Commission on Radiological Protection, “ICRP Publication 139: Occupational Radiological Protection in Interventional Procedures,” ICRP.ORG Standard whole-body badges underestimate lens exposure by nearly one-third in fluoroscopy environments, so operators must now wear dedicated Hp(3) dosimeters at collar height. Quarterly inspections in the United States and biannual audits in Europe impose fines up to USD 100,000 for non-compliance. Vendors are embedding Bluetooth Low Energy modules that push dose data to supervisory dashboards, transforming radiological protection from retrospective record-keeping to proactive risk avoidance. This regulation-driven migration favors the dosimeter market’s active segment during the forecast window.
Industrial Radiography Digitization
Pipeline integrity and 5G tower construction consumed 18,000 industrial gamma sources in 2025. Digital detector arrays reduce exposure time per weld, yet radiographers still accrue 15-20 millisieverts annually because projects compress inspection windows. Revised U.S. regulations effective July 2024 now require real-time alarming devices whenever crews lose visual line-of-sight, effectively prohibiting passive-only programs on remote corridors. Contractors therefore lease electronic personal dosimeters for short campaigns. Asia-Pacific demand mirrors North America as cell-tower expansions trigger thousands of weld inspections. These mandates enlarge the dosimeter market base outside traditional healthcare and nuclear sectors.
Restraints Impact Analysis*
| Restraint | (~) % Impact on CAGR Forecast | Geographic Relevance | Impact Timeline |
|---|---|---|---|
| Calibration-source shortages and isotope supply chain shocks | -0.7% | Global, acute in North America and Europe dependent on Canadian reactors | Short term (≤ 2 years) |
| Persistent accuracy gaps for low-energy neutron fields | -0.4% | Nuclear fuel-cycle facilities globally, research reactors in Asia-Pacific | Medium term (2-4 years) |
| Data-integration cybersecurity liabilities | -0.3% | North America and Europe under FDA and GDPR scrutiny | Short term (≤ 2 years) |
| End-user fatigue from badge-processing subscription costs | -0.5% | Healthcare and small industrial users globally | Medium term (2-4 years) |
| Source: Mordor Intelligence | |||
Calibration-Source Shortages and Isotope Supply Chain Shocks
Cesium-137 sources used for annual calibration face scarcity after Canada’s Chalk River reactor extended its shutdown through mid-2026. Laboratories report nine-month lead times, forcing accreditation bodies to permit 18-month intervals instead of 12. Molybdenum-99 shortages ripple into reference-field availability. Although the U.S. National Nuclear Security Administration funded domestic production, first deliveries will not arrive until late 2027. These gaps delay new-badge rollouts and inflate service costs, restraining near-term expansion of the dosimeter market.
Persistent Accuracy Gaps for Low-Energy Neutron Fields
Bubble detectors and superheated-drop systems under-respond by up to 35% in thermal-neutron environments typical of plutonium-handling glove boxes. Helium-3 proportional counters offer real-time correction, yet helium-3 supplies fell 40% between 2020 and 2024. Silicon-carbide diodes with lithium-6 coatings show laboratory promise, but regulators have not certified them for mixed fields, postponing large-scale procurement. Until validated alternatives reach the field, certain facilities defer equipment upgrades, modestly dampening the dosimeter market trajectory.
*Our forecasts treat driver/restraint impacts as directional, not additive. The impact forecasts reflect baseline growth, mix effects, and variable interactions.
Segment Analysis
By Product Type: OSL Systems Gain on Reusability Economics
Optically stimulated luminescence dosimeters are projected to grow 7.11% annually through 2031, outpacing the 6.8% average for other types. Healthcare and nuclear labs favor OSL because each badge can be reread multiple times without signal fade, lowering lifetime cost. The dosimeter market size for OSL is set to expand as film-badge users migrate under new eye-lens rules. Electronic personal dosimeters remain essential for high-exposure roles, though their USD 400-600 upfront cost deters low-volume contractors. Film badges now hold under 8% share, while direct ion-storage hybrids serve niche research sites that need immediate electronic reads plus OSL re-analysis.
Laboratories in tropical and desert regions still rely on thermoluminescent dosimeters because lithium-fluoride crystals tolerate extreme humidity. Landauer’s InLight platform captured 12% of North American passive revenue in 2025 by bundling cloud dashboards with OSL badges, a middle-ground alternative that boosts recurring service revenue. As users weigh total ownership costs, reusable OSL media combined with analytics software will keep winning contracts, elevating their contribution to the dosimeter market.


By Application: Active Dosimetry Pulls Ahead on Regulatory Momentum
Active dosimetry generated 52.84% of 2025 revenue and should advance at 7.41% CAGR through 2031. Real-time devices meet revised U.S. and European rules that require monitoring whenever workers could exceed 10% of dose limits. Passive badges remain for low-exposure staff, but growth lags at 6.5%. The crossover threshold sits near 8 millisieverts annually; above it, the risk of a single incident justifies active hardware. Hybrid policies now dominate: a worker wears an electronic personal dosimeter for alerts and a passive badge for archival records, satisfying both compliance and litigation defense.
Hospitals upgrading catheterization labs and utilities staffing outage crews exemplify early adopters, ordering electronic units that upload data via Bluetooth to cloud dashboards. Mirion reported that 38% of 2025 electronic sales went to hybrid programs, evidence that users consider the two approaches complementary. This blended strategy underpins sustained expansion of the dosimeter market size for active solutions while retaining baseline demand for passive media.
By End-User Industry: Defense and Security Accelerate on Biodosimetry Buildout
Healthcare produced 30.48% of 2025 revenue, anchored by oncology imaging and radiotherapy. Defense and security, however, will log the fastest 7.34% CAGR to 2031 as governments stockpile kits for emergency surge response. The dosimeter market size for defense orders swells when agencies require ruggedized units that meet MIL-STD-810 shock criteria and integrate on classified networks, fetching 40-50% price premiums.
Nuclear power and fuel-cycle operators remain the second-largest buyers thanks to SMR deployments in Asia-Pacific and life-extension outages in the West. Industrial NDT and manufacturing climb 7.1% annually as aerospace and automotive plants adopt X-ray computed tomography to inspect additive components. Mining and metals users continue adding badges for naturally occurring radioactive material, particularly at lithium extraction sites in Australia and South America. Each segment’s distinct environmental and data-security needs sustain diversified demand across the broader dosimeter market.
By Detection Technology: Semiconductor Detectors Leverage SiC Advances
Semiconductor detectors accounted for 33.91% revenue in 2025 and are forecast to grow at 7.09% CAGR through 2031. Silicon-carbide substrates endure neutron fluences above 10^14 n/cm² without drift, extending recalibration intervals from six to 18 months. Gas-filled Geiger-Müller tubes remain lowest cost but cannot discriminate gamma from beta radiation, limiting them to academic teaching labs. Scintillator-based systems claimed 28% share because rugged plastic detectors suit industrial field sites.
Solid-state passive media such as beryllium-oxide excel in mammography and dental imaging where scattered photons fall below 30 keV, enhancing low-energy sensitivity. Panasonic’s hybrid scintillator-semiconductor prototype displayed at the IEEE 2025 symposium suggests convergence toward multi-modal designs. As utilities and hospitals favor devices that capture both photon and neutron fields, semiconductor innovations will help vendors secure higher-margin contracts and lift the dosimeter market.
Geography Analysis
Asia-Pacific captured 36.82% of 2025 revenue and will grow at 7.82% CAGR through 2031. China’s ten new reactor approvals in 2025 require up to 10,000 badges per site during construction and 1,200 for steady operation. India’s Atomic Energy Regulatory Board doubled quarterly badge requirements, raising annual consumption per plant. Japan restarted seven reactors in 2025 under enhanced safety scrutiny, driving fresh electronic dosimeter orders. South Korea’s export of APR1400 reactors to Egypt and the United Arab Emirates includes bundled dosimetry contracts, extending Seoul-based vendors into the Middle East.
North America generated 28% of 2025 revenue and will advance 6.4% annually as life-extension projects dominate spending over new builds. The only greenfield units—small modular reactors in Wyoming and Idaho—will demand 3,000 additional badges by 2028. Hospitals in the United States accelerate upgrades following the eye-lens rule change, boosting electronic personal dosimeter shipments. Canada’s isotope shortages, however, temper short-term calibration services.
Europe accounted for 24% of 2025 revenue. France and the United Kingdom rely on life-extension upgrades that sustain steady but moderate badge replacement demand. Germany’s reactor phase-out curtails new orders, yet high utilization at research reactors preserves niche neutron-dosimetry sales. Eastern Europe benefits from defense contracts where vendors such as Polimaster supply rugged low-temperature devices for frontline operations.
The Middle East and Africa combined held 11% share. Biodosimetry labs funded under World Health Organization emergency-preparedness frameworks adopt OSL badges because they are inexpensive to read multiple times. Oil and gas pipeline inspections across the Arabian Peninsula also rent electronic personal dosimeters for radiography crews. Latin America remains nascent, with Brazil’s Angra-3 completion delay holding back substantial procurement until post-2027, yet mining projects in Chile and Argentina purchase badges for naturally occurring radioactive material exposure control. These regional nuances collectively reinforce a healthy demand curve for the dosimeter market.

Competitive Landscape
The dosimeter market exhibits moderate concentration. The top five vendors—Mirion Technologies, Landauer, Thermo Fisher Scientific, Fuji Electric, and Fortive—command roughly 55% of global revenue. Mirion’s 2024 acquisition of Sun Nuclear for USD 300 million added dose-verification software that locks customers into multi-year subscriptions. Landauer uses Berkshire Hathaway capital to offer hospitals discounted long-term passive-badge contracts. Thermo Fisher leverages its laboratory automation footprint to cross-sell dosimetry services.
Regional specialists thrive by tailoring devices to extreme climates and price points. Polimaster and ATOMTEX dominate Eastern Europe and Central Asia with units priced 30-40% below Western brands. Patent filings on wireless analytics and neutron-gamma discrimination rose sharply in 2025, signaling that intellectual property will shape future competitive advantages. Vendors embedding AI algorithms that forecast cumulative exposure based on procedure metadata can charge up to 25% premiums, although adoption remains confined to academic centers with data-science expertise. Rental models targeting short-duration industrial campaigns open new revenue streams, particularly in oil and gas pipeline radiography across Asia-Pacific and North America.
Dosimeter Industry Leaders
Mirion Technologies Inc.
LANDAUER (Berkshire Hathaway Energy)
Thermo Fisher Scientific Inc.
Fuji Electric Co., Ltd.
Fortive Corp. (Fluke Biomedical)
- *Disclaimer: Major Players sorted in no particular order

Recent Industry Developments
- November 2025: Polimaster secured a USD 12 million contract with Ukraine’s State Nuclear Regulatory Inspectorate to deploy 8,000 electronic personal dosimeters across the Chernobyl Exclusion Zone and operating plants.
- September 2025: Fortive’s Fluke Biomedical division obtained U.S. FDA 510(k) clearance for its RaySafe i3 real-time dosimeter that links with hospital imaging archives.
- July 2025: Fuji Electric partnered with Toshiba Energy Systems to supply 15,000 electronic units for Japan’s restarting reactors, integrating advanced neutron algorithms co-developed with Kyoto University.
- May 2025: Thermo Fisher Scientific expanded its United Kingdom laboratory by USD 85 million to add capacity for 2 million badge reads per year.


Global Dosimeter Market Report Scope
Dosimeters are calibration devices that track and gauge radiation exposure to high-energy X-rays, beta, and gamma rays. Electronic personal, thermoluminescent, optically stimulated luminescent, and film badge dosimeters are a few of the frequently used dosimeters. When the permitted limits are surpassed, they send a visual or audio alert while monitoring the radiation exposure. They are commonly worn by medical professionals and industrial employees who spend much time around radiation and dangerous chemicals.
The Personal Radiation Dosimeter Market Report is Segmented by Product Type (Electronic Personal Dosimeter, Thermoluminescent Dosimeter, Optically Stimulated Luminescence, Film Badge, Direct Ion Storage and DIS-OSL), Application (Active, Passive), End-User Industry (Healthcare, Nuclear Power and Fuel Cycle, Oil and Gas, Mining and Metals, Industrial NDT/Manufacturing, Defense and Security), Detection Technology (Semiconductor, Scintillator-based, Gas-filled GM/Proportional, Solid-State Passive, Bubble/Superheated-Drop), and Geography (North America, South America, Europe, Asia-Pacific, Middle East, Africa). The Market Forecasts are Provided in Terms of Value (USD).
| Electronic Personal Dosimeter (EPD) |
| Thermoluminescent Dosimeter (TLD) |
| Optically Stimulated Luminescence (OSL) |
| Film Badge |
| Direct Ion Storage and DIS-OSL |
| Active |
| Passive |
| Healthcare |
| Nuclear Power and Fuel Cycle |
| Oil and Gas |
| Mining and Metals |
| Industrial NDT / Manufacturing |
| Defence and Security |
| Semiconductor (Si, SiC, PIN) |
| Scintillator-based |
| Gas-filled GM / Proportional |
| Solid-State Passive (LiF, Al?O?, BeO) |
| Bubble / Superheated-Drop |
| North America | United States |
| Canada | |
| Mexico | |
| South America | Brazil |
| Argentina | |
| Rest of South America | |
| Europe | Germany |
| United Kingdom | |
| France | |
| Italy | |
| Spain | |
| Rest of Europe | |
| Asia-Pacific | China |
| Japan | |
| India | |
| South Korea | |
| South-East Asia | |
| Rest of Asia-Pacific | |
| Middle East | Saudi Arabia |
| United Arab Emirates | |
| Rest of Middle East | |
| Africa | South Africa |
| Egypt | |
| Rest of Africa |
| By Product Type | Electronic Personal Dosimeter (EPD) | |
| Thermoluminescent Dosimeter (TLD) | ||
| Optically Stimulated Luminescence (OSL) | ||
| Film Badge | ||
| Direct Ion Storage and DIS-OSL | ||
| By Application | Active | |
| Passive | ||
| By End-user Industry | Healthcare | |
| Nuclear Power and Fuel Cycle | ||
| Oil and Gas | ||
| Mining and Metals | ||
| Industrial NDT / Manufacturing | ||
| Defence and Security | ||
| By Detection Technology | Semiconductor (Si, SiC, PIN) | |
| Scintillator-based | ||
| Gas-filled GM / Proportional | ||
| Solid-State Passive (LiF, Al?O?, BeO) | ||
| Bubble / Superheated-Drop | ||
| By Geography | North America | United States |
| Canada | ||
| Mexico | ||
| South America | Brazil | |
| Argentina | ||
| Rest of South America | ||
| Europe | Germany | |
| United Kingdom | ||
| France | ||
| Italy | ||
| Spain | ||
| Rest of Europe | ||
| Asia-Pacific | China | |
| Japan | ||
| India | ||
| South Korea | ||
| South-East Asia | ||
| Rest of Asia-Pacific | ||
| Middle East | Saudi Arabia | |
| United Arab Emirates | ||
| Rest of Middle East | ||
| Africa | South Africa | |
| Egypt | ||
| Rest of Africa | ||


Key Questions Answered in the Report
How large will the dosimeter market be by 2031?
It is forecast to reach USD 5.92 billion by 2031, growing at a 7.06% CAGR over 2026-2031.
Which segment is expanding fastest within the dosimeter market?
Active dosimetry is projected to advance at 7.41% CAGR through 2031 due to real-time regulatory mandates.
Why is Asia-Pacific leading growth in radiation-dosimetry demand?
China and India are commissioning 22 gigawatts of new nuclear capacity, driving a 7.82% regional CAGR for badges and detectors.
What technology improvements are shaping next-generation dosimeters?
Silicon-carbide semiconductor detectors endure high neutron flux, and Bluetooth-enabled electronic personal dosimeters provide real-time compliance data.
How concentrated is vendor competition?
The top five manufacturers control about 55% of revenue, leaving moderate room for regional specialists.
Page last updated on:


