Directed Energy Weapons Market Size and Share
Market Overview
| Study Period | 2019 - 2031 |
|---|---|
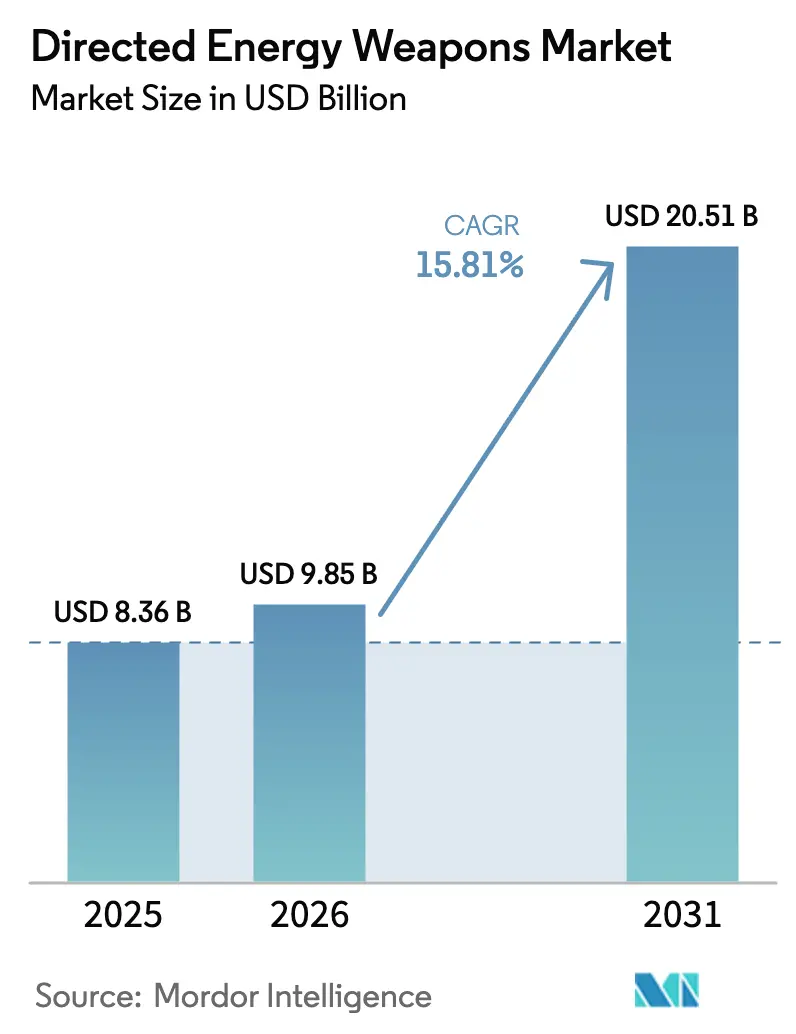
| Market Size (2026) | USD 9.85 Billion |
| Market Size (2031) | USD 20.51 Billion |
| Growth Rate (2026 - 2031) | 15.81% CAGR |
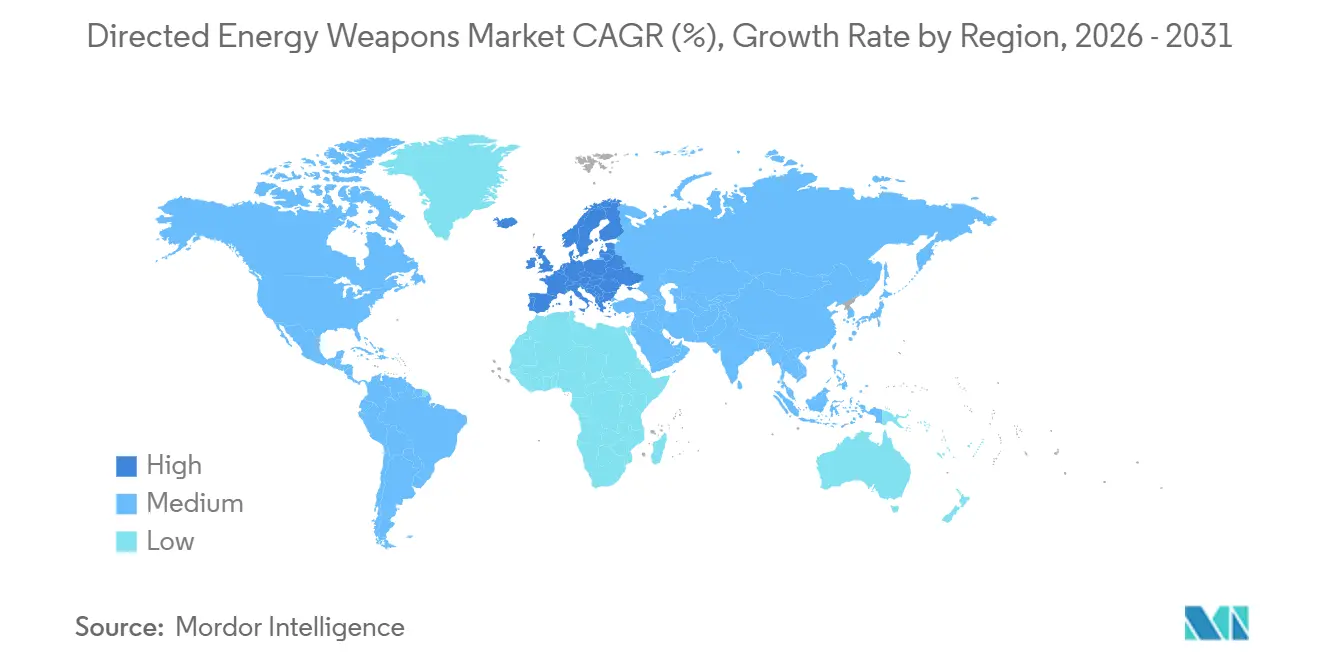
| Fastest Growing Market | Middle East |
| Largest Market | North America |
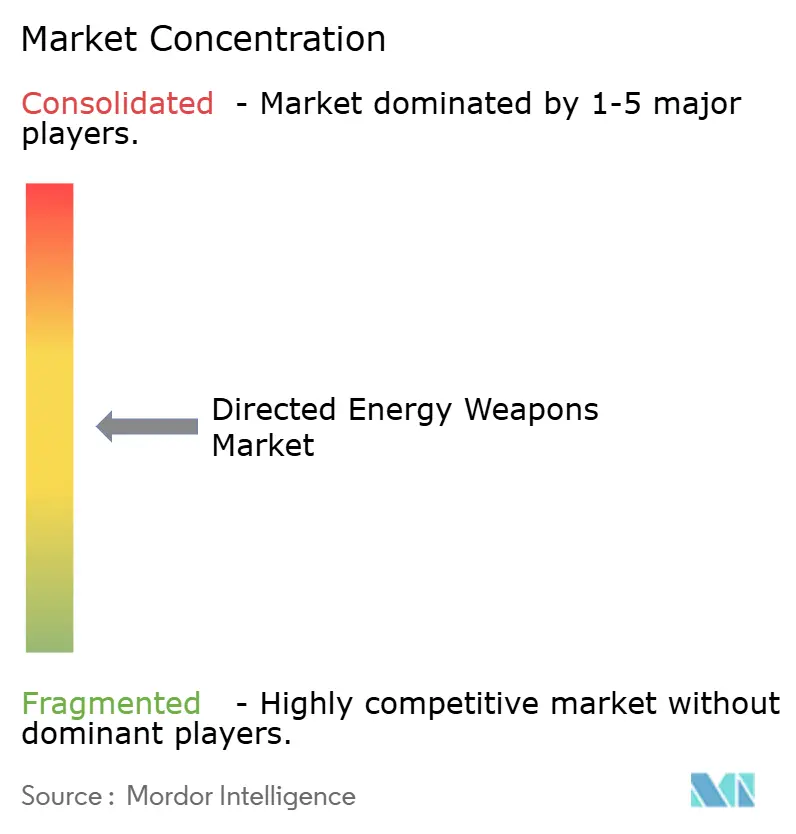
| Market Concentration | Medium |
Major Players *Disclaimer: Major Players sorted in no particular order Image © Mordor Intelligence. Reuse requires attribution under CC BY 4.0. | |
Directed Energy Weapons Market Analysis by Mordor Intelligence
The directed energy weapons market size is expected to grow from USD 8.36 billion in 2025 to USD 9.85 billion in 2026 and is forecasted to reach USD 20.51 billion by 2031 at a 15.81% CAGR over 2026-2031. Growth rests on the decisive cost-per-shot gap between laser or microwave beams and conventional interceptors, the need to counter drone swarms and hypersonic missiles, and the rapid maturation of gallium-nitride (GaN) power electronics that compress 150-kilowatt weapons into previously size-constrained platforms. Favorable defense budget trajectories in the US, Japan, and South Korea sustain large development lines, while successful naval trials on the USS Preble and HMS DragonFire validate operational readiness and trigger multi-year production contracts.[1]Source: Megan Eckstein, “US Navy HELIOS Laser Weapon Deployed on USS Preble,” navalnews.com Export interest accelerates in the Middle East as Israel’s 100-kilowatt Iron Beam nears deployment and the UAE seeks layered counter-UAS defenses. Supply-chain risks tied to China’s export licenses on gallium and germanium, however, create short-term price pressure, encouraging Western governments to localize refining capacity.
Key Report Takeaways
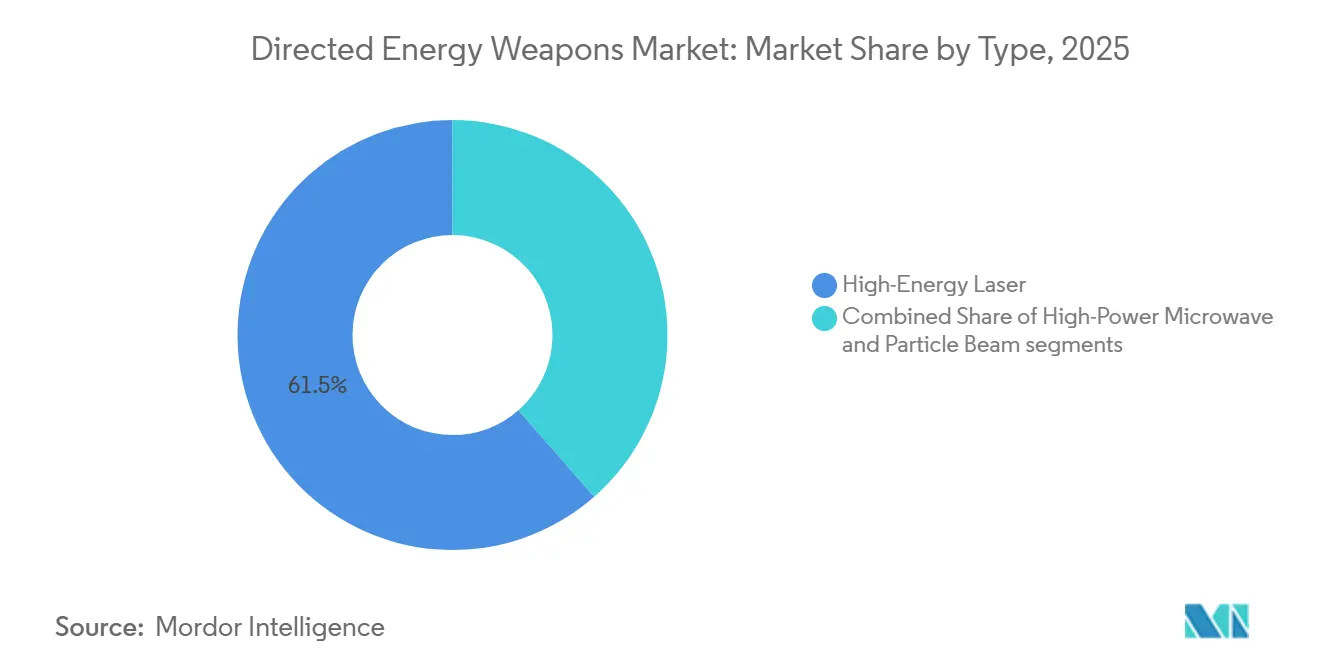
- By type, high-energy laser systems led with 61.45% revenue share in 2025; high-power microwave platforms are forecasted to grow at a 17.50% CAGR through 2031.
- By platform, land-based deployments held a 45.10% share in 2025, while space-based systems are projected to expand at an 18.55% CAGR to 2031.
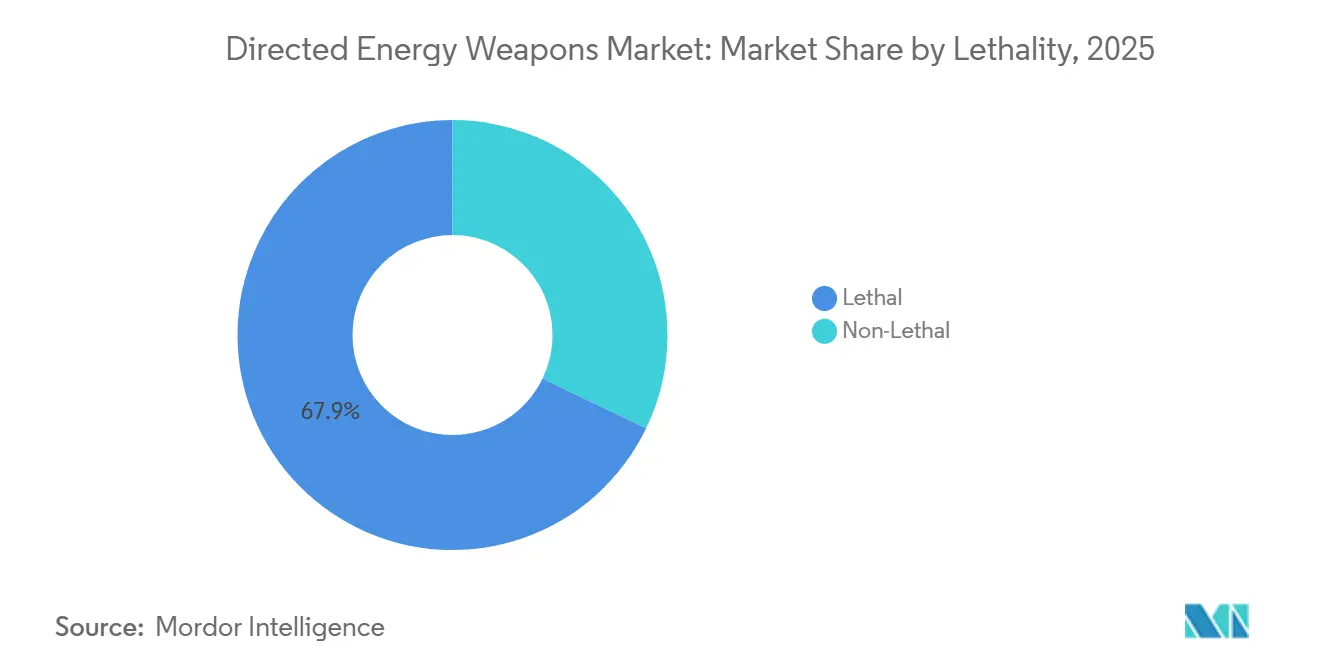
- By lethality, lethal applications accounted for 67.85% share of the directed energy weapons market size in 2025, and non-lethal missions are advancing at a 16.43% CAGR through 2031.
- By power class, 51-150 kW weapons commanded 49.20% of the directed energy weapons market share in 2025, whereas sub-50 kW systems are set to expand at a 16.71% CAGR to 2031.
- By end-user, armies captured 41.50% of the revenue in 2025, and air forces recorded the highest projected CAGR of 17.32% through 2031.
- By geography, North America dominated with a 45.60% share in 2025; the Middle East is expected to post the strongest CAGR of 17.65% between 2026 and 2031.
Note: Market size and forecast figures in this report are generated using Mordor Intelligence’s proprietary estimation framework, updated with the latest available data and insights as of January 2026.
Global Directed Energy Weapons Market Trends and Insights
Drivers Impact Analysis*
| Driver | (~) % Impact on CAGR Forecast | Geographic Relevance | Impact Timeline |
|---|---|---|---|
| Cost-per-shot advantage of HEL over interceptors | +3.2% | Global, early uptake in North America and Middle East | Medium term (2-4 years) |
| Counter-UAS and hypersonic threat proliferation | +2.8% | Indo-Pacific, Middle East | Short term (≤2 years) |
| Defense-budget growth and multi-domain modernization | +2.1% | North America, Europe, Asia-Pacific | Long term (≥4 years) |
| Jammer-immune beams suit contested electromagnetic warfare | +1.9% | Indo-Pacific, Eastern Europe, Middle East | Medium term (2-4 years) |
| GaN electronics enable compact 150-kilowatt weapons | +1.7% | North America, Europe, Asia-Pacific | Long term (≥4 years) |
| Successful naval tests accelerate laser procurement cycles | +1.5% | North America, Europe, Middle East | Medium term (2-4 years) |
| Source: Mordor Intelligence | |||
Cost-Per-Shot Advantage of HEL Over Interceptors
The UK’s DragonFire laser costs roughly GBP 10 (USD 13) per engagement compared with more than GBP 1 million (USD 1.35 billion) for a Sea Viper missile. This 100,000-fold delta transforms warship magazine depth and through-life sustainment costs. During the 2024 Red Sea patrols, the US Navy spent nearly USD 1 billion on munitions to counter low-cost drones, underscoring the unsustainable economics of a kinetic-only defense. Fleet architects now layer lasers with interceptors, reserving missiles for high-value incoming threats. GaN power modules shrink 150 kW designs into footprints compatible with existing destroyer power grids, accelerating retrofit decisions. As live-fire trials demonstrate repeatable lethality, acquisition authorities are moving high-energy lasers from experimentation into production contracts. Near-term adoption is sharpest in navies, while land and air platforms benefit as cost cases mature.
Counter-UAS and Hypersonic Threat Proliferation
Drone swarms overwhelm finite missile inventories, while hypersonic glide vehicles reduce reaction time and exploit unpredictable trajectories. The US Air Force’s THOR high-power microwave system neutralized multiple small UAS in Africa during 2024 operations, proving wide-area soft-kill scalability.[2]Source: Air Force Research Laboratory, “THOR High-Power Microwave Weapon Deployed,” afrl.af.mil Lockheed Martin and the Missile Defense Agency are co-developing laser interceptors for glide-phase defeat, reflecting rising urgency to counter boost-glide vehicles. China’s Silent Hunter and LW-30 programs openly field capabilities that are similar, narrowing first-mover advantages and accelerating global competition. Militaries are increasingly specifying multi-mission platforms that toggle between hard-kill and soft-kill effects without reloading, aligning with the evolving threat spectrums. As engagement envelopes diversify, directed energy becomes indispensable in layered air-defense doctrine.
Defense-Budget Growth and Multi-Domain Modernization
The US Department of Defense (DoD) allocated USD 789.7 million for directed energy in fiscal year 2025, incorporating these weapons into joint war-fighting concepts - Japan’s five-year defense plan funds truck-mounted lasers for drone defense, integrating them into shared command networks. South Korea fielded its 30 kW Block-I laser in 2024, linking to national air-and-missile defense sensors for cued shots. Budget expansion is necessary but not sufficient; procurement criteria emphasize interoperability, open architectures, and rapid update cycles that mesh with sensor-to-shooter loops measured in seconds. Directed energy is now shifting from a boutique technology to a core effector within multi-domain kill chains.
Jammer-Immune Beams Suit Contested Electromagnetic Warfare
Radio-frequency seekers and GPS-dependent interceptors falter under electronic attack; however, laser beams propagate at the speed of light and require no datalink. The US Army’s Indirect Fire Protection Capability-High Energy Laser program positions hard-kill lasers as a hedge against sophisticated jamming that blinds radar-guided missiles. Israel’s Iron Beam similarly operates independently of satellite navigation, maintaining lethality even when adversaries spoof the electromagnetic spectrum. Russia’s Krasukha-4 deployments in Ukraine illustrated how effectively RF kill chains can be disrupted, motivating NATO planners to diversify effectors. As spectrum denial becomes routine, unjammable energy beams deliver a decision advantage and continuity of defense. The capability also incentivizes combined-arms formations to integrate electro-optical tracking sensors with laser effectors.
Restraints Impact Analysis*
| Restraint | % Impact on CAGR | Geographic Relevance | Impact Timeline |
|---|---|---|---|
| Atmospheric attenuation and thermal blooming | -2.1% | Southeast Asia, Middle East, equatorial Africa | Long term (≥4 years) |
| Protracted acquisition milestones delay industrial revenues | -1.8% | North America and EU | Medium term (2-4 years) |
| Legal ambiguities constrain export and battlefield deployment | -1.2% | Global | Long term (≥4 years) |
| Rare-earth supply shocks escalate optical component costs | -1.5% | North America, Europe | Short term (≤2 years) |
| Source: Mordor Intelligence | |||
Atmospheric Attenuation and Thermal Blooming
Humidity, dust, and turbulence degrade laser beams, reducing power by up to 50% at 5 km in tropical littorals, according to 2024 trials conducted by the US Naval Research Laboratory.[3]Source: U.S. Naval Research Laboratory, “Laser Propagation Studies,” nrl.navy.mil Thermal blooming further degrades beam quality in hot, moist air, forcing designers to oversize lasers or accept shorter lethal ranges. Adaptive optics alleviates some distortion but adds cost and complexity. The vulnerability is acute in Southeast Asia and the Gulf regions, where most drone and rocket threats occur at lower altitudes. Consequently, commanders pair lasers with kinetic interceptors to maintain coverage when the weather degrades beam quality. Continuous improvement in beam-control software eases but does not eliminate the physics limits.
Protracted Acquisition Milestones Delay Industrial Revenues
A Government Accountability Office analysis shows that directed-energy programs typically average 8-12 years from demonstration to fielding, stretching supplier cash flow and deterring venture capital. The US Army’s Indirect Fire Protection Capability-High Energy Laser has yet to reach full operational capability despite a decade of trials, exemplifying bureaucratic inertia. In Europe, Rheinmetall’s high-energy laser waits on NATO certification before volume orders, an administrative hurdle that prolongs low-rate production. Without assured demand, prime contractors delay large-scale tooling, keeping unit prices high. Recent moves to establish a Directed Energy Joint Transition Office in the US may ease bottlenecks, but structural procurement reform remains essential.
*Our forecasts treat driver/restraint impacts as directional, not additive. The impact forecasts reflect baseline growth, mix effects, and variable interactions.
Segment Analysis
By Type: Solid-State Dominance Meets Microwave Disruption
High-energy laser systems captured 61.45% of the directed energy weapons market share in 2025, reflecting the maturity of fiber lasers, scalable power modules, and validated lethality against drones, rockets, and small craft. The directed energy weapons market is witnessing brisk adoption of solid-state architectures as integration tests transition into frontline deployments. Lockheed Martin’s 2024 ATHENA shot disabled a truck engine, translating laboratory precision into a tactically relevant effect. In contrast, high-power microwave (HPM) platforms are projected to grow at a 17.50% CAGR through 2031, driven by counter-electronics use cases in which single pulses can disable entire swarms without physical destruction. THOR’s Africa deployment demonstrated wide-area coverage that lasers cannot match, highlighting complementary mission profiles.
Regulatory clarity favors lasers for now; IEC 60825 classifies safety thresholds and outlines export licensing procedures, whereas a parallel standard for HPM remains absent, which delays international deals. As militaries refine doctrines, procurement divides along mission lines: lasers for precision hard-kill, microwaves for soft-kill saturation. Start-ups like Epirus exploit the gap with software-defined waveforms that reshape pulses in real time, positioning HPM as an agile alternative. Over the forecast horizon, both modalities expand, with lasers maintaining a revenue lead due to entrenched industrial supply chains and clearer certification pathways, thereby securing a long-term share in the directed energy weapons market.


By Platform: Land Maturity Versus Space Velocity
Land systems accounted for 45.10% of revenue in 2025, reflecting armies equipping Stryker and Boxer vehicles with 50-kW-class lasers for mobile short-range air defense. The directed energy weapons market size for land platforms will continue rising as low-power units proliferate across maneuver brigades and fixed bases, offering commanders magazine-depth independent of missile resupply. Naval adoption accelerates after the successes of the USS Preble and HMS DragonFire, which proved that ship electrical grids can sustain continuous beam fire without auxiliary generators. Airborne lasers are edging toward maturity; an AC-130J gunship equipped with the SHiELD pod successfully defeated threats in 2024 flight tests, inching self-protection capsules closer to operational service.
Space-based architectures, although still in their embryonic stage, boast an 18.55% CAGR outlook as DARPA’s Meadowlands links laser sensors to the Space Development Agency’s proliferated constellation, targeting global missile-tracking layers by 2027. Orbital systems bypass atmospheric attenuation, promising long-range precision, yet confront power generation limits and heat rejection in a vacuum. Northrop Grumman’s laser communications heritage supplies critical optics that shorten the technology bridge toward weaponization. The directional split crystallizes: terrestrial systems dominate near-term revenue while space concepts progress through prototyping, positioning the domain for disruptive share gains after 2030 in the directed energy weapons market.
By Lethality: Hard-Kill Primacy With Soft-Kill Upswing
Lethal applications commanded 67.85% of revenue in 2025 as commanders prioritized physically destroying targets to guarantee mission kill, evident in Israel’s Iron Beam detonating rocket warheads in 2025 trials. High-energy laser shots generate instant, catastrophic defeat without blast debris, a decisive advantage in urban or littoral environments where intercept residue poses collateral risks. Non-lethal missions, such as dazzling sensors and disrupting communications, are advancing at a 16.43% CAGR, aligning with stricter engagement rules that demand reversible or scalable effects. The US Navy’s Optical Dazzling Interdictor warns suspicious vessels without causing permanent damage, providing commanders with a proportional deterrent tool in congested sea lanes.
Legal ambiguities surrounding intentional blinding limit the exportability of systems, yet dual-mode systems that toggle between soft- and hard-kill continue to proliferate. Industrial design trends incorporate variable-power modes and rapid retargeting, allowing a single turret to transition from non-lethal to lethal capabilities within seconds. As urban operations and gray-zone encounters increase, the adoption of non-lethal methods expands. Still, lethal beams retain clear revenue supremacy in the directed energy weapons market due to doctrinal preference for definitive engagement outcomes.
By Power Class: Mid-Range Maturity, Low-Power Proliferation
Weapons in the 51-150 kW band captured 49.20% of the 2025 revenue, striking an optimal compromise between size, weight, and lethality. The directed energy weapons market size for this mid-range class benefits from the adoption of naval and land platforms; HELIOS, at 60 kW, and DragonFire, at roughly 100 kW, exemplify this sweet spot. Sub-50 kW systems, however, register the fastest 16.71% CAGR through 2031 as small-form-factor counter-UAS solutions spread across forward operating bases and mobile patrols. Hanwha’s 30 kW Block-I, fielded in 2024, integrates seamlessly with Patriot radars and costs a fraction of high-power laser systems, spurring export interest.
Above 150 kW, programs like Songbow pursue defeating anti-ship cruise missiles, yet they require bespoke cooling loops and integrated power systems that increase the risk of platform integration. Volume growth in lower power tiers underscores a broader defense trend toward distributed lethality, which involves saturating battlefields with numerous inexpensive nodes rather than concentrating capacity on a few exquisite assets. As GaN efficiency rises, tomorrow’s 100 kW weapon could occupy the footprint of today’s 30 kW unit, blurring class lines and reinforcing the directed energy weapons market’s tilt toward agile, scalable architectures.
By End-User: Army Incumbency, Air Force Momentum
Armies controlled 41.50% of the revenue in 2025, leveraging mobile lasers on Stryker and Boxer vehicles to defend maneuver brigades against drones and rockets. The Directed Energy Weapons industry leverages vehicle electrical upgrades and open-architecture fire-control systems to integrate lasers without requiring extensive hull redesign. Navy budgets focus on ship self-defense and interdiction missions, with follow-on HELIOS buys solidifying a surface-fleet roadmap. Civil agencies procure lower-power dazzlers for border and critical infrastructure protection, yet volumes lag behind military demand.
Air forces are expected to display the sharpest 17.32% CAGR to 2031 as pod-mounted lasers mature, providing defensive layers against infrared-guided missiles in contested airspace. The 2024 AC-130J trial validated airborne beam control, narrowing thermal management gaps and encouraging the development of fighter-class pods under the SHiELD portfolio. Cross-domain synergies emerge: technologies validated in truck turrets migrate to aircraft and ships, collapsing R&D duplication and accelerating convergence across services. The resulting ecosystem reinforces inter-service competition, with each service seeking niche superiority while sharing standard supply chains within the expanding directed energy weapons market.
Geography Analysis
North America retained 45.60% of the revenue in 2025, anchored by the US's USD 789.7 million federal directed-energy allocation and an industrial base comprising Lockheed Martin, RTX, Northrop Grumman, and General Atomics. USS Preble's HELIOS deployment and Army DE M-SHORAD low-rate production confirm operational transition, reducing the technology-to-fielding gap. Canada participates in joint trials, and Mexico studies non-lethal border applications, yet overall regional revenue remains US-centric. Regulatory reform through the Directed Energy Joint Transition Office, formed in 2024, aims to shorten acquisition cycles, further entrenching the region's lead.
Europe pursues autonomy through national efforts. The UK's GBP 316 million (USD 426.57 million) DragonFire production award secures frigate integration by 2027. Germany's Rheinmetall laser on Boxer vehicles proved NATO interoperability in 2025 trials, while France and Italy continue smaller prototype programs. Russia publicizes the Peresvet anti-satellite laser, but with minimal open data on field performance. Budget dispersion across disparate requirements tempers collective scale; however, European Union defense-industrial initiatives could consolidate demand post-2027, positioning Europe as a secondary growth pole inside the directed energy weapons market.
Asia-Pacific momentum builds on South Korea's 30 kW Block-I deployment and Japan's truck-mounted laser prototypes funded within the 2024-2029 buildup. China's Silent Hunter showcases export intent, while indigenous anti-satellite lasers remain broadly classified. Australia's joint US testing at Woomera and India's KALI project illustrate the region's diverse experimentation.
The Middle East and Africa are expected to register the highest CAGR of 17.65% from 2026 to 2031, driven by Israel's Iron Beam and the UAE's counter-drone procurements. Saudi Arabia evaluates directed-energy bids as part of its Vision 2030 modernization, and US THOR systems operate in Africa, providing proof of concept for broader adoption. South American uptake remains nascent, with Brazil and Argentina studying border security options but constrained by budget priorities.

Competitive Landscape
The market demonstrates moderate concentration around major primes, which dominate areas such as beam generation, power conditioning, and rugged integration. Lockheed Martin Corporation, RTX Corporation, and Northrop Grumman Corporation lead with the highest number of programs, supported by robust intellectual property portfolios in fiber-laser architectures and beam control algorithms. Lockheed Martin leverages decades of fiber-laser research and development to deploy systems such as HELIOS and ATHENA, incorporating adaptive optics patents filed in 2024 to address atmospheric distortion. RTX focuses on radar integration, offering HELWS as a comprehensive sensor-shooter solution that simplifies base-defense deployment. Northrop Grumman emphasizes space-based laser communications, aiming to leverage orbital platforms for future missile-defense applications.
Emerging players are gaining traction. Epirus, backed by venture funding, introduced its Leonidas software-defined microwave system in 2024, securing US testing extensions across multiple installations to enable swarm-defeat capabilities. BlueHalo secured the 400 kW Songbow contract valued at USD 29.98 million, driven by advancements in GaN power scaling and modular cooling technologies. Internationally, Rafael and Hanwha offer export-friendly systems with fewer ITAR restrictions, appealing to buyers in Asia and the Middle East.
Competitive dynamics are shifting from raw power metrics to factors such as integration speed, open architectures, and total ownership costs, reflecting customer demand for deployable systems within 24 to 36 months. The ongoing transition from R&D to serial production is expected to benefit second-tier players excelling in rapid prototyping and software updates, gradually reducing incumbents' market share while maintaining the overall structure of the directed energy weapons market under established primes.
Directed Energy Weapons Industry Leaders
Lockheed Martin Corporation
RTX Corporation
BAE Systems plc
Northrop Grumman Corporation
QinetiQ Group
- *Disclaimer: Major Players sorted in no particular order

Recent Industry Developments
- January 2026: QinetiQ secured a GBP 67 million (USD 89.84 million) contract to supply the UK Royal Navy with its first laser-directed energy weapons, marking a significant step in advancing naval defense capabilities. Strategically, this contract underscores the growing importance of directed energy systems in modern warfare, highlighting QinetiQ’s role in fostering innovation through laser-directed systems. The initiative supports domestic supply chains, involving over 100 UK suppliers, and strengthens the UK’s defense technology ecosystem.
- December 2025: QinetiQ received a GBP 160 million (USD 214.78 million) extension from the UK MoD. Rafael Advanced Defense Systems delivered the first operational Iron Beam laser system to the IDF, signifying a strategic enhancement in Israel’s defense capabilities. Integrated into the multi-layered defense framework alongside systems such as Iron Dome and David’s Sling, Iron Beam introduces a cost-efficient, precision-driven solution for countering aerial threats. Developed collaboratively by DDR&D, Rafael, and industry partners, this advancement underscores a growing emphasis on laser-based technologies in military applications, potentially reshaping global defense strategies and driving further innovation in cost-effective, high-precision interception systems.
- March 2025: HII’s awarded contract by the US Army’s Rapid Capabilities and Critical Technologies Office (RCCTO) to develop a High-Energy Laser (HEL) weapon system underscores the strategic shift toward modular, scalable defense technologies. This initiative supports the Army’s goals of cost-efficiency and operational adaptability, with potential industry-wide implications for advancing counter-UAS capabilities and enhancing supply chain resilience in defense systems.


Research Methodology Framework and Report Scope
Market Definitions and Key Coverage
Our study defines the directed energy weapons market as all field-deployable land, naval, airborne, and space platforms that create, control, and deliver high-energy laser, high-power microwave, or particle-beam effects for offensive or defensive missions; the valuation captures the integrated weapon module, thermal management, beam-director optics, and embedded fire-control software.
Scope Exclusions: Prototype test beds, standalone tactical power sources sold without a weapon module, and electro-optic sensors used only for targeting are not counted.
Segmentation Overview
- By Type
- High-Energy Laser
- High-Power Microwave
- Particle Beam
- By Platform
- Land
- Airborne
- Naval
- Space
- By Lethality
- Lethal
- Non-Lethal
- By Power Class
- Less than 50 kW
- 51 to 150 kW
- Greater than 150 kW
- By End-User
- Army
- Air Force
- Navy/Coast Guard
- Homeland Security and Others
- By Geography
- North America
- United States
- Canada
- Mexico
- Europe
- United Kingdom
- Germany
- France
- Italy
- Russia
- Rest of Europe
- Asia-Pacific
- China
- Japan
- India
- South Korea
- Australia
- Rest of Asia-Pacific
- South America
- Brazil
- Argentina
- Rest of South America
- Middle East and Africa
- Middle East
- Israel
- Turkey
- Saudi Arabia
- United Arab Emirates
- Rest of Middle East
- Africa
- South Africa
- Rest of Africa
- Middle East
- North America
Detailed Research Methodology and Data Validation
Primary Research
Mordor analysts interviewed defense acquisition officers in North America, Europe, and Asia-Pacific, integrators working on counter-UAS lasers, and beam-control component suppliers. The conversations validated cost-per-shot assumptions, power-class transition timelines, and regional demand triggers that secondary data left uncertain.
Desk Research
We began with open defense spending and procurement ledgers from bodies such as SIPRI, NATO, and the US Congressional Research Service, which helped anchor platform deliveries and budgeted line items. Trade data from UN Comtrade, customs filings on Volza, and patent grants tracked through Questel revealed regional production shifts and GaN power-electronics breakthroughs shaping cost curves. Company 10-Ks, acquisition disclosures gathered via Dow Jones Factiva, and program milestone press releases provided price and volume guidance. Government test reports, IEEE journals, and association papers (for example, the Directed Energy Professional Society) rounded out technology readiness insights. These sources are illustrative; many additional publications supported data checks and clarification.
Market-Sizing & Forecasting
Analysts opened with a defense-budget anchored top-down reconstruct: platform-level spending, average unit prices, and scheduled fielding numbers were aligned with historical contract awards, which are then corroborated with selective bottom-up rollups of producer revenues and sampled ASP x volume checks. Key variables include: a) funded kW-class upgrade roadmaps, b) counter-drone incident counts, c) shipboard electrical margin increases, d) average laser system learning-curve cost decline, and e) exchange-rate adjusted defense outlays. A multivariate regression links these drivers to annual adoption rates, while scenario analysis frames low-procurement or accelerated fielding cases. Gaps in supplier disclosures are bridged using peer benchmarks and moderated expert ranges before model lock.
Data Validation & Update Cycle
Outputs face variance screens against historical program spending, platform inventories, and operational test data; anomalies trigger a secondary analyst review and re-contact of select experts. Reports refresh every twelve months, with interim revisions when material events, such as major contract awards or funding reallocations, shift the baseline.
Why Mordor's Directed Energy Weapons Baseline Earns Trust
Published values diverge because firms pick different technology baskets, price bases, and refresh cadences.
According to Mordor Intelligence, disciplined scope selection and annually refreshed primary inputs keep figures aligned with real procurement flows.
Key gap drivers include: some estimates ignore high-power microwave systems; others bundle ancillary ship power upgrades; several apply constant ASPs despite rapid kW-scaling cost erosion; refresh cycles longer than two years miss mid-cycle budget uplifts.
Benchmark comparison
| Market Size | Anonymized source | Primary gap driver |
|---|---|---|
| USD 8.36 B (2025) | Mordor Intelligence | - |
| USD 7.9 B (2025) | Global Consultancy A | Excludes high-power microwave programs and counts only firm-fixed contracts |
| USD 12.35 B (2025) | Trade Journal B | Adds homeland-security laser dazzlers and portable power units to core scope |
| USD 2.62 B (2024) | Regional Consultancy C | Uses smaller tech basket and relies on awarded, not obligated, spending |
In sum, the Mordor approach combines transparent scope boundaries, live defense-budget tracking, and dual-path validation, giving decision-makers a balanced baseline that is traceable, current, and straightforward to replicate.


Key Questions Answered in the Report
How large is the directed energy weapons market in 2026?
The directed energy weapons market size stands at USD 9.85 billion in 2026.
What annual growth rate is predicted for directed-energy systems through 2031?
Aggregate revenue is projected to rise at a 15.81% CAGR through 2031.
Which technology currently leads revenue, lasers or microwaves?
High-energy laser platforms lead with 61.45% share in 2025, although High-Power Microwaves grow faster at a 17.50% CAGR.
Which platform segment is expanding fastest?
Space-based systems post the highest 18.55% CAGR as Meadowlands and allied constellations progress toward orbital prototypes.
Why are GaN electronics important for future weapons?
GaN semiconductors shrink power supplies and cooling, enabling 150 kW-plus lasers on vehicles and ships without radical redesign.
What restrains wider adoption despite proven lethality?
Atmospheric attenuation, lengthy acquisition milestones, legal export ambiguity, and rare-earth supply shocks all trim growth potential.
Page last updated on:


