
Market Overview
| Study Period | 2020 - 2031 |
|---|---|
| Forecast Data Period | 2026 - 2031 |
| Base Year Market Size (2025) | USD 1.87 Billion |
| Market Size (2026) | USD 2.06 Billion |
| Market Size (2031) | USD 3.37 Billion |
| Growth Rate (2026 - 2031) | 10.32 % |
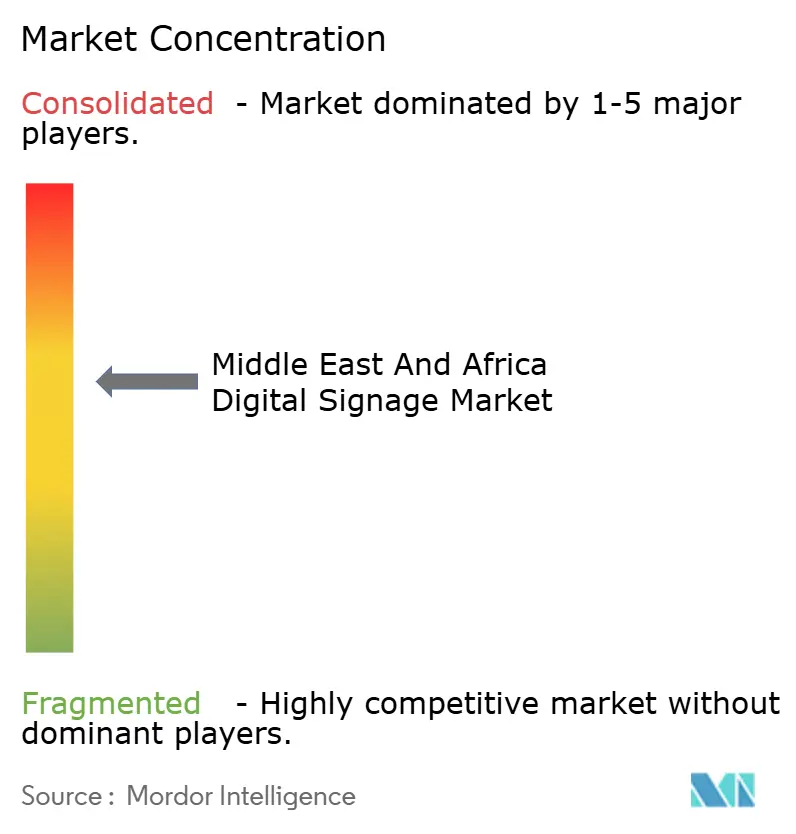
| Market Concentration | Medium |
Major Players *Disclaimer: Major Players sorted in no particular order Image © Mordor Intelligence. Reuse requires attribution under CC BY 4.0. | |
Middle East And Africa Digital Signage Market Analysis by Mordor Intelligence
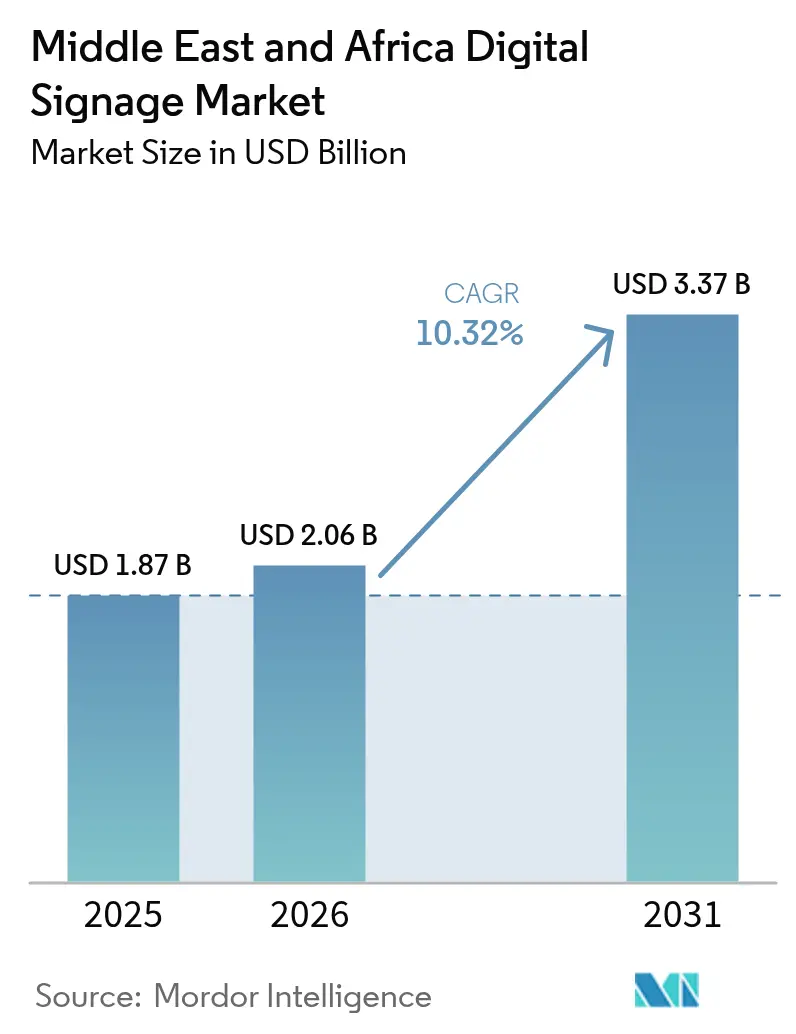
The Middle East and Africa digital signage market size is expected to grow from USD 1.87 billion in 2025 to USD 2.06 billion in 2026 and is forecast to reach USD 3.37 billion by 2031 at 10.32% CAGR over 2026-2031. Government smart-city programs, pilgrimage-driven seasonal spikes, and accelerating retail digitization reinforce the growth momentum that places the region among the fastest-expanding digital signage arenas worldwide. Religious tourism in Saudi Arabia, combined with large-format display rollouts in malls across the Gulf Cooperation Council, generates buying cycles that differ markedly from Western demand patterns. Sovereign technology initiatives embed displays into traffic control, healthcare, and public-safety systems, while local integrators gain traction with Arabic content localization and extreme-weather hardware adaptations. Hardware prices for mid-sized LED panels fell 15% in 2024, easing entry barriers for African retailers and public agencies. Meanwhile, software-as-a-service models shift the customer focus from capital expenditure to predictable operating expenses, thereby raising adoption among smaller venue operators.
Key Report Takeaways
- By product, billboards led with a 36.02% share of the Middle East and Africa digital signage market in 2025, while kiosks recorded the fastest growth at a 12.48% CAGR through 2031.
- By type, hardware commanded 66.12% of the Middle East and Africa digital signage market size in 2025, whereas services are expected to advance at an 11.35% CAGR through 2031.
- By application, commercial deployments accounted for 47.55% of the Middle East and Africa digital signage market revenue in 2025, while infrastructure projects are expected to accelerate at a 12.68% CAGR through 2031.
- By display technology, LED retained a 48.45% share of the Middle East and Africa digital signage market in 2025, and OLED grew at a 12.34% CAGR through 2031.
- By region, the Middle East captured 63.72% of the value of the Middle East and Africa digital signage market in 2025, whereas Africa is projected to post the strongest CAGR of 11.69% from 2025 to 2031.
Note: Market size and forecast figures in this report are generated using Mordor Intelligence’s proprietary estimation framework, updated with the latest available data and insights as of 2026.
Middle East And Africa Digital Signage Market Trends and Insights
Drivers Impact Analysis*
| Driver | (~) % Impact on CAGR Forecast | Geographic Relevance | Impact Timeline |
|---|---|---|---|
| Rapid retail roll-out of large-format LED and OLED screens | +2.1% | Middle East core, spill-over to North Africa | Medium term (2-4 years) |
| Government smart-city digital infrastructure programs | +2.8% | GCC countries, Egypt, South Africa | Long term (≥ 4 years) |
| Falling display pixel-USD cost | +1.9% | Global | Short term (≤ 2 years) |
| Brand owners' shift to data-rich DOOH campaigns | +1.6% | Urban centers across MEA | Medium term (2-4 years) |
| Pilgrimage-driven demand spikes in Mecca and Medina | +1.4% | Saudi Arabia, regional spillover | Long term (≥ 4 years) |
| AI-enabled Arabic audience analytics platforms | +1.2% | Arabic-speaking regions | Medium term (2-4 years) |
| Source: Mordor Intelligence | |||
Rapid Retail Roll-out of Large-Format LED and OLED Screens
Retail chains across the Gulf continuously replace static posters with high-brightness LED walls that withstand daytime temperatures of up to 50 °C without color washout. Subway introduced self-order kiosks and an anamorphic screen at Dubai Mall, trimming queue time by 40% and cutting yearly menu-reprint costs by USD 100–200 per outlet.[1]Digital Signage Today Staff, “Subway Launches First Self-Order Kiosks and Anamorphic Screen in EMEA at Dubai Mall,” digitalsignagetoday.com Mid-sized panel prices fell 15% in 2024, making large-format displays more affordable for specialty stores that had previously shied away from capital-intensive upgrades. GCC developers plan to create 3.9 million m² of new retail space by 2028, generating persistent demand for content-ready screens optimized for Arabic and English messaging. African supermarkets further the trend by adopting energy-efficient LED menu boards that slice power bills by 20% and recoup investments in under three years.
Government Smart-City Digital Infrastructure Programs
Saudi Arabia, the UAE, and Qatar designate digital signage as core city infrastructure connecting traffic alerts, emergency broadcasts, and tourism information. The Kingdom budgets USD 1.18 trillion for integrated transport and hospitality corridors that embed outdoor-rated displays into roadsides, metro stations, and pilgrimage routes.[2]Government Communications Office, “Digital Transformation Strategy,” gov.qa Egypt’s National Strategy for Smart Cities installs unified content networks in new administrative capitals, while South Africa pilots display-equipped bus shelters to streamline commuter updates. Kenya’s Konza Technopolis hosts a local assembly of commercial panels, reducing logistics costs and customs delays, and providing African buyers with faster service turnarounds. Emerging standards for brightness, cybersecurity, and Arabic typography flow from these state programs and now shape vendor product roadmaps.
Pilgrimage-Driven Demand Spikes in Mecca and Medina
Annual pilgrim inflows exceeding 10 million elevate temporary screen demand in the holy cities, where multilingual way-finding and crowd-control graphics must survive dust storms and 24-hour operation. Operators deploy modular LED to handle year-round advertising and pivot to safety messaging during Hajj peaks, capturing incremental rentals that push utilization rates above 80%. Hardware fleets are engineered with redundant power supplies and sealed enclosures that resist sand infiltration, a specification later exported to wide-open highways in Egypt and Oman. Local integrators specialize in rendering Quran verses and right-to-left animation flows, giving them an edge over global firms that are less attuned to liturgical nuances.
AI-Enabled Arabic Audience Analytics Platforms
Fanar AI, Microsoft’s JAIS LLM, and Sodaclick deliver real-time gender, age, and mood detection in Modern Standard Arabic and dialects, raising ad engagement by double-digit percentages. Retailers trigger dynamic promotions when family groups approach, while transit authorities automatically switch to evacuation directions if crowd density exceeds safety thresholds. AI localization engines cut manual translation lead times from days to minutes, improving campaign agility during Ramadan or National Day events. Privacy-compliant edge processing keeps sensitive facial data onsite, aligning with Gulf cybersecurity mandates. Subscription-based analytics lift the services segment’s CAGR by turning one-off deployments into recurring insight contracts.
Restraints Impact Analysis*
| Restraint | (~) % Impact on CAGR Forecast | Geographic Relevance | Impact Timeline |
|---|---|---|---|
| High initial capex and TCO for outdoor networks | -1.8% | Africa core, smaller Middle East markets | Short term (≤ 2 years) |
| Fragmented regional standards and content rules | -1.3% | Cross-border deployments, multi-country operators | Medium term (2-4 years) |
| Cyber-security and vandalism risks for public screens | -1.1% | Urban centers, high-traffic areas | Long term (≥ 4 years) |
| Extreme heat and dust driving maintenance costs | -0.9% | Desert regions, outdoor installations | Long term (≥ 4 years) |
| Source: Mordor Intelligence | |||
High Initial Capex, Weather Exposure, and Ownership Costs
Outdoor-rated units cost 40–60% more than indoor equivalents because they integrate sealed aluminum housings, high-lumen LED, and reinforced anti-vandal glass. African buyers face additional hurdles due to patchy grid power and limited broadband coverage, which increases the costs of generators and cellular modems. Samsung’s CVE-2024-7399 advisory highlights new cyber-patch workloads that extend the payback cycles for budget-strapped municipalities.[3]Samsung Security Center, “CVE-2024-7399 Digital Display Vulnerability Advisory,” security.samsung.com In desert belts, fan filters clog within months, forcing quarterly service visits that elevate maintenance contracts by 25%. Managed service leasing models spread the burden, but cannot offset the steep upfront installation permits and import duties on hardware in Nigeria or Tanzania.
Fragmented Standards, Content Regulation, and Security Vulnerabilities
Operators spanning GCC, North Africa, and sub-Saharan Africa juggle conflicting rules on brightness caps, prayer-time advertising, and Arabic calligraphy sizing. Some jurisdictions require prior clearance from a censorship board, while others enforce data-sovereignty laws that prohibit cloud storage across borders. HKCERT’s 2024 study uncovered 20 unpatched web portals on public-facing display controllers, underscoring the need for region-specific security credentials. Divergent electromagnetic compliance codes force manufacturers to keep multiple SKU variants, hindering economies of scale. Marketing agencies must budget 15–20% extra for voice-over and dialect revision cycles, which can slow down multi-country campaign launches and dampen the network effect that drives programmatic DOOH adoption.
*Our forecasts treat driver/restraint impacts as directional, not additive. The impact forecasts reflect baseline growth, mix effects, and variable interactions.
Segment Analysis
By Product: Interactive Kiosks Drive Next-Generation Engagement
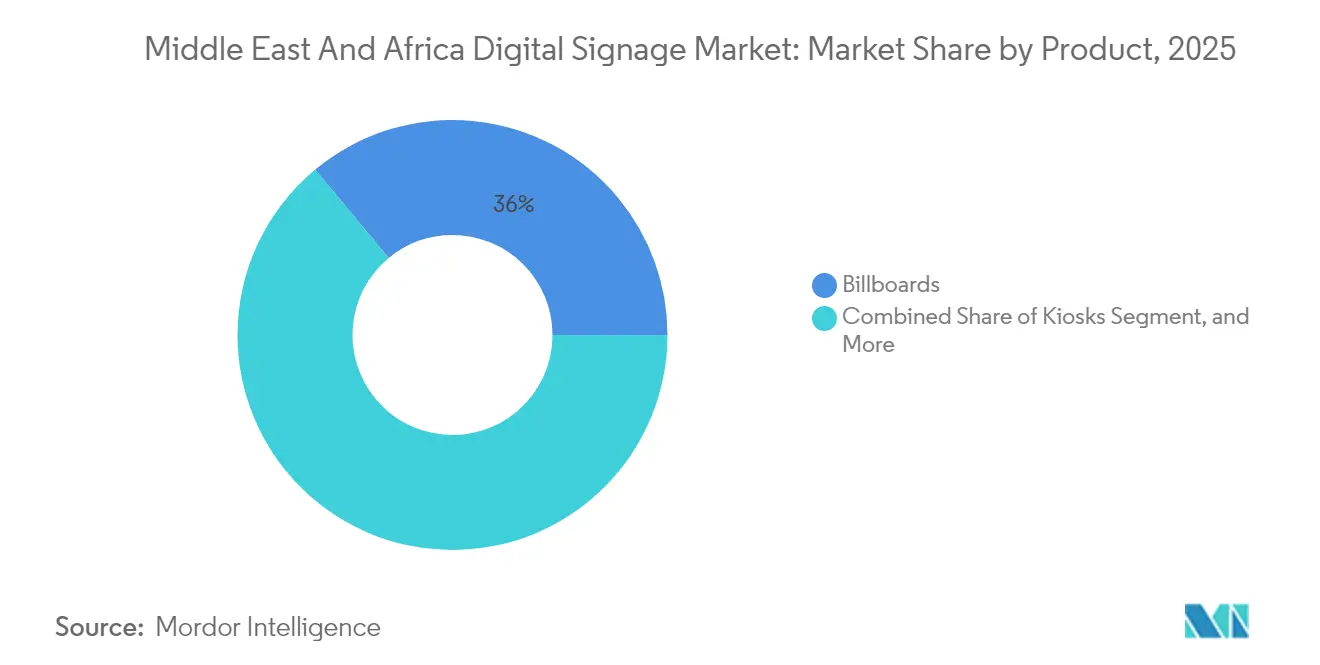
Billboards accounted for 36.02% of the Middle East and Africa digital signage market value in 2025, reflecting the entrenched demand for outdoor media along GCC expressways and North African city arteries. Kiosks, however, are projected to post a 12.48% CAGR through 2031 as retailers and transport hubs pivot to touchless self-service, which cuts staffing costs and delivers bilingual guidance. The Middle East and Africa digital signage market size associated with kiosk deployments is projected to increase steadily as sensor prices decline. Momentum is particularly strong in Saudi malls where AI engines upsell pilgrimage merchandise, lifting basket sizes by 15%.
Adopters favor antimicrobial glass and gesture control to address hygiene concerns that have been amplified during the pandemic years. Software overlays integrate loyalty programs and digital wallets, boosting repeat visits. Smaller African airports are introducing multilingual way-finding kiosks that eliminate the need for printed signage refreshes and streamline passenger flow. Local content studios gain business by crafting culturally sensitive avatars that greet users in Arabic, Swahili, or Amharic, a nuance that global template vendors often overlook.



By Type: Services Segment Accelerates Amid Platform Shift
Hardware delivered 66.12% of the revenue in 2025, yet its growth pace lags behind service subscriptions, which expand at an annual rate of 11.35%. Regional buyers are increasingly leasing screens that come bundled with managed content, predictive maintenance, and AI analytics. The Middle East and Africa digital signage market benefits from this shift as smaller retailers defer hefty upfront investment. Samsung’s SmartThings Pro plugs display into wider IoT stacks, allowing energy savings of 15% through remote dimming.
Media players adopt system-on-chip designs that reduce installation labor and minimize failure points. Meanwhile, software vendors preload Arabic fonts and right-to-left UX libraries, slashing localization overhead. African resellers package data SIMs, solar-ready power kits, and vandal-proof housings under monthly fees that align with tight municipal budgets. These offerings expand the addressable opportunities beyond premium malls to secondary cities and rural bus stations, broadening the footprint of the Middle East and Africa digital signage market.
By Application: Infrastructure Investments Fuel Growth Beyond Commercial Dominance
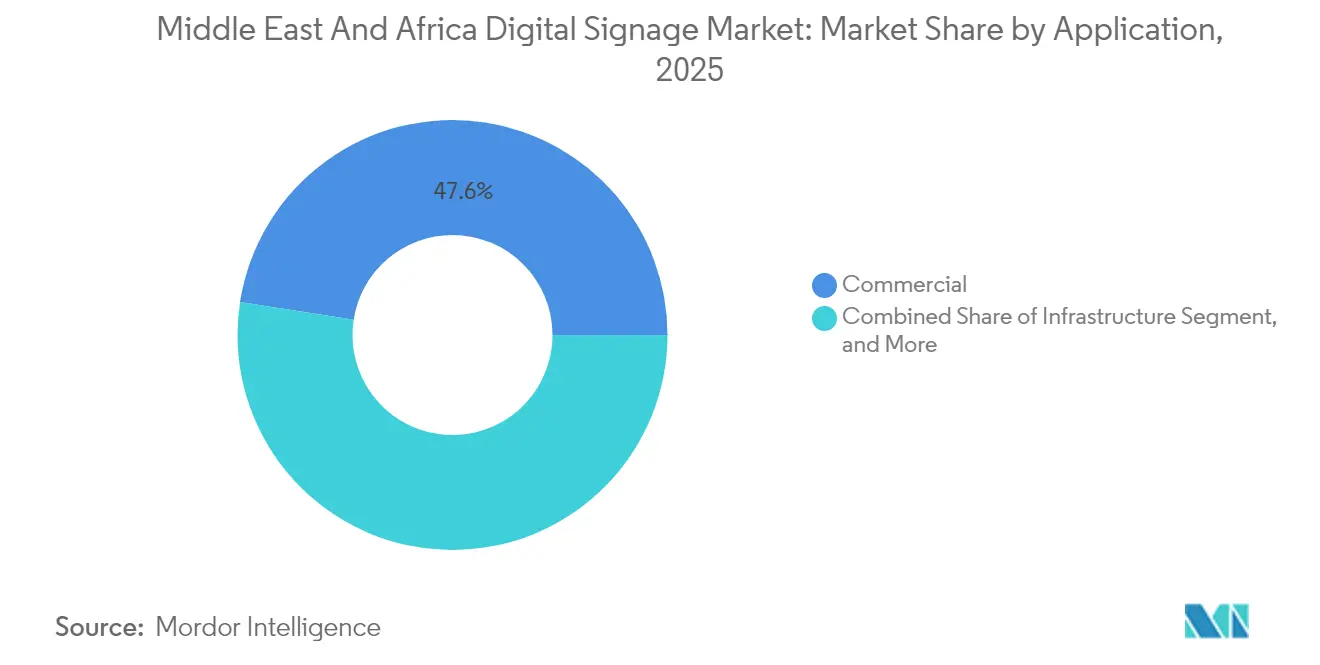
Commercial venues still contributed 47.55% of the turnover in 2025, as quick-service restaurants, fashion chains, and corporate lobbies modernized their visual communication. Infrastructure deployments, however, book the highest 12.68% CAGR because ministries view displays as mission-critical for transport updates, safety alerts, and e-government outreach. The Middle East and Africa digital signage market size tied to infrastructure roll-outs is projected to widen sharply as metro expansions in Riyadh, Doha, and Cairo demand ruggedized, sunlight-readable panels.
Industrial complexes install digital scoreboards and machine-status dashboards to prevent downtime and enhance worker safety. Hospitals deploy patient-queuing screens that reduce perceived wait times by 30%, while universities stream lecture schedules and emergency notices campus-wide. Content management suites incorporate ISO-based uptime metrics to satisfy public-sector procurement clauses, steering private developers toward enterprise-grade platforms.
By Display Technology: OLED Emergence Challenges LED Dominance
LED retained a 48.45% revenue share in 2025, favored for its 6,000-nit brightness and modular maintenance that suits desert climates. The Middle East and Africa digital signage market is driving the adoption of LED walls for outdoor arenas, road furniture, and sponsorship arches at pilgrimage checkpoints. OLED accelerates at 12.34% CAGR as luxury boutiques and corporate atriums crave near-black contrast and wafer-thin curvature.
Samsung’s Color Paper e-ink launch targets shelf-edge and way-finding settings where glare-free readability takes precedence over motion video. LCD remains a budget staple for indoor corporate communications, while mini-LED bridges cost and performance gaps, gaining uptake in African casinos and sports bars. Screen makers develop heat-dissipation chambers and UV-resistant coatings that extend the mean-time-between-failure beyond 60,000 hours, ensuring operators of lower lifetime costs despite higher sticker prices.
Geography Analysis
Saudi Arabia, the UAE, and Qatar collectively anchor the Middle East and Africa digital signage market with mature 5G backbones and proactive policy incentives. Riyadh’s Vision 2030 utilizes display networks in road tunnels, airport aprons, and Hajj transport nodes, where multilingual guidance reduces congestion and enhances pilgrim safety. Dubai’s USD 435 million domestic display spend thrives on data-rich DOOH inventory that provides real-time audience metrics to brand owners. Abu Dhabi aligns civic way-finding kiosks with a single CMS, which reduces content-update labor by 40%. Qatar’s Vision 2030 extends similar omnichannel frameworks across Education City, Lusail Stadium precincts, and metro interchanges, embedding procurement rules that favor energy-efficient, Arabic-first UI designs. Africa’s acceleration originates in Kenya’s Konza Technopolis, where 17 Korean companies assembled a USD 1.4 million electronics cluster, localizing digital signage hardware and creating 200 skilled jobs. The plant trims shipment time for large-format modules from 12 to 3 weeks, an advantage embraced by Nairobi retailers seeking rapid refresh cycles. South Africa leverages established fiber corridors to roll out 4K LED displays along Gautrain stations, monetizing commuter eyeballs with programmatic feeds synchronized to smartphone push notifications. Egypt’s smart-city roadmap incorporates solar-powered road signs that automatically switch to emergency broadcasts during sandstorm alerts, demonstrating public-safety integration beyond mere advertising. Nigeria’s population-dense Lagos and Abuja corridors attract foreign out-of-home investors despite power grid constraints, signaling a long-term upside for the Middle East and Africa digital signage market once infrastructure bottlenecks ease.
Regional gaps persist. Morocco, Oman, and Tanzania still rely on import-only supply chains, which can elevate landed costs by up to 25%. In response, assemblers in Dubai’s Jebel Ali Free Zone and Egypt’s Port Said offer bonded-warehouse kitting that circumvents multi-country tax layers. Pan-African regulatory bodies explore common standards for brightness, encryption, and emergency override to smooth cross-border transactions, a reform that could shave deployment lead times by two months and fuel the next chapter of the Middle East and Africa digital signage market expansion.
Regulatory Landscape
Regulation in the Middle East and Africa digital signage market is tightening around four recurring compliance themes: energy efficiency, electrical safety, content controls, and data privacy for connected and biometric-enabled endpoints. In Saudi Arabia, SASO conformity pathways and the energy-efficiency technical regulation for electronic displays (05-03-16-156) shape hardware go-to-market. A March 17, 2026 WTO-notified update to Annex 1 introduces a draft energy performance, testing, and labeling standard aligned to EU 2019/2021.
Across the GCC, the Gulf Standardization Organization implementation of GSO IEC 62368-1 Amendment 3 (effective July 10, 2026) adds a requirement for facial-recognition kiosks to ship with certified local privacy sandbox firmware. This pushes OEMs and integrators to redesign edge data flows and audit logging. At the application layer, the UAE codified media activity and advertising compliance through Federal Decree-Law No. (55) of 2023 and Cabinet Resolution No. (68) of 2024, including permit and content-standard obligations administered by the UAE Media Council for commercial messaging on digital media. Safety mandates also increasingly intersect with signage networks in high-traffic venues: Dubai Law No. (2) of 2026 on Public Safety (effective June 1, 2026) requires compliant signage and evacuation systems under Dubai Municipality oversight, reinforcing demand for certified, always-on display infrastructure and centrally managed emergency override capabilities.
Value Chain Analysis
The value chain in the Middle East and Africa digital signage market begins with global component sourcing (panels, controllers, SoCs, sensors, and enclosures), then moves through OEM display manufacturing, regional distribution, local system integration, and long-tail services such as content production, CMS subscriptions, field maintenance, and network monetization. The region remains import-heavy for core display technology, with Gulf logistics hubs operating as staging points for re-export and kitting. In select African nodes, local assembly initiatives shorten lead times for commercial panels and spare parts. On the demand side, buyers include retail and hospitality chains, transport authorities, municipalities, and ministries, each with procurement requirements around uptime SLAs, localization (Arabic-first UX and right-to-left layouts), and outdoor hardening for heat, dust, and vandalism.
Channel power is increasingly concentrated in large integrators and telecom-affiliated ICT arms that can bundle connectivity, cloud and edge hosting, cybersecurity, and managed services alongside screens. Navori Labs partnering with Solutions by stc (February 2026) is one example, as it targets government services and critical-infrastructure deployments with software, hosting, and security assurance purchased together with hardware. Public-private partnership models also influence downstream monetization and operations for digital out-of-home networks, reflected in municipal and destination-led rollouts in Oman, Sharjah, and Abu Dhabi. Major installations (for example, INFiLED and Ventum Tech completing a 1,219 sqm outdoor LED DOOH network at the Marriott Marquis City Center in Doha in May 2026) draw on specialized fabricators, content workflows, and multi-year maintenance contracts.
Competitive Landscape
Samsung, LG, and Sony together anchor technology leadership, contributing more than 45% of regional panel shipments in 2024. Samsung leverages its SmartThings Pro suite to bundle screens with IoT dashboards, drawing hospitality and healthcare clients that value ecosystem integration. The firm’s TV Plus expansion into Egypt and the UAE widens its content footprint, allowing advertisers to blend broadcast and place-based feeds within a single buying plan. LG targets KRW 10 trillion B2B revenue by 2030, emphasizing OLED poster walls and transparent displays that appeal to luxury malls and airport lounges.[4]LG Electronics, “LG Showcases B2B Solutions at Middle East and Africa Showcase 2024,” lgnewsroom.com Sony concentrates on high-brightness Crystal LED for flagship auditoriums but partners with local integrators for Arabic menu software, sidestepping cultural adaptation pitfalls.
Below the top tier, PPDS, Sharp NEC, and Hikvision compete for niche categories, ranging from DVLED tunnels to surveillance-linked passenger information screens. PPDS unveiled its modular Wave cloud CMS via Dubai partner events, courting resellers that crave fleet-wide remote management without deep coding skills. Sharp NEC pairs entrance-flow sensors with displays to hand retailers heat-map data, once limited to e-commerce. Hikvision cross-sells signage as part of security contracts, bundling vandal-proof housings and cybersecurity hardening into turnkey quotes.
Local specialists such as Red Solutions (Saudi Arabia), Almoe (UAE), and Iconic Media (South Africa) thrive on Arabic localization, dust-proof enclosure retrofits, and 24/7 on-site maintenance SLAs. Their intimate knowledge of prayer-time advertising restrictions and municipality permit workflows shortens rollout cycles by up to 30% compared with global rivals. Content studios like Rawa.ai pivot toward generative Arabic copywriting and dialect testing, forging SaaS alliances that boost margins and lock in customers. The competitive field thus combines the scale advantages of multinationals with the cultural agility of regional players, sustaining a dynamic yet moderately concentrated Middle East and Africa digital signage market.
Middle East And Africa Digital Signage Industry Leaders
Samsung Electronics Co., Ltd.
LG Electronics Inc.
Sharp NEC Display Solutions, Ltd.
Sony Group Corporation
Koninklijke Philips N.V. (Philips Professional Displays)
- *Disclaimer: Major Players sorted in no particular order

Market Opportunities and Future Outlook
Smart-city and transport information networks create whitespace beyond traditional retail and roadside advertising by positioning displays as public-service endpoints with emergency override, wayfinding, and real-time service messaging. One anchor for this shift is evidence that Citix MENA and Shurooq commenced interactive smart city digital board deployments across Sharjah destinations (January 2026), alongside a parallel pilot of smartboards on Yas Island, Abu Dhabi (January 2026). In public transport, RAK Transport Authority activated solar-powered real-time passenger information displays (April 2026), pointing to procurement pathways that connect signage to mobility KPIs while accounting for renewable-power constraints, a fit for parts of Africa where grid stability and operating costs weigh heavily.
Another opportunity is the move from one-off hardware sales to standardized, software-defined fleets that can be remotely managed, audited, and updated to satisfy privacy and content requirements. GCC-wide safety and privacy requirements for public-facing and biometric-enabled kiosks elevate the value of edge processing, local hosting options, and managed patching for controllers and CMS, which increases the role of services in total contract value. On the commercial media side, new DOOH inventory concessions and destination networks continue to expand coverage, including the June 2026 concession for 21 digital unipoles along Sheikh Zayed Road in Dubai. Solar-powered billboards commissioned in Katsina, Nigeria (May 2026) also illustrate a power-aware architecture relevant to secondary cities and corridor routes. Together, these deployments support a broader pipeline for rugged outdoor displays, CMS with multilingual templates, and operational tooling for uptime and proof-of-play, especially where operators need to monetize impressions while meeting municipal permit and safety obligations.
Recent Industry Developments
- June 2026: LG Electronics introduced the 2026 LG MAGNIT commercial Micro LED display (LMPB) for control room environments, positioning it for 24/7 network operations and security use cases in the Middle East and Africa. The update expands premium DVLED adoption beyond flagship retail into mission-critical infrastructure, where uptime, redundancy, and calibration services support higher lifecycle value.
- July 2025: Sharp Middle East and Africa expanded its PN-ME2 4K professional display lineup by adding 75-inch, 86-inch, and 98-inch sizes. Larger standardized SKUs help integrators spec consistent fleets across retail, corporate, and public venues, simplifying procurement and spares while supporting a shift toward large-format, high-brightness deployments.
- September 2024: Samsung Electronics issued CVE-2024-7399 guidance for its digital display products, increasing attention on patching and controller hardening for connected signage networks. The advisory elevates cybersecurity as a procurement requirement for public-sector and high-traffic deployments, lifting demand for managed services and secure-by-design media players and CMS configurations.


Research Methodology Framework and Report Scope
Market Definition and Coverage
For this study, the market is the value of digital signage deployed across the Middle East and Africa, covering the screens and supporting platforms that deliver scheduled, centrally managed visual messaging in public and private venues.
Scope exclusions: We do not count traditional static signage, consumer TVs used without a signage platform, or one-off event rentals that are not part of ongoing digital signage deployment.
Segmentation Overview
- By Product
- Kiosks
- Menu Boards
- Billboards
- Sign Boards
- Other Products
- By Type
- Hardware
- Displays (LCD/LED, OLED)
- Projection Equipment
- Media Players
- Other Hardware
- Software
- Services
- Hardware
- By Application
- Commercial
- Industrial
- Institutional
- Infrastructure
- Other Applications
- By Display Technology
- LCD
- LED
- OLED
- e-Paper
- By Region
- Middle East
- Saudi Arabia
- United Arab Emirates
- Qatar
- Kuwait
- Rest of Middle East
- Africa
- South Africa
- Egypt
- Nigeria
- Rest of Africa
- Middle East
Data Sources, Market Sizing, and Validation
Desk Research
Desk work started by mapping what drives installations and replacements in the region, and then linking those signals to spend on displays, media players, software, and services. We leaned on public sources such as national statistics offices in the GCC and South Africa, customs and trade statistics for electronics imports, and telecom regulator releases that indicate network readiness for connected displays.
To keep assumptions realistic, we also reviewed materials such as listed-company annual reports and investor presentations, regional retail and mall association updates, airport and transit authority project announcements, and peer-reviewed papers that discuss display lifecycles and energy performance. Where available, paid subscriptions for company financials and intelligence, plus an import-export shipment-level database, helped validate player scale and cross-check trade flows. These sources are illustrative only, and we used other public documents for clarification and consistency checks.
Primary Interviews and Surveys
Primary inputs were used to pressure-test how projects are budgeted and delivered across retail, transportation hubs, corporate campuses, and public sector buildings. We spoke with manufacturers, system integrators, software providers, and large buyers across the Middle East and Africa, so we could reconcile pricing assumptions, replacement cycles, and rollout pacing with country-specific delivery conditions.
Distribution of primary research fieldwork respondents
| Company type | Respondent position |
|---|---|
| Top tier: 28% | CXOs: 18% |
| Mid tier: 52% | Functional/Unit leaders: 26% |
| Smaller Players: 20% | Managers: 56% |
Market-Sizing & Forecasting
Sizing was built using a top-down approach where electronics import trends, commercial construction activity, and venue expansion signals were used to reconstruct the regional demand pool before it was split into spend on hardware, software, and services. To keep totals grounded, the outputs were then checked with selective bottom-up approximations, including sampled project bill-of-materials, typical screen counts by venue type, and channel checks on average selling prices.
In practice, a few inputs carried most of the model weight, including the pace of new mall and mixed-use development, airport and metro modernization programs, the share of deployments shifting toward LED formats, replacement cycles by screen type, and software subscription attachment rates in managed networks. When country data was thin, gaps were handled through proxy indicators, such as trade data and comparable venue density, then adjusted after interview feedback. For forecasting, we ran scenario analysis around capex cycles and public project timing, and the final path was aligned to what respondents described as the most likely rollout cadence over the next few years.
Data Validation & Update Cycle
Validation was done through multiple checks, starting with internal consistency tests across volumes, prices, and implied installed base growth, followed by comparisons to independent signals such as import values and large-project award activity. Where outliers appeared, assumptions were revisited, and follow-up outreach was triggered to confirm whether the variance came from currency timing, deal structure, or unusual project mix.
Before sign-off, the model is reviewed in steps so key assumptions, conversions, and country rollups are re-checked by another analyst. Reports refresh annually, and interim updates are made when material events change spending plans or supply conditions. Right before delivery, we run a final pass to ensure the latest public information is reflected in the numbers.
Mordor Intelligence's Middle East and Africa Digital Signage Market Market Estimate Compared With Other Published Estimates
It is normal to see different market size numbers for Middle East and Africa digital signage because sources do not always count the same things, and they also pick different base years and currency timings. Differences also show up when one model leans more on reported revenues, while another leans more on installation activity and replacement demand.
By tracking import and deployment indicators and then refreshing country-level pricing and replacement-cycle assumptions with interviews, Mordor Intelligence keeps the 2025 value tied to what is being installed and serviced across the region, rather than mixing in adjacent advertising-only spends or narrower device-only scopes.
Benchmark comparison
| Source | Market Size | Gaps in Research Methodology |
|---|---|---|
| Mordor Intelligence | USD 1.87 B (2025) | |
| Industry Databook A | USD 1.61 B (2025) | This estimate often leans on a narrower revenue capture that can undercount services and software attached to installations, and it may apply a more uniform pricing curve across MEA markets. |
| Regional Publisher B | USD 1.10 B (2024) | The figure is anchored to an earlier year and a different segmentation boundary, and the treatment of indoor versus outdoor and component bundling can reduce the counted value versus an all-in deployment view. |
The spread mainly comes from base-year choice and what gets counted around software and services versus devices alone. When the market value is anchored to observable demand signals and then cross-checked with practical pricing and lifecycle inputs, the result is easier to trace, review, and update in a repeatable way.


Key Questions Answered in the Report
How large is the Middle East and Africa digital signage market in 2026?
The Middle East and Africa digital signage market size is USD 2.06 billion in 2026, on track for USD 3.37 billion by 2031.
Which product category is growing fastest in the region?
Interactive kiosks lead growth with a projected 12.48% CAGR through 2031 as retailers and transport hubs adopt touchless self-service.
Why are smart-city projects important to digital signage adoption?
Government smart-city programs embed displays into traffic, safety, and citizen-service systems, adding 2.8% to the forecast CAGR.
What share do LED screens hold today?
LED accounts for 48.45% of revenue in 2025 owing to brightness and durability advantages in extreme heat.
Which geography is expanding quickest?
Africa is the fastest-growing territory, advancing at an 11.69% CAGR as telecom and power upgrades unlock new deployments.
How are vendors addressing Arabic content requirements?
Suppliers integrate AI-based Arabic NLP and dialect localization tools that generate culturally accurate messaging and boost engagement.
Page last updated on:





