Density Meter Market Size and Share
Market Overview
| Study Period | 2020 - 2031 |
|---|---|
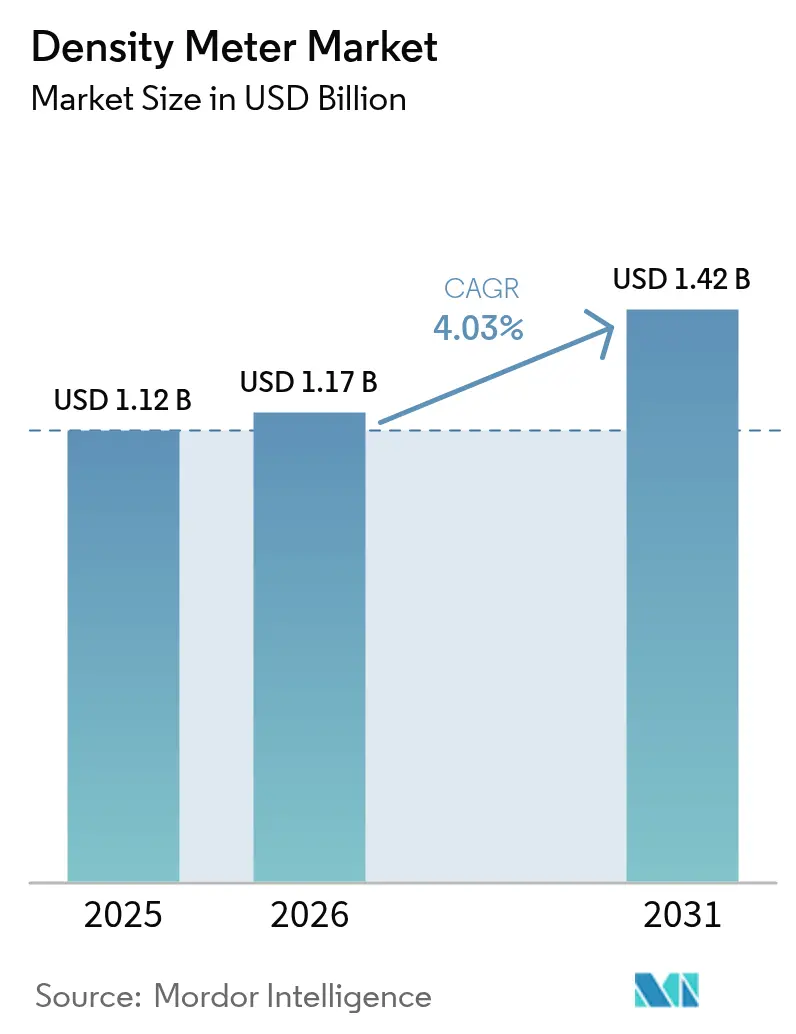
| Market Size (2026) | USD 1.17 Billion |
| Market Size (2031) | USD 1.42 Billion |
| Growth Rate (2026 - 2031) | 4.03% CAGR |
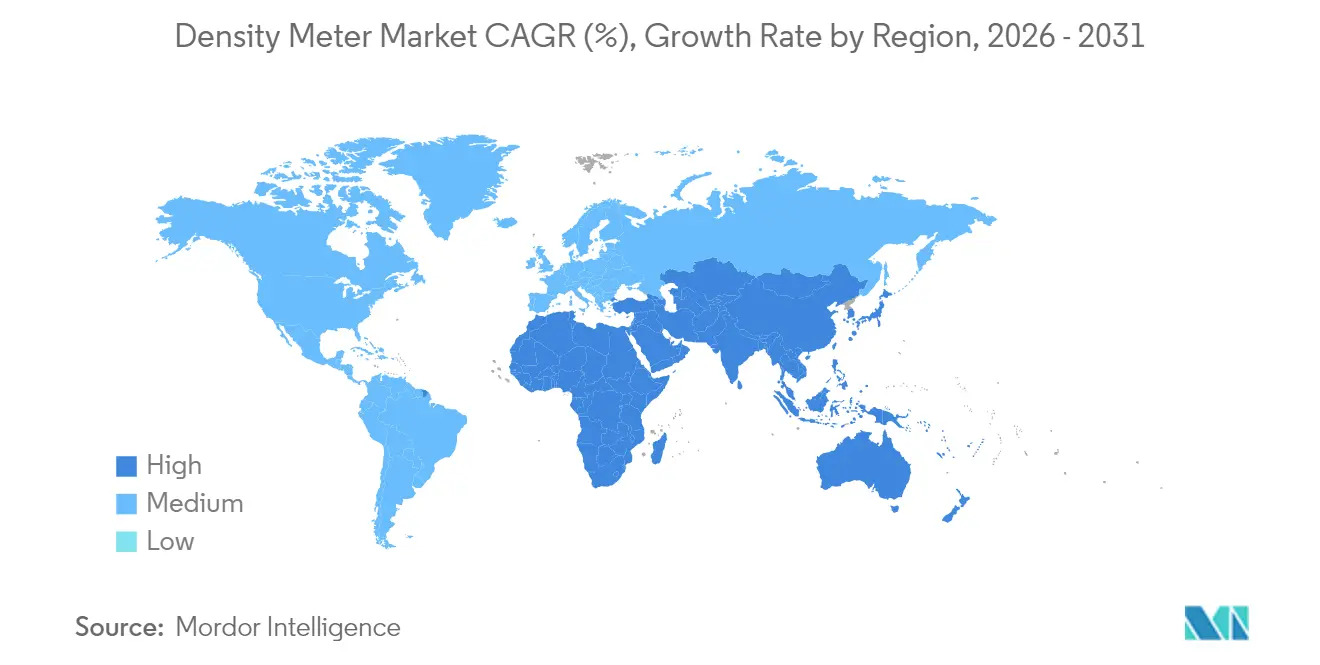
| Fastest Growing Market | Asia Pacific |
| Largest Market | Asia Pacific |
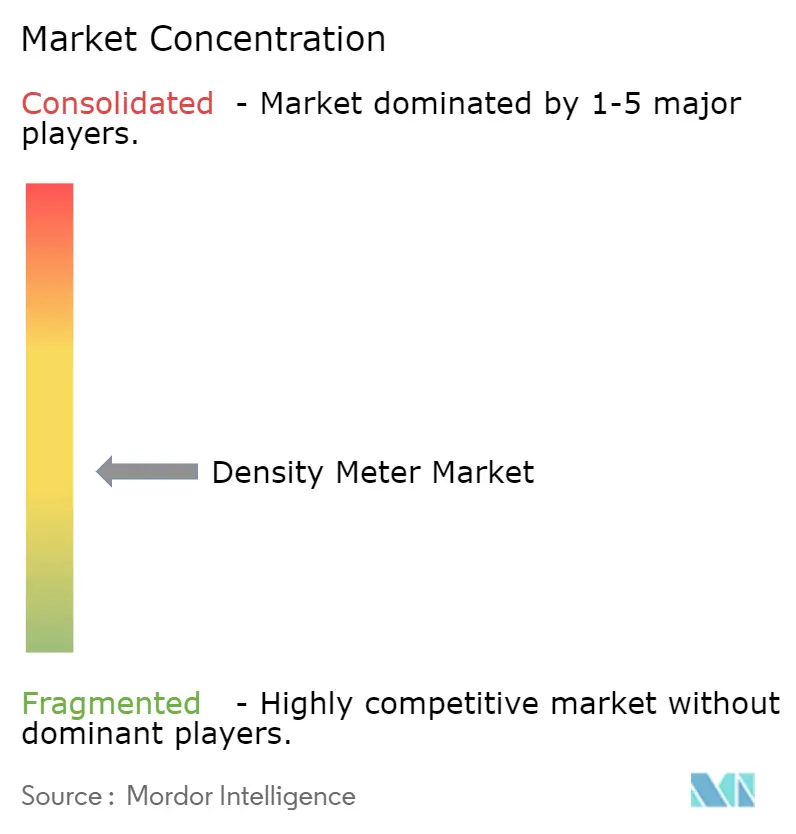
| Market Concentration | Medium |
Major Players *Disclaimer: Major Players sorted in no particular order Image © Mordor Intelligence. Reuse requires attribution under CC BY 4.0. | |
Density Meter Market Analysis by Mordor Intelligence
The density meter market size was valued at USD 1.12 billion in 2025 and estimated to grow from USD 1.17 billion in 2026 to reach USD 1.42 billion by 2031, at a CAGR of 4.03% during the forecast period (2026-2031). Growing investment in Industry 4.0 platforms, stricter custody-transfer rules in hydrocarbons, and the expansion of continuous bioprocessing collectively sustain long-term purchasing momentum. Asia-Pacific anchors global unit volumes thanks to rapid industrialization, while the Middle East and Africa accelerates fastest on the back of desalination and mining projects. Coriolis designs dominate the installed base, yet ultrasonic systems are registering the strongest uptake as mining operators seek non-invasive monitoring for abrasive slurries. Handheld meters are reshaping field work practices, and software-enabled predictive maintenance is emerging as a key differentiator for premium brands.
Key Report Takeaways
- By measurement technology, Coriolis meters led with 34.32% of density meter market share in 2025, whereas ultrasonic devices are poised for 6.78% CAGR growth through 2031.
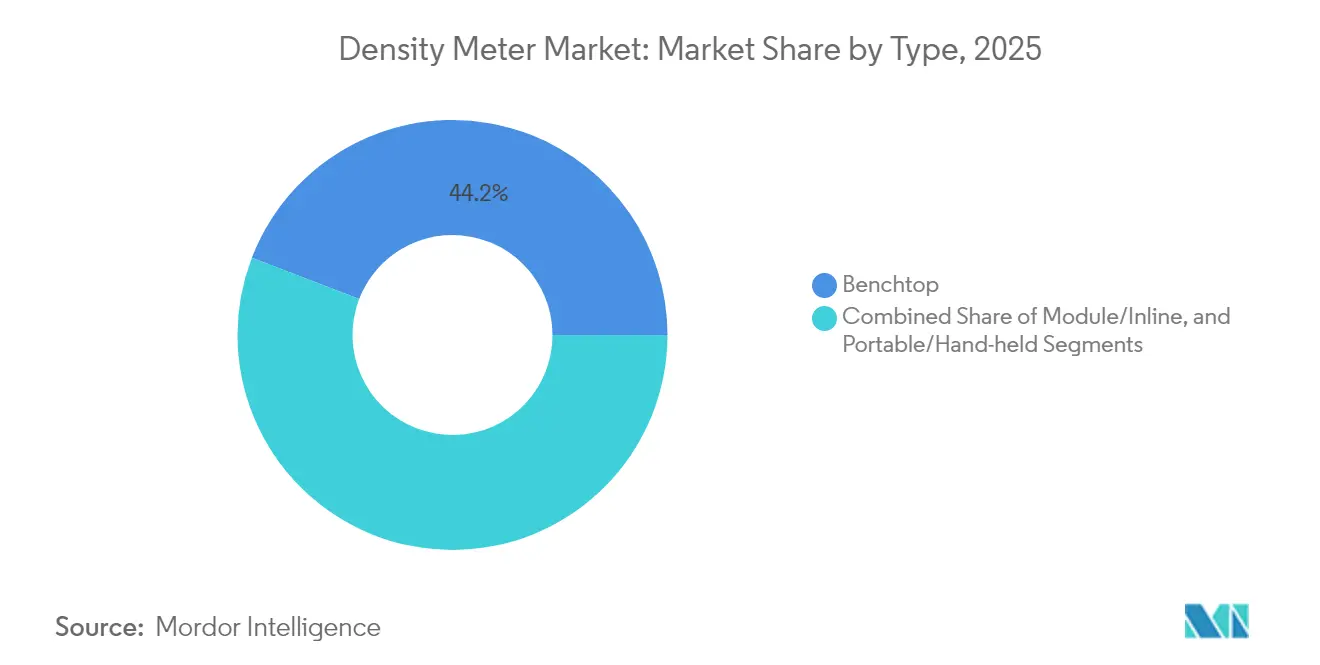
- By instrument format, benchtop units accounted for 44.15% of the density meter market size in 2025, while handheld models are expanding at a 6.19% CAGR to 2031.
- By fluid type, liquid applications represented 67.12% of 2025 revenue; slurry monitoring is projected to grow 4.98% annually through 2031.
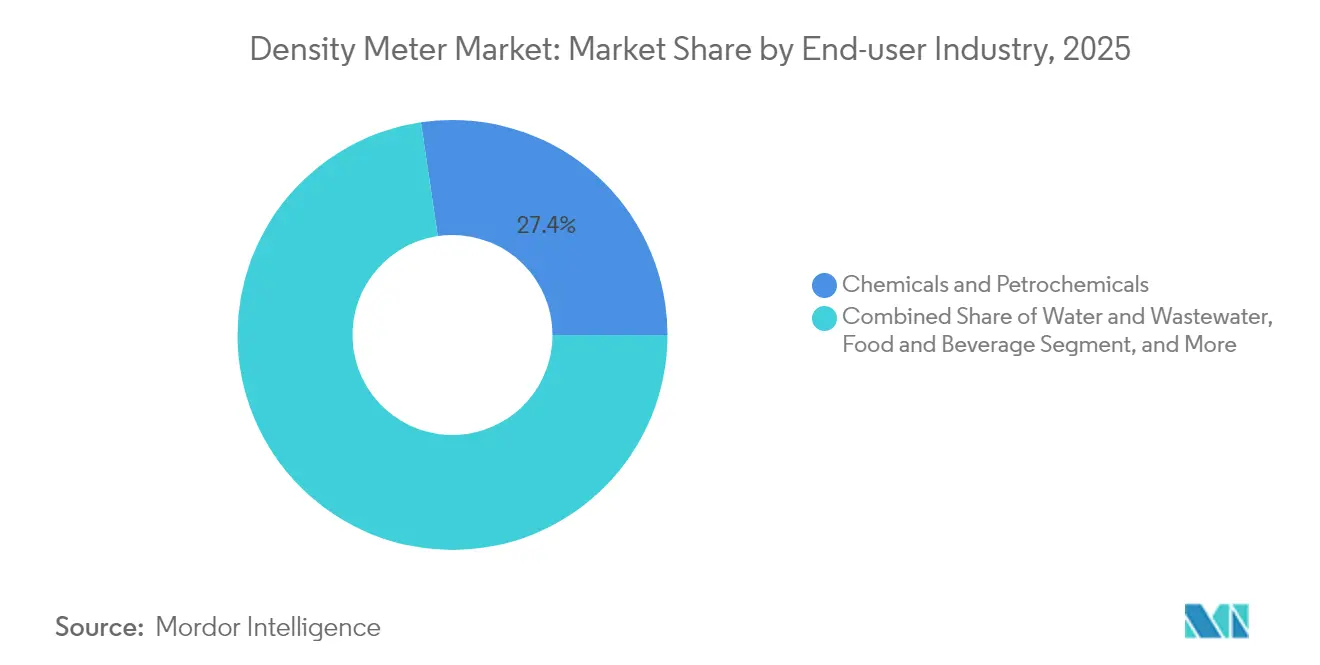
- By end-user, chemicals and petrochemicals held 27.35% revenue share in 2025, whereas water and wastewater treatment will register the fastest 5.93% CAGR to 2031.
- By geography, Asia-Pacific captured 33.62% of 2025 revenue, while the Middle East and Africa is set to advance at 6.08% CAGR over the forecast horizon.
Note: Market size and forecast figures in this report are generated using Mordor Intelligence’s proprietary estimation framework, updated with the latest available data and insights as of 2026.
Global Density Meter Market Trends and Insights
Drivers Impact Analysis*
| Driver | (~) % Impact on CAGR Forecast | Geographic Relevance | Impact Timeline |
|---|---|---|---|
| Digital transformation elevating demand for real-time density monitoring | +0.8% | North America, spillover to Europe | Medium term (2-4 years) |
| Stricter custody-transfer rules in oil and gas | +0.6% | Global, focus on Middle East and North America | Short term (≤ 2 years) |
| Inline quality control in craft beverages | +0.3% | Europe, expanding to North America | Medium term (2-4 years) |
| Slurry-density optimization in mining | +0.4% | South America, applications in APAC | Long term (≥ 4 years) |
| Continuous biopharma manufacturing | +0.5% | Asia-Pacific core, spillover to West | Medium term (2-4 years) |
| Desalination projects in arid regions | +0.4% | Middle East and Africa | Long term (≥ 4 years) |
| Source: Mordor Intelligence | |||
Digital Transformation in Process Industries Elevating Demand for Real-Time Density Monitoring in North America
Factories across North America now embed smart density sensors within MES and LIMS networks, enabling predictive models that cut idle time and tighten product-quality distributions.[1]BioProcess International, “Real-Time, Data-Driven, and Predictive Modeling,” bioprocessintl.com Cloud-hosted analytics combine density, viscosity, and flow data to optimize refinery set-points, as demonstrated at Ergon Refining’s specialty plants.[2]Emerson, “Ergon Refining: A digital transformation story,” emerson.com Inline meters deliver continuous verification that supersedes lab batch tests, and embedded AI algorithms now alert technicians to drift long before off-spec batches appear. Regulatory regimes in food and pharma further accelerate uptake because digital audit trails simplify compliance reporting.
Stricter Custody Transfer Regulations in Global Oil and Gas Sector Boosting Inline Density Meter Installations
Fiscal metering rules now cap uncertainty at below 0.1% for hydrocarbon custody transfers, positioning Coriolis meters as the default solution for pipelines and floating storage units.[3]OnePetro, “Novel Application of Coriolis Meters in Custody Transfer Applications,” onepetro.orgADNOC’s sales-gas network has validated lower OPEX and wider turndown compared to legacy ultrasonic devices, while AGA and ISO standards have been amended to reference Coriolis performance benchmarks. Emerging producers in Africa and Latin America are adopting these standards, thereby expanding the addressable pool for advanced inline instruments that deliver simultaneous mass-flow and density readings.
Rising Adoption of Inline Quality Control in Craft Beverage Industry Across Europe
Micro-breweries and distilleries in Germany and the U.K. are installing compact alcohol-density meters to comply with excise rules and to minimize lab outsourcing costs. Scotch whisky distillers report 0.1%–0.4% accuracy after switching to Coriolis flowmeters, assuring consistent mouthfeel and ABV declaration. Success stories are seeding similar investments among North American craft producers seeking data-driven fermentation control.
Slurry-density optimization in mining
Copper concentrators in Chile and Peru are embedding ultrasonic probes to measure tailings density in pipelines, cutting water use and energy draw in thickening circuits. New non-invasive sensors withstand abrasive slurries and temperatures above 90 °C, yielding real-time feedback for reagent dosing and pump speed adjustments. Multinational miners aim to replicate these gains at Indonesian nickel and Australian iron-ore sites by 2027.
Restraints Impact Analysis*
| Restraint | (~) % Impact on CAGR Forecast | Geographic Relevance | Impact Timeline |
|---|---|---|---|
| Radioactive-source licensing challenges for nuclear gauges | -0.3% | Europe, spillover to other developed regions | Short term (≤ 2 years) |
| High calibration costs for Coriolis meters in emerging economies | -0.4% | APAC and South America | Medium term (2-4 years) |
| Ultrasonic performance drift in hot slurries | -0.2% | Global mining and metallurgy | Long term (≥ 4 years) |
| Price pressure from low-cost Chinese suppliers | -0.5% | Global | Short term (≤ 2 years) |
| Source: Mordor Intelligence | |||
Radioactive-Source Licensing Challenges Limiting Nuclear Density Meter Uptake in Europe
Directive 2013/59/Euratom tightened safety standards, adding recurrent audits and mandatory operator training that raise lifecycle costs for nuclear gauges. Device makers must secure Part 32 licenses and track sealed sources through detailed inventory logs, discouraging small processors that once relied on gamma-ray instruments. Users now gravitate toward ultrasonic or microwave alternatives that eliminate radiological liabilities, accelerating technology substitution across bulk-solids handling and asphalt-mix plants.
High Initial Calibration Costs for Coriolis Density Meters in Emerging Economies
Traceable calibration routines require specialized rigs and reference fluids that few local labs can supply, pushing annual verification expenses beyond 10% of hardware price for many Brazilian and Indian processors. Service engineers from regional hubs add travel fees and downtime, prompting cost-sensitive buyers to opt for vibrating-tube or differential-pressure meters that meet “fit-for-purpose” accuracy thresholds. Suppliers are responding with extended calibration intervals and embedded diagnostics, but adoption gaps will persist until certified facilities proliferate in growth markets.
*Our forecasts treat driver/restraint impacts as directional, not additive. The impact forecasts reflect baseline growth, mix effects, and variable interactions.
Segment Analysis
By Type: Handheld Growth Reshapes Field Measurement
Benchtop units held 44.15% of 2025 revenue, anchored in pharma QC and chemical formulation labs that value multi-parameter analysis and stringent documentation. Conversely, handheld instruments posted a 6.19% CAGR and will surpass USD 318.6 million by 2031, driven by remote pipeline surveys, on-the-spot beverage checks, and mobile mining crews. The density meter market size for portable devices is on a clear upswing as manufacturers add temperature compensation, RFID sample tracking, and Bluetooth export to LIMS platforms.
A broader push toward decentralized decision-making reinforces the shift. Operators now validate product density at the point of fill, avoiding lab queues and catching deviations early. Rugged ABS housings withstand dust and splash, while on-board lithium packs deliver eight-hour autonomy. Enhanced firmware performs automatic viscosity correction, enabling field accuracy within ±0.001 g/cm³. This versatility is expanding addressable use cases from dairy plants to biodiesel terminals, tightening quality loops and curbing rework rates.


By Measurement Technology: Coriolis Dominance Meets Ultrasonic Momentum
Coriolis instruments commanded 34.32% density meter market share in 2025, cemented by unmatched ability to capture mass-flow and density simultaneously-a boon for fiscal custody and recipe control. High-end models achieve ±0.05% density accuracy and self-diagnose coating or two-phase flow, lowering unplanned outages. Feature-rich firmware reduces recalibration frequency from yearly to triennial, trimming ownership costs.
Ultrasonic variants, however, are advancing at a 6.78% CAGR on the strength of clamp-on designs that avert downtime and sanitation worries in dairy, pulp, and mining pipelines. MEMS-powered micro-Coriolis prototypes also surface for micro-reactor and drug-delivery applications where sample volumes are measured in microliters. Suppliers that blend digital twins with inline diagnostics are best positioned as buyers prioritize predictive maintenance over mere sensor accuracy.
By End-user Industry: Water and Wastewater Lead Growth Curve
Chemicals and petrochemicals retained the largest slice at 27.35% in 2025, reliant on tight density control for blending, custody, and emissions accounting. Yet water and wastewater utilities will clock a 5.93% CAGR thanks to desalination mega-projects in Saudi Arabia and the UAE, as well as potable reuse initiatives in California. Density readings guide membrane fouling diagnostics and brine concentration, safeguarding system uptime and optimizing energy draws.
Denser adoption also permeates biological nutrient removal where mixed-liquor density links directly to aeration demand. Smart networks feed readings to AI engines that shave power costs by up to 12%, validating payback in under two years. Across municipal bids, preference now tilts toward meters offering IP68 housings and NB-IoT connectivity for buried reservoirs and sewer interceptors.
By Fluid Medium: Slurry Use-Cases Accelerate
Liquid measurement still drives 67.12% of revenue in 2025, yet slurry applications will outpace with 4.98% CAGR to 2031 as miners optimize tailings consolidation. The density meter market size for mining slurries will top USD 197.4 million by 2031. Operators deploy non-invasive acoustic meters to withstand abrasion at 20 bar line pressures.
Enhanced algorithms now factor particle size distribution and temperature, helping concentrators hit target pulp density within ±0.5% and improving downstream flotation recoveries. Gas-phase measurements remain niche but vital for LNG boil-off and HVAC refrigerant charge monitoring, where density influences energy efficiency and emissions compliance.
Geography Analysis
Asia-Pacific led with 33.62% revenue in 2025, propelled by China’s vast refining and chemical complexes, India’s surging biologics capacity, and South Korea’s semiconductor investments. The density meter market continues to benefit from government programs that reward smart-factory retrofits and sustainability reporting. Japan’s focus on zero-defect automotive fluids further sustains premium sales of laboratory instruments.
The Middle East and Africa, though smaller, deliver top-line acceleration at a 6.08% CAGR as desalination, green hydrogen, and remote pipeline monitoring gain momentum. Saudi Aramco’s upstream projects utilize Coriolis meters in multiphase separators, whereas UAE utilities employ density-based control loops to enhance reverse-osmosis recovery ratios. South African platinum miners retrofit ultrasonic probes to cut water use in tailings thickeners. North America maintains robust replacement demand as chemical and food processors digitize legacy plants. Government incentives for IIoT adoption amplify orders for Ethernet-IP-enabled meters. Europe’s stringent carbon and alcohol tax frameworks underpin steady upgrades, despite energy cost headwinds. South America’s focus on tailings dam safety catalyzes slurry-meter retrofits in Chilean copper and Brazilian iron-ore operations.

Competitive Landscape
The market skews moderately consolidated; the top five vendors hold roughly 55% of global revenue, balancing scale benefits with room for innovative entrants. Anton Paar leverages its global service grid and recent Brabender acquisition to bundle rheology and density technologies. Emerson integrates AI-driven analytics into its Promass line and capitalizes on Roxar multiphase know-how for upstream oil and gas. Mettler-Toledo concentrates on portable and lab niches, adding CFR Part 11-ready data integrity features.
Endress+Hauser’s 2025 alliance with SICK pools gas analysis and flow expertise, offering turnkey compliance packages for emissions monitoring. Newcomers commercialize MEMS-based micro-Coriolis chips for micro-fluidics, while Asian suppliers flood commodity segments with low-cost vibrating-tube meters, intensifying price pressure but lacking deep service support. Winning strategies hinge on predictive maintenance, open-protocol connectivity, and subscription-based calibration services that bundle compliance documentation.
Density Meter Industry Leaders
Anton Paar GmbH
VWR International (Avantor)
Thermo Fisher Scientific
Emerson Electric Co.
Mettler Toledo
- *Disclaimer: Major Players sorted in no particular order

Recent Industry Developments
- January 2025: Endress+Hauser and SICK formed a joint venture, bringing 800 staff under Endress+Hauser SICK GmbH+Co. KG to co-develop gas analyzers and flowmeters.
- June 2024: Endress+Hauser honored 400 inventors at its Innovators’ Meeting after filing 257 patents in 2023.
- January 2024: Anton Paar closed the Brabender acquisition, expanding its sales footprint to 37 centers globally.
- October 2024: Endress+Hauser unveiled a compact hygienic line for pressure and level that features Bluetooth maintenance tools


Research Methodology Framework and Report Scope
Market Definitions and Key Coverage
Our study defines the density meter market as all electronic instruments that quantify the mass-per-unit-volume of liquids, gases, and slurry streams in industrial, laboratory, and field settings, using vibrating-tube, Coriolis, nuclear, ultrasonic, microwave, or gravimetric principles. These devices are sold as benchtop consoles, in-line modules, and portable meters, and revenue is expressed in USD.
Scope Exclusions: Medical bone densitometers and legacy glass hydrometers are not considered.
Segmentation Overview
- By Type
- Benchtop
- Module/Inline
- Portable/Hand-held
- By Measurement Technology
- Coriolis
- Nuclear (Gamma)
- Ultrasonic
- Microwave
- Vibrating U-Tube
- Gravimetric (Hydrometer Replacement)
- By End-user Industry
- Water and Wastewater
- Chemicals and Petrochemicals
- Mining and Metal Processing
- Food and Beverage
- Healthcare and Pharmaceuticals
- Electronics and Semiconductors
- Oil and Gas (Upstream, Midstream, Downstream)
- Power and Utilities
- Research and Academic
- By Fluid Medium
- Liquids
- Gases
- Slurries and Suspensions
- By Geography
- North America
- United States
- Canada
- Mexico
- Europe
- Germany
- United Kingdom
- France
- Nordics
- Rest of Europe
- South America
- Brazil
- Rest of South America
- Asia-Pacific
- China
- Japan
- India
- South-East Asia
- Rest of Asia-Pacific
- Middle East and Africa
- Middle East
- Gulf Cooperation Council Countries
- Turkey
- Rest of Middle East
- Africa
- South Africa
- Rest of Africa
- Middle East
- North America
Detailed Research Methodology and Data Validation
Primary Research
Mordor analysts interviewed plant engineers, instrument distributors, and quality-control managers across North America, Europe, and Asia-Pacific, and we polled procurement heads in chemicals, beverages, and wastewater utilities. These discussions validated typical replacement cycles, price brackets, and emerging preferences (such as portable meters for on-site checks), filling gaps left by desk research.
Desk Research
We began with publicly available datasets, customs import codes for HS 902610, production statistics from the International Energy Agency, global refinery throughput from the EIA, and chemical output indices from UNIDO to map demand pools. Trade association notes from the American Water Works Association, the International Council on Mining & Metals, and the World Semiconductor Council helped us link density control needs to sector growth. Company filings, investor decks, and press releases supplied average selling price (ASP) guidance, while D&B Hoovers, Dow Jones Factiva, and Questel patent counts clarified competitive intensity and technology shifts. This list illustrates, rather than exhausts, the secondary material we reviewed for context and cross-checks.
A follow-up scan of regional regulations (for example, API Chapter 14.6 on oil measurement) and standards (ISO 12185 for petroleum) anchored our understanding of mandatory adoption triggers before we moved to primary work.
Market-Sizing & Forecasting
A top-down reconstruction of the global installed base, using sector output volumes and penetration ratios, established our 2025 baseline; selective bottom-up roll-ups from sampled supplier invoices and channel checks served as reasonableness tests. Key model inputs include refinery throughput, municipal wastewater spending, semiconductor wet-chemicals consumption, and capital expenditure on process automation. Five-year outlooks for each driver feed a multivariate regression, and scenario analysis adjusts for currency shifts and commodity cycles. Where supplier data lacked regional split, proportional allocation relied on historic trade shares.
Data Validation & Update Cycle
Before sign-off, separate Mordor teams review variance flags, re-run sensitivity checks, and reconcile findings with fresh news flow. The study refreshes every twelve months, with interim updates triggered by material events such as major regulatory changes or large capacity additions.
Why Mordor's Density Meter Baseline Commands Reliability
Published figures differ because firms pick dissimilar product baskets, apply varied ASP escalators, and freeze exchange rates at different points.
We openly state our inclusions, refresh annually, and align model drivers with measurable industrial activity, which together yield a steadier benchmark for planners.
Benchmark comparison
| Market Size | Anonymized source | Primary gap driver |
|---|---|---|
| USD 1.12 B (2025) | Mordor Intelligence | - |
| USD 1.14 B (2024) | Global Consultancy A | Focuses on lab and in-line units only; relies on revenue of a handful of OEMs |
| USD 1.07 B (2024) | Industry Publisher B | Excludes portable meters and uses flat ASP assumptions across regions |
| USD 1.29 B (2024) | Data Briefing C | Adds bone densitometers and applies aggressive price mark-ups |
The comparison shows that scope breadth, unit mix, and price logic drive most gaps. By grounding every step in audited drivers and timely refreshes, Mordor delivers a balanced, transparent baseline clients can depend on.


Key Questions Answered in the Report
What is the current value of the density meter market?
The density meter market stands at USD 1.17 billion in 2026 and will rise to USD 1.42 billion by 2031.
Which measurement technology dominates density meter installations?
Coriolis instruments lead with 34.32% of 2025 revenue because they combine mass-flow and density readings in a single device.
Why are handheld density meters gaining popularity?
Field crews favor handheld units for on-the-spot verification, supported by battery power, Bluetooth data export, and lab-grade accuracy
Which end-use sector will grow fastest through 2031?
Water and wastewater treatment will expand at a 5.93% CAGR as desalination and water-reuse projects multiply.
What regions present the strongest growth potential?
The Middle East and Africa will register a 6.08% CAGR owing to desalination megaprojects, oil-and-gas investments, and mining expansions.
How are suppliers adding value beyond basic measurement?
Leading vendors embed AI-driven diagnostics, predictive maintenance, and cloud connectivity to cut downtime and simplify compliance auditing.
Page last updated on:


