Market Overview
| Study Period | 2020 - 2031 |
|---|---|
| Forecast Data Period | 2026 - 2031 |
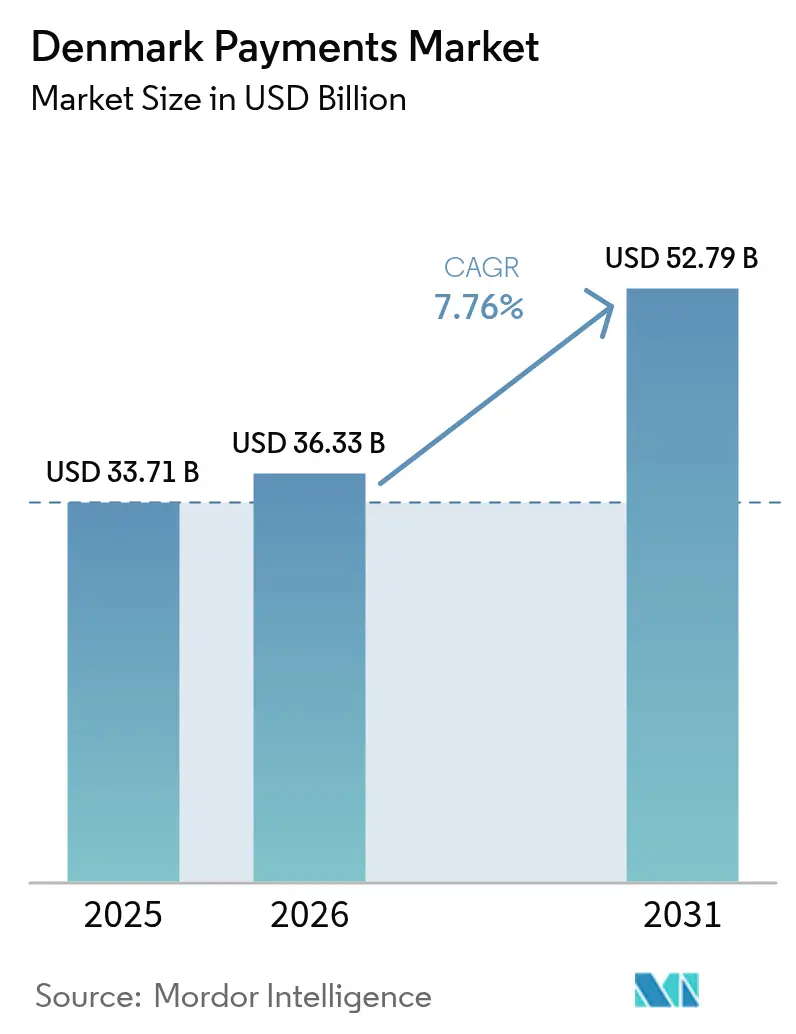
| Base Year Market Size (2025) | USD 33.71 Billion |
| Market Size (2026) | USD 36.33 Billion |
| Market Size (2031) | USD 52.79 Billion |
| Growth Rate (2026 - 2031) | 7.76% CAGR |
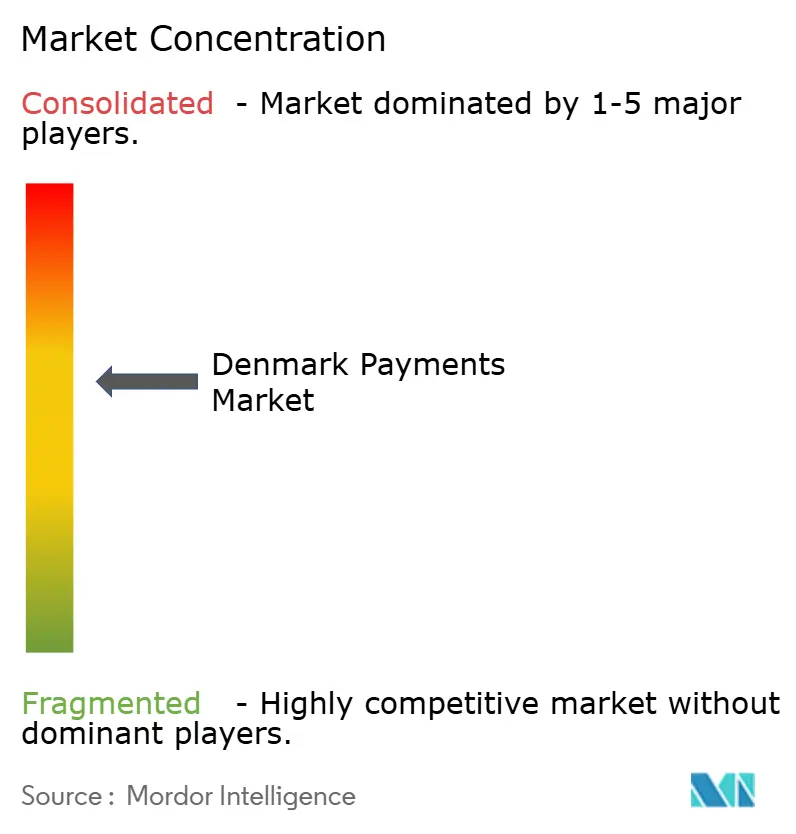
| Market Concentration | Medium |
Major Players*Disclaimer: Major Players sorted in no particular order Image © Mordor Intelligence. Reuse requires attribution under CC BY 4.0. | |
Denmark Payments Market Analysis by Mordor Intelligence
The Denmark payments market size is expected to grow from USD 33.71 billion in 2025 to USD 36.33 billion in 2026 and is forecast to reach USD 52.79 billion by 2031 at 7.76% CAGR over 2026-2031. High consumer trust in digital channels, almost universal broadband coverage, and continuous upgrades to national clearing rails underpin this trajectory. Instant account-to-account services attract both merchants and consumers seeking lower fees and immediate fund availability, while the integration of the national eID MitID has tightened authentication without adding checkout friction. Multinational scheme wallets such as Apple Pay and Google Pay now sit beside domestic champions like Vipps MobilePay, sharpening competition on user experience, fee transparency, and cross-border capabilities. Intensifying sustainability regulations are also reshaping card-manufacturing supply chains, pushing issuers toward eco-friendly materials and carbon-neutral issuance programs.[1]Verifone Systems, “Popular APMs in Nordic Countries,” verifone.com
Key Report Takeaways
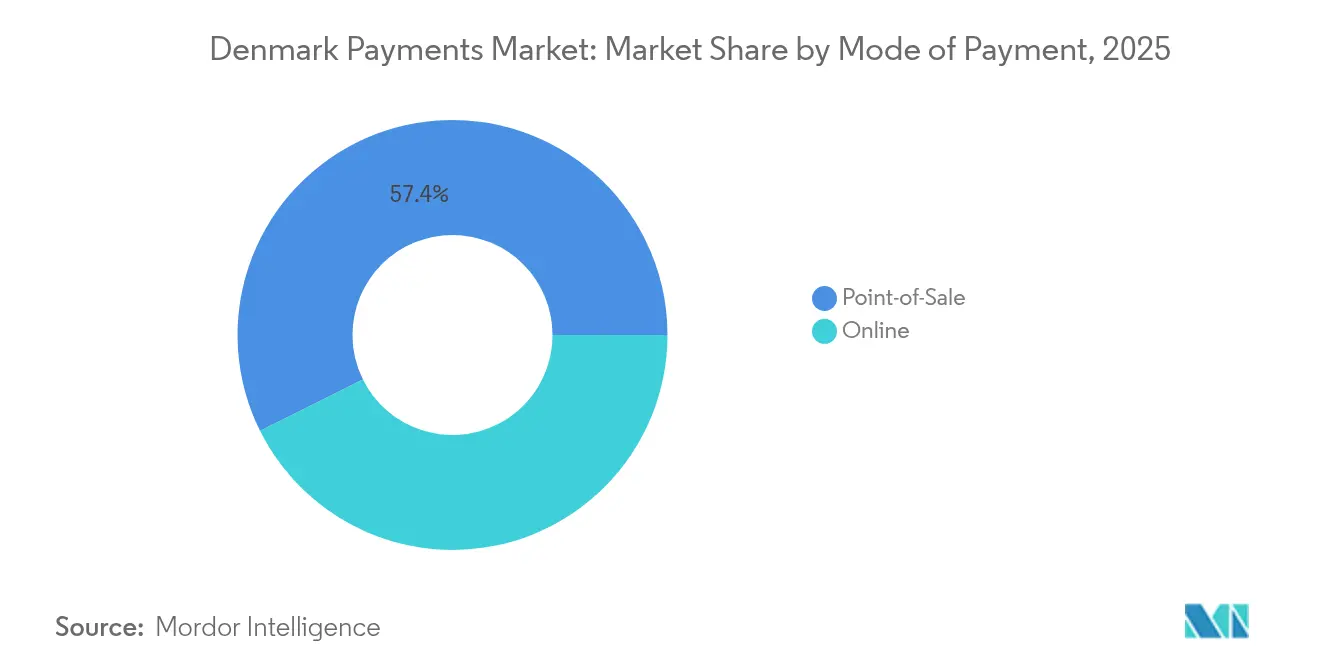
- By mode of payment, point-of-sale cards led with 67.20% of the Denmark payments market share in 2025; online digital wallets and A2A transfers are expanding at a 9.05% CAGR to 2031. Overall Point-of-Sale led with 57.35% revenue share.
- By interaction channel, physical point-of-sale held 71.10% revenue share in 2025, while e-commerce/m-commerce is forecast to advance at 10.25% CAGR through 2031.
- By transaction type, consumer-to-business captured 51.40% of the Denmark payments market size in 2025, and remittances & cross-border flows are projected to grow 12.55% CAGR between 2026-2031.
- By end-user industry, retail maintained 34.60% share of the Denmark payments market size in 2025, whereas healthcare is set to climb at 9.95% CAGR to 2031.
Note: Market size and forecast figures in this report are generated using Mordor Intelligence’s proprietary estimation framework, updated with the latest available data and insights as of 2026.
Denmark Payments Market Trends and Insights
Drivers Impact Analysis*
| Driver | (~) % Impact on CAGR Forecast | Geographic Relevance | Impact Timeline |
|---|---|---|---|
| Rise of Dankort-Linked Mobile Wallets among Small Merchants | +1.2% | National, with higher adoption in urban centers | Short term (≤ 2 years) |
| Government-Backed Instant Payment Rail (Straksclearing) Driving Real-time Adoption | +2.3% | National | Medium term (2-4 years) |
| E-commerce Checkout Optimisation through PSD2 SCA Exemptions | +1.5% | National, with cross-border implications | Medium term (2-4 years) |
| Growth of Cross-border Subscription Services into Denmark | +1.1% | National, with international connectivity | Medium term (2-4 years) |
| Increasing Merchant Acceptance of Apple Pay & Google Pay in Mass Transit | +0.8% | Urban centers, particularly Copenhagen | Short term (≤ 2 years) |
| Integration of National eID (MitID) with Payment Authentication | +0.9% | National | Medium term (2-4 years) |
| Source: Mordor Intelligence | |||
Rise of Dankort-Linked Mobile Wallets among Small Merchants
Dankort’s direct tie-in with smartphone wallets lets micro-merchants dodge international scheme fees while offering tap-and-go convenience. Domestic acquirers are rolling out simplified onboarding and flat-fee bundles, trimming the break-even point for sole traders. Visa and Mastercard acceptance remains vital for tourist spend, forcing terminals to operate dual-routing logic that auto-selects the cheapest network. Danish regulators are reviewing fee caps to keep Dankort viable as Apple Pay and Google Pay deepen loyalty integrations, intensifying margin pressure on local issuers.
Government-Backed Instant Payment Rail (Straksclearing) Driving Real-Time Adoption
Straksclearing settles retail transfers in seconds and processed daily values equal to 25% of GDP in 2024.[2]Danmarks Nationalbank, “The Digital Retail Payment Market Is Changing,” nationalbanken.dk Banks leverage the rail to launch instant salary disbursement and just-in-time supplier payments, unlocking working-capital benefits for corporates. Scheduled migration of Danish kroner settlement to TARGET Services in 2025 will open a direct bridge to pan-European TIPS, letting Nordic users push funds to euro wallets without intermediary banks. Providers are building overlay services such as request-to-pay and bulk payout APIs to monetise the infrastructure shift.
E-commerce Checkout Optimisation through PSD2 SCA Exemptions
Low-risk transaction and trusted beneficiary exemptions shave authentication steps off repeat purchases, lifting conversion for Danish online stores. Merchants deploy data-driven risk engines to maximise exemption eligibility while keeping fraud below regulator thresholds. The DFSA advocates a principle-based PSD3 that would further relax prescriptive rules and widen scope for machine-learning risk models.[3]European Commission, “Revised Rules for Payment Services in the EU,” europa.eu Payment gateways compete on exemption hit-rate dashboards and adaptive challenge flows that trade step-up prompts for real-time risk scores.
Growth of Cross-Border Subscription Services into Denmark
Streaming, software-as-a-service, and curated-box providers localise billing flows, integrating tokenisation to cut recurring decline rates. Payment processors route transactions via local acquiring bins, boosting authorisation and slicing currency conversion cost for merchants billing in DKK. IMF studies suggest CBDCs could slash cross-border fee structures by 60%, a prospect already spurring sandbox pilots between Danmarks Nationalbank and Nordic peers. Issuers analyse recurring data sets to upsell embedded credit and micro-insights packages to subscription platforms.
Restraints Impact Analysis*
| Restraint | (~) % Impact on CAGR Forecast | Geographic Relevance | Impact Timeline |
|---|---|---|---|
| Card-Scheme Interchange Fee Cap Pressure on Issuer Revenues | -0.7% | National, with EU regulatory alignment | Medium term (2-4 years) |
| High Saturation of Banked Population Limiting New-to-Bank Users | -0.5% | National | Long term (≥ 4 years) |
| Security Concerns Around Open-Banking APIs | -0.6% | National, with cross-border implications | Short term (≤ 2 years) |
| Legacy POS Hardware in Rural Jutland SMEs | -0.4% | Rural regions, particularly Jutland | Medium term (2-4 years) |
| Source: Mordor Intelligence | |||
Card-Scheme Interchange Fee Cap Pressure on Issuer Revenues
European legislation limits interchange to 0.2% on debit and 0.3% on credit, compressing Danish issuers’ core income. Banks respond by bundling lifestyle perks, insurance, and carbon-tracking dashboards into paid account tiers. Merchant-funded cashback marketplaces emerge as an offset model, shifting reward cost to retailers keen on repeat visits. Consolidation among mid-size issuers accelerates as compliance and tech transformation budgets rise faster than fee income
High Saturation of Banked Population Limiting New-to-Bank Users
With adult account penetration above 99%, growth shifts from acquisition to share-of-wallet battles. Challenger banks differentiate through hyper-personalised insights, automated budgeting nudges, and integrated crypto trading. Incumbents re-platform legacy cores to speed feature release cycles and defend primary relationship status. Non-bank brands in retail and telco embed financial services, fragmenting the value chain and prompting alliances between banks and vertical specialists.
*Our forecasts treat driver/restraint impacts as directional, not additive. The impact forecasts reflect baseline growth, mix effects, and variable interactions.
Segment Analysis
By Mode of Payment: Digital Wallets Challenging Card Dominance
Point-of-sale cards generated 67.20% revenue in 2025, underpinned by reliable terminal coverage and consumer familiarity. Overall Point-of-Sale led with 57.35% revenue share. The Denmark payments market size for online digital wallet and A2A flows is projected to grow at 9.05% CAGR, driven by one-click checkout and bank-sponsored pay-by-link services. Issuers issue co-branded tokenised credentials to secure wallet real estate, while processors add network-token orchestration to preserve card rails inside wallet transactions.
Although cash retains cultural relevance for peer gifting, share dropped to 10% of store payments in 2023. Younger cohorts pivot to BNPL options; 30% have tried instalment products, with fashion and electronics the leading categories. Wearable NFC form factors, niche gift cards, and QR acceptance gain visibility at events and campus venues, hinting at long-tail monetisation plays.


By Interaction Channel: Mobile Commerce Accelerates
Physical point-of-sale held 71.10% of 2025 value, yet mobile commerce is racing ahead at 10.25% CAGR as retailers invest in progressive web apps and in-app loyalty wallets. The Denmark payments market share for e-commerce is set to widen as omnichannel journeys blend click-to-collect and scan-to-buy experiences. Banks integrate MitID-based face recognition in their SDKs, removing password friction and boosting mobile completed-basket ratios.
Unified commerce drives demand for middleware that reconciles online and store transactions in a single ledger. Hospitality chains deploy pay-at-table QR to shorten turnover time, while grocery leaders trial smart trolley checkout that bills automatically on exit. Acquirers package token vaults, risk scoring, and micro-refund APIs to support these blended journeys.
By Transaction Type: Cross-Border Payments Outpace Domestic
Consumer-to-business flows retained 51.40% share in 2025, but cross-border activity outclasses domestic growth rates. The Denmark payments market size for remittances and cross-border is tracking a 12.55% CAGR as SMEs push export volumes and expatriate residents remit to other Nordic states. Vipps MobilePay’s phone-number-based transfers are cannibalising traditional SWIFT corridors, and fee transparency has become a purchase-decision lever.
Person-to-person volumes soar each December when gift splitting peaks. Business-to-business digitisation remains an untapped pool; corporates shift from batch giro files toward API-driven treasury payments, unlocking straight-through reconciliation benefits. Pharmaceutical export booms, fuelled by weight-loss drug demand, are swelling high-ticket cross-border settlements and attracting niche foreign-exchange specialists.

By End-User Industry: Healthcare Digitalisation Drives Growth
Retail commanded 34.60% of 2025 value as supermarkets and fashion groups roll out self-checkout and interactive fitting rooms. Denmark’s nationwide e-health portal sundhed.dk catalyses the fastest expansion; the Denmark payments market size for healthcare transactions is set to climb 9.95% CAGR as clinics embed card-on-file consent in patient portals. Insurers partner with payment gateways to enable real-time co-pay settlement at discharge, improving cash flow.
Entertainment & digital content benefits from subscription bundling, where telcos package streaming in 12-month plans settled through direct carrier billing or tokenised cards. Travel rebounds on contactless door access and ride-to-gate integrations. Utilities digitalise bill presentment; MitID verifies identity, and request-to-pay lowers direct-debit failure. Age-restricted product retail pilots electronic age verification that links tokenised ID to payment credentials, streamlining compliance.
Geography Analysis
The Denmark payments market operates inside a mature Nordic ecosystem known for collaborative policy design and high digital literacy. National GDP is projected to expand 3.6% in 2025 even as inflation cools to 1.6%, sustaining discretionary spending that funnels into digital channels. Copenhagen serves as the testing lab for tap-to-transit pilots and walk-out store models; success metrics here often green-light countrywide deployment.
Suburban municipalities follow close behind, aided by municipal grants that subsidise smart-terminal upgrades for small enterprises. Rural Jutland still houses legacy hardware and patchy connectivity; public-private fibre rollouts and terminal trade-in programs are addressing the digital gap. The Denmark payments market share for contactless in rural cafés rose 8 percentage points in 2024 after card acquirers bundled cellular fallback modems into rental agreements.
The 2025 TARGET Services migration harmonises settlement with euro markets, giving Danish PSPs real-time euro liquidity without nostros. Cross-currency TIPS rails will let Nordic shoppers pay southern European merchants in real time, fostering tourism spend in both directions. Danmarks Nationalbank meanwhile stress-tests offline fallback for critical infrastructure, ensuring payment resilience during cyber or power incidents. This multi-layered resiliency approach sustains public trust and supports seamless adoption across all regions.
Competitive Landscape
Competition blends incumbents, big-tech wallets, and fintech specialists. Vipps MobilePay controls 70% of domestic mobile transaction counts, yet Apple Pay and Google Pay steadily siphon affluent cardholders attracted to multi-country acceptance and device integration. Nets A/S maintains Dankort processing dominance but invests in cloud-native acquiring to fend off Stripe and Adyen entries. Danske Bank, Nordea, and Jyske upgrade open-banking APIs, racing to embed services inside merchant ERP systems.
Fintech integrator BEC Financial Technologies aggregates compliance and core banking for mid-tier institutions, unlocking scale economies. Subaio brings subscription-management to bank apps, increasing customer stickiness, while LSEG data feeds enrich risk models. International PSPs entice export-oriented SMEs with multi-currency wallets and automated tax reporting, pressured by European Value Added Tax One-Stop Shop requirements.
Strategic partnerships continue to shape market boundaries. Terminal provider Verifone teams with franchise retailers to roll out Android-based smart POS that deliver in-aisle payment and inventory checks. Cloud processor Clearhaus deepens BNPL support for Shopify merchants, while Inpay leverages its EMI licence to court marketplace payouts. Sustainability differentiators emerge; Thales’ PLA card portfolio persuades climate-conscious issuers eager to meet ESG scorecards.
Denmark Payments Industry Leaders
MobilePay A/S
Visa Inc.
American Express Company
Mastercard Inc.
PayPal Holdings, Inc.
- *Disclaimer: Major Players sorted in no particular order

Recent Industry Developments
- May 2025: Thales unveiled PLA payment cards in Denmark, pairing a carbon-offset program with life-cycle tracking. Strategy: positions issuers to meet forthcoming EU eco-design rules and capture green-minded consumers.
- April 2025: Vipps MobilePay extended P2P reach to Sweden, forming a unified Nordic corridor of 12 million users. Strategy: builds network effects and locks in scale before pan-European wallet standards roll out.
- April 2025: Tink upgraded Danish bank connectivity and launched smart routing for payments. Strategy: raises conversion and reduces scheme fees for merchants, reinforcing Tink’s positioning ahead of PSD3 competition.
- March 2025: BEC Financial Technologies completed phase-one migration to a modular payment hub. Strategy: de-risks looming NIS2 resilience mandates and opens up faster product iteration for 20 client banks.


Denmark Payments Market Report Scope
The Denmark Payments Market is segmented by Mode of Payment (Point of Sale (Card Payments, Digital Wallet, Cash), Online Sale (Card Payments, Digital Wallet)), and by End-user Industries (Retail, Entertainment, Healthcare, Hospitality). E-commerce payments include online purchases of goods and services such as purchases made on e-commerce websites and online booking of travel and accommodation. The market scope excludes online purchases of motor vehicles, real estate, utility bill payments (such as water, heating, and electricity), mortgage payments, loans, credit card bills, or purchases of shares and bonds. As for Point-of-Sale, all transactions that occur at the physical point of sale are included in the scope of the market. It includes traditional in-store transactions and all face-to-face transactions regardless of the location of the transaction. Cash is also considered for both cases (cash-on-delivery for e-commerce sales).
The study tracks key market metrics, underlying growth influencers, and significant industry vendors, supporting Denmark's market estimates and growth rates throughout the anticipated period. The study looks at COVID-19's overall influence on the Danish payment ecosystem.
Segmentation by Mode of Payment
| Point-of-Sale | Card (Debit, Credit, Pre-paid) |
| Digital Wallets (Apple Pay, Google Pay, Interac Flash) | |
| Cash | |
| Other POS (Gift-cards, QR, Wearables) | |
| Online | Card (Card-Not-Present) |
| Digital Wallet and Account-to-Account (Interac e-Transfer, PayPal) | |
| Other Online (COD, BNPL, Bank Transfer) |
Segmentation by Interaction Channel
| Point-of-Sale |
| E-commerce/M-commerce |
Segmentation by Transaction Type
| Person-to-Person (P2P) |
| Consumer-to-Business (C2B) |
| Business-to-Business (B2B) |
| Remittances and Cross-border |
Segmentation by End-user Industry
| Retail |
| Entertainment and Digital Content |
| Healthcare |
| Hospitality and Travel |
| Government and Utilities |
| Other End-user Industries |
| Segmentation by Mode of Payment | Point-of-Sale | Card (Debit, Credit, Pre-paid) |
| Digital Wallets (Apple Pay, Google Pay, Interac Flash) | ||
| Cash | ||
| Other POS (Gift-cards, QR, Wearables) | ||
| Online | Card (Card-Not-Present) | |
| Digital Wallet and Account-to-Account (Interac e-Transfer, PayPal) | ||
| Other Online (COD, BNPL, Bank Transfer) | ||
| Segmentation by Interaction Channel | Point-of-Sale | |
| E-commerce/M-commerce | ||
| Segmentation by Transaction Type | Person-to-Person (P2P) | |
| Consumer-to-Business (C2B) | ||
| Business-to-Business (B2B) | ||
| Remittances and Cross-border | ||
| Segmentation by End-user Industry | Retail | |
| Entertainment and Digital Content | ||
| Healthcare | ||
| Hospitality and Travel | ||
| Government and Utilities | ||
| Other End-user Industries | ||


Key Questions Answered in the Report
What is the current size of the Denmark payments market?
The market stands at USD 36.33 billion in 2026 and is on track for USD 52.79 billion by 2031.
Which payment mode is growing fastest in Denmark?
Online digital wallets and account-to-account transfers are expanding at 9.05% CAGR through 2031, rapidly challenging card dominance.
How important are instant payments in Denmark?
Straksclearing settles transactions in seconds and already supports daily values equal to 25% of GDP, underpinning widespread real-time adoption.
Why is healthcare the fastest-growing end-user segment?
National e-health portals such as sundhed.dk integrate payment at the point of care, pushing healthcare transaction value toward a 9.95% CAGR.
What regulatory shifts should payment providers monitor?
The Digital Operational Resilience Act and the forthcoming PSD3 will tighten cybersecurity, expand open-banking scope, and reshape revenue models tied to interchange.
How competitive is the mobile wallet space?
Vipps MobilePay leads with 70% usage, yet Apple Pay and Google Pay are gaining share, intensifying innovation on loyalty, cross-border capability, and fee structures.
Page last updated on:


