Denmark Data Center Rack Market Size and Share
Market Overview
| Study Period | 2020 - 2031 |
|---|---|
| Forecast Data Period | 2026 - 2031 |
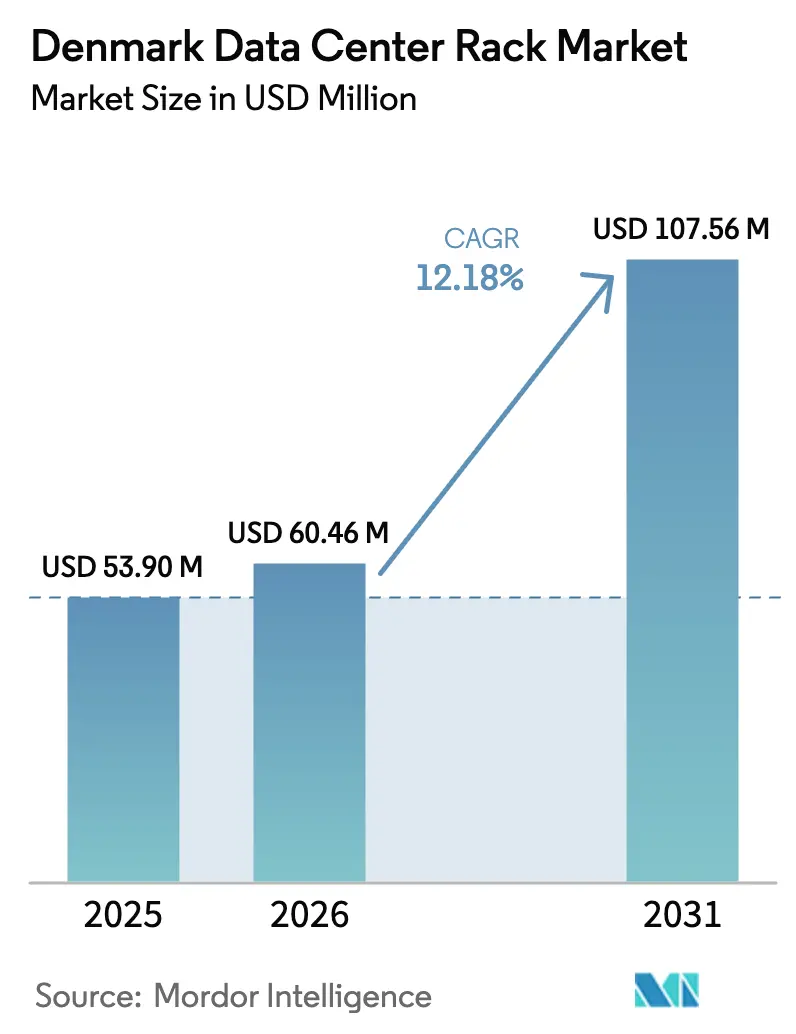
| Base Year Market Size (2025) | USD 53.9 Million |
| Market Size (2026) | USD 60.46 Million |
| Market Size (2031) | USD 107.56 Million |
| Growth Rate (2026 - 2031) | 12.18% CAGR |
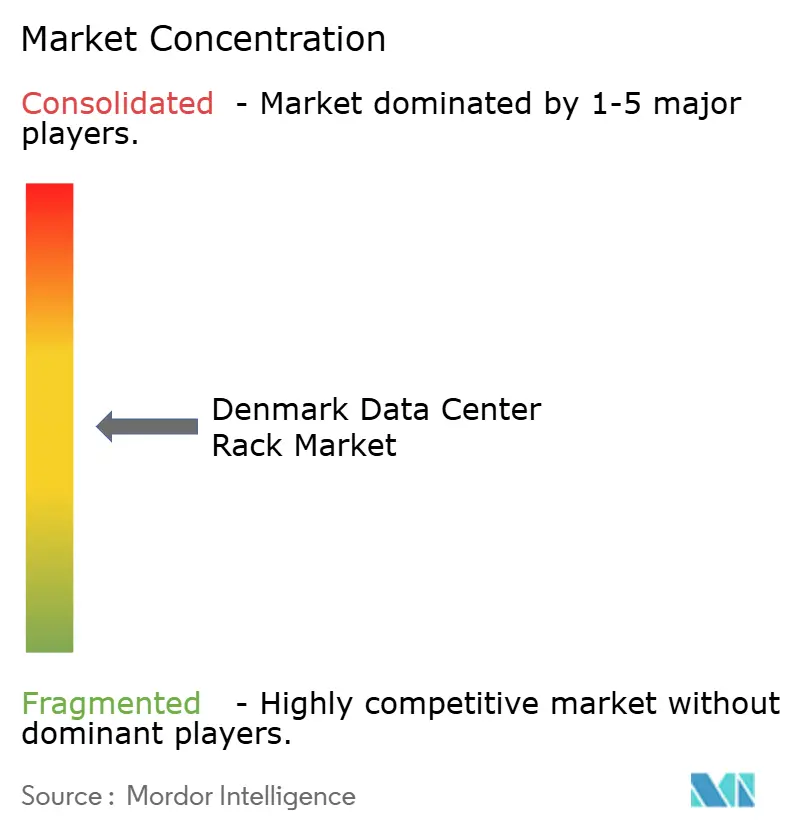
| Market Concentration | Medium |
Major Players *Disclaimer: Major Players sorted in no particular order Image © Mordor Intelligence. Reuse requires attribution under CC BY 4.0. | |
Denmark Data Center Rack Market Analysis by Mordor Intelligence
Denmark data center rack market size in 2026 is estimated at USD 60.46 million, growing from 2025 value of USD 53.9 million with 2031 projections showing USD 107.56 million, growing at 12.18% CAGR over 2026-2031. Expansion mirrors Denmark’s role as a Nordic digital hub where 81% of the national power mix comes from renewable sources, giving operators a cost-stable, low-carbon energy base that supports premium rack investments. Continuous infrastructure spending, such as Microsoft’s multiyear build program that has required 4.1 million work hours and created 1,005 construction jobs, bolsters local demand.[1]Microsoft Corp., “Microsoft Expands Sustainable Danish Data Centers,” news.microsoft.com District-heating buy-back schemes allow data centers to monetize waste heat, offsetting 10–15% of operating costs and accelerating adoption of closed-cabinet racks engineered for efficient thermal capture. The full-rack form factor remains dominant, but AI workloads pushing 60–120 kW per rack are steering buyers toward taller 48U frames and liquid-cooling-ready designs. Material innovation, especially the move from steel toward lighter aluminum, is gaining traction as operators confront floor-loading limits for GPU-dense deployments.
Key Report Takeaways
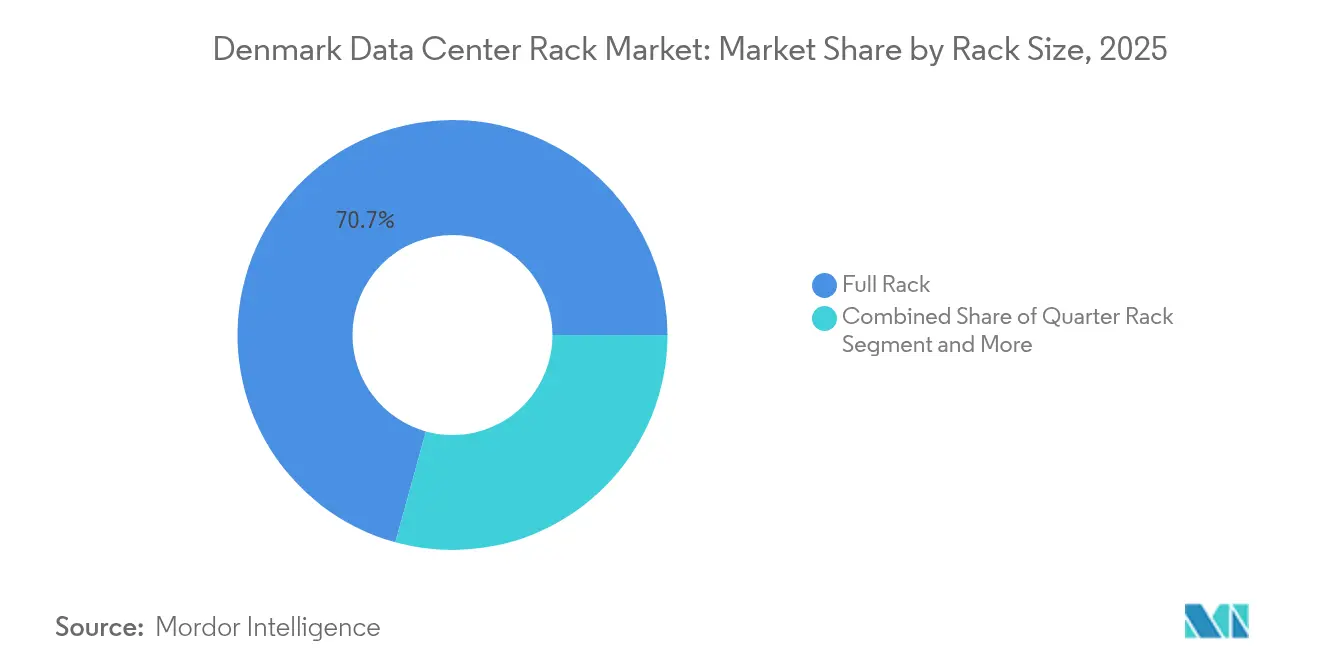
- By rack size, full racks led with 70.72% of Denmark data center rack market share in 2025; quarter racks are projected to post the fastest 18.87% CAGR through 2031.
- By rack height, 42U cabinets held 54.63% share of the Denmark data center rack market size in 2025, while 48U is advancing at an 18.16% CAGR to 2031.
- By rack type, closed-cabinet solutions captured 75.58% share in 2025 and are expanding at 19.02% CAGR to 2031.
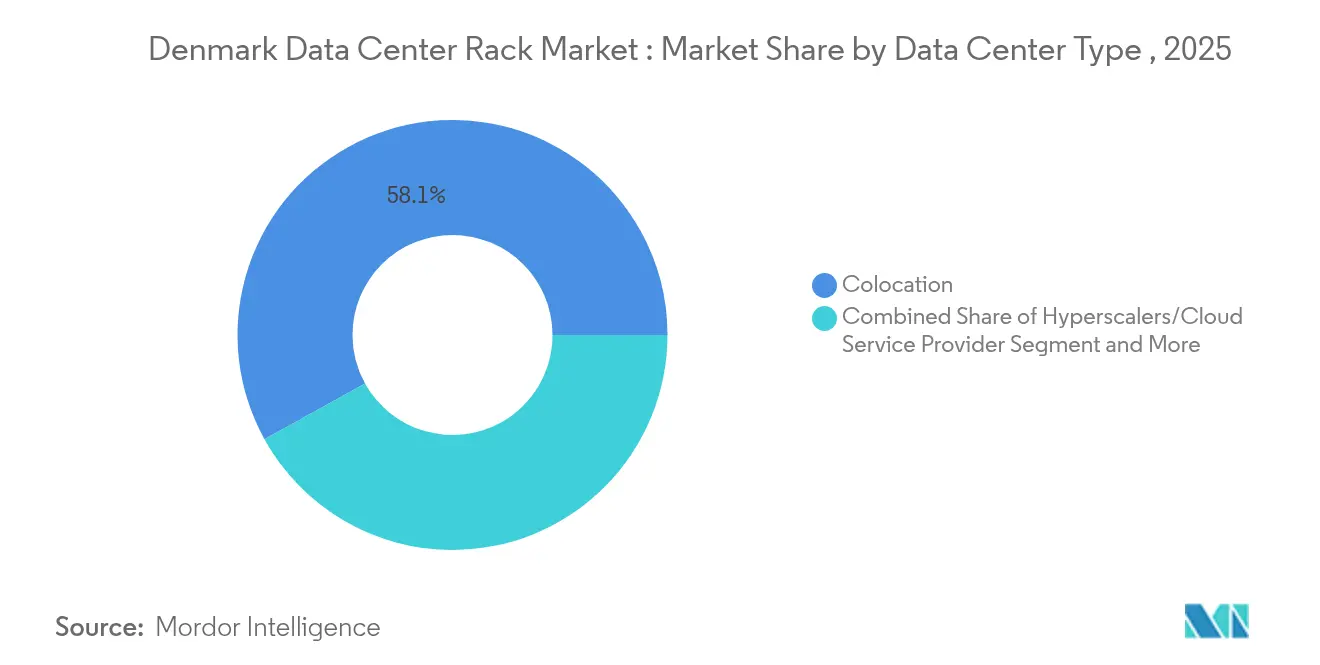
- By data-center type, colocation facilities accounted for 58.05% of Denmark data center rack market share in 2025; hyperscale deployments show the highest 20.14% CAGR through 2031.
- By material, steel held 74.62% share of the Denmark data center rack market size in 2025, while aluminum is forecast to grow 19.11% CAGR to 2031.
Note: Market size and forecast figures in this report are generated using Mordor Intelligence’s proprietary estimation framework, updated with the latest available data and insights as of 2026.
The contribution of Denmark is incorporated into a multi-country and multi-region total that reflects the full breadth of industry. The data center rack market size by Mordor Intelligence expresses that combined magnitude.
Denmark Data Center Rack Market Trends and Insights
Drivers Impact Analysis*
| Driver | % Impact on CAGR Forecast | Geographic Relevance | Impact Timeline |
|---|---|---|---|
| Surge in cloud-based business operations | +2.1% | Global, with Nordic emphasis on sustainability | Medium term (2-4 years) |
| Internet adoption & IT-services expansion | +1.8% | Denmark national, spillover to Nordics | Short term (≤ 2 years) |
| Hyperscale & colocation build-outs near renewable-rich grids | +2.7% | Denmark core, expansion to renewable corridors | Long term (≥ 4 years) |
| Rise in AI-driven high-density racks | +3.2% | Global with Denmark early adoption | Medium term (2-4 years) |
| District-heating buy-back incentives for waste-heat racks | +1.6% | Denmark national, Nordic regional interest | Long term (≥ 4 years) |
| Power-to-X pilot racks with on-site hydrogen fuel cells | +0.9% | Denmark core, EU regulatory alignment | Long term (≥ 4 years) |
| Source: Mordor Intelligence | |||
Hyperscale & Colocation Build-outs Near Renewable-Rich Grids
Denmark’s offshore-wind corridor delivers stable, low-volatility power that lets hyperscale firms such as Google run operations on 100% renewables.[2]Google LLC, “Fredericia Data Center Powered by 100% Renewables,” blog.google atNorth’s planned 250 MW Ølgod campus exemplifies how proximity to generation assets cuts transmission losses by 15–20%, lowering opex and supporting high-density rack clusters. Carbon-neutral credentials attract enterprise tenants that must meet ESG targets, reinforcing the Denmark data center rack market as a preferred destination.
Internet Adoption & IT-Services Expansion
With 99.997% grid uptime, Denmark ranks among Europe’s most reliable power markets, encouraging mission-critical SaaS providers to colocate locally. Fiber-optic upgrades and 5G rollout spur edge deployments that rely on standardized rack kits for rapid activation.
District-Heating Buy-Back Incentives for Waste-Heat Racks
Two-thirds of Danish households tap district heating. Tax changes in 2022 removed barriers for data-center hookups, and Meta’s Odense campus now warms 6,900 homes annually using recycled rack heat. [3]Meta Platforms Inc., “Odense Data Center Heat Recycling,” about.facebook.com Heat revenue boosts IRR enough to warrant premium enclosures tailored for hot-water capture, lifting the Denmark data center rack market.
Rise in AI-Driven High-Density Racks
Training clusters for generative-AI workloads need 60–120 kW per rack—up to eight times traditional loads. Denmark’s cool climate and district-heating network reduce liquid-cooling costs. Penta Infra’s CPH-1 site hit 100% heat-reuse efficiency in 2024, proving that AI-grade racks can deliver parallel revenue from heat sales PentaInfra. The capability accelerates turnover from 42U to 48U racks, boosting the Denmark data center rack market.
Restraints Impact Analysis*
| Restraint | % Impact on CAGR Forecast | Geographic Relevance | Impact Timeline |
|---|---|---|---|
| Low availability of skilled resources | -1.4% | Denmark national, Nordic regional | Short term (≤ 2 years) |
| Limited industrial land near 132 kV grid nodes | -0.8% | Denmark core urban areas | Medium term (2-4 years) |
| Escalating copper prices inflating cabling costs | -1.2% | Global with Denmark import dependency | Short term (≤ 2 years) |
| Prospective carbon-based server tax | -0.6% | EU regulatory framework, Denmark early adoption | Long term (≥ 4 years) |
| Source: Mordor Intelligence | |||
Low Availability of Skilled Resources
Microsoft’s build program alone needed 1,005 specialized workers, stretching Denmark’s limited technical labor pool. Wage inflation of 20–25% adds cost pressure, delaying rack rollouts vital to hyperscale capacity growth.
Escalating Copper Prices Inflating Cabling Costs
Copper cost spiked 15–20% in 2024, adding budget risk for GPU-dense racks that use triple the copper per cabinet. Although operators trial aluminum conductors for low-current paths, critical feeds still depend on copper, slowing Denmark data center rack market adoption when metal prices swing sharply.
*Our forecasts treat driver/restraint impacts as directional, not additive. The impact forecasts reflect baseline growth, mix effects, and variable interactions.
Segment Analysis
By Rack Size: Full Racks Dominate Enterprise Deployments
Full racks captured 70.72% of Denmark data center rack market share in 2025, highlighting the sector’s preference for standardized 42U and 48U footprints that simplify airflow modeling. The Denmark data center rack market size tied to full racks is forecast to expand at 18.64% CAGR as hyperscalers pack more GPUs per cabinet. Enterprises migrating from server rooms gravitate to half- and quarter-racks for branch offices, yet volume remains niche.
A second factor underpinning full-rack dominance is supply-chain efficiency: vendors concentrate production on high-volume SKUs, shortening lead times and reducing unit pricing. atNorth’s DEN02 colocation design standardizes on full racks to streamline project delivery atNorth. This strategy aids Denmark data center rack market penetration among multinational tenants needing predictable specifications across regions.


By Rack Height: 42U Standard Faces 48U Challenge
The 42U format held 54.63% share of the Denmark data center rack market size in 2025. However, 48U cabinets—offering 14% extra vertical capacity—are set to register 18.16% CAGR, driven by AI servers stacked with accelerator cards. Denmark’s robust floor-loading codes and effective liquid-cooling infrastructure mitigate risks linked to taller racks.
Manufacturers like Lenovo now qualify 48U frames for 4,000-pound loads, ensuring compatibility with GPU clusters. Operators adopting 48U gain better space economics on expensive Danish real estate, positioning this form factor as the next standard for the Denmark data center rack market.
By Rack Type: Enclosed Cabinets Lead Cooling Optimization
Closed cabinets own 75.58% of Denmark data center rack market share thanks to built-in airflow management essential for heat-reuse schemes. Chatsworth Products’ ZetaFrame system with hot-aisle containment exemplifies the shift toward enclosure-integrated cooling. Open-frame models remain in edge sites where ambient conditions are less controlled.
Closed designs help operators maintain inlet temperatures optimal for district-heating recovery, translating into additional revenue. Their higher upfront price becomes marginal once heat-buy-back income is modeled over a 15-year rack lifecycle, reinforcing adoption throughout the Denmark data center rack market.
By Data Center Type: Colocation Leads, Hyperscale Accelerates
Colocation centres delivered 58.05% of cabinet purchases in 2025, reflecting outsourcing trends among enterprises attracted by green power and permit simplicity. Hyperscale builds, though smaller in absolute numbers, will log a 20.14% CAGR to 2031 as cloud giants consolidate European AI clusters in Denmark.
Digital Realty’s Copenhagen campus offers turnkey connections to offshore-wind PPAs, encouraging tenants to deploy high-density cabinets without negotiating individual energy contracts. This value proposition sustains colocation leadership even as hyperscale growth inflates total Denmark data center rack market volume.
By Material: Steel Dominance Faces Aluminum Innovation
Steel remained the default, holding 74.62% share in 2025. Yet aluminum’s 19.11% projected CAGR signals a shift toward lighter alloys suitable for 4,000-pound GPU racks where floor-loading limits apply. nVent HOFFMAN’s move to aluminum frames for select SKUs highlights evolving customer requirements.
Aluminum’s embodied-carbon advantage also dovetails with Danish sustainability metrics. Recycling loops in the EU secure local feedstock, lowering scope-3 emissions for operators and giving aluminum an edge in future Denmark data center rack market tenders.
Geography Analysis
Copenhagen anchors the Denmark data center rack market with 25 facilities operated by 11 providers, reinforcing its status as EMEA’s 18th-largest hub. Grid reliability of 99.997% and proximity to trans-Nordic fiber routes make the capital an ideal landing zone for international workloads.
West Jutland is emerging as the next growth pole. Google’s Fredericia site leverages abundant offshore-wind capacity for carbon-free power, while atNorth selected Ølgod for a 250 MW campus that will export surplus heat to local greenhouses. Esbjerg’s first fully Danish-owned hyperscale project, scheduled for 2026, aims to scale from 10 MW to 200 MW and underscores regional decentralization.
Denmark’s integration into the Nordic power pool lets operators arbitrage surplus hydro or wind from Norway and Sweden, cushioning market participants against price spikes. At the same time, a nationwide district-heating grid covering 64.5% of homes drives selection of racks engineered for controlled heat exhaust, a unique requirement compared with other EU states. These intertwined energy and thermal networks differentiate the Denmark data center rack market from broader European peers.
Mordor Intelligence provides coverage of the data center rack market across other key regional markets, including Europe, Middle East, and South America, each with their regulatory frameworks and demand patterns. Detailed country-level analysis extends to Sweden, Belgium, Saudi Arabia, Brazil, Malaysia, and Japan incorporating local coverage and market participation, as required.
Competitive Landscape
Competition is moderately fragmented. Global conglomerates such as Eaton and Schneider Electric command strong positions in power management and turnkey enclosures yet must localize solutions to interface with district-heating loops and hydrogen-ready backup systems. Nordic specialists, including Rittal’s regional integrators and emerging Danish fabricators, leverage intimate knowledge of permit protocols and energy-reuse standards to win niche contracts.
Strategic moves skew toward sustainability. Schneider Electric’s 2024 purchase of Motivair added direct-to-chip liquid-cooling capability, essential for GPU racks exceeding 80 kW . Vertiv’s reference designs codified with NVIDIA simplify AI cluster deployment and align with Danish operators’ density targets. These initiatives elevate solution stickiness and expand service deals around lifecycle thermal management.
Market entrants targeting hydrogen fuel-cell backup leverage Denmark’s Power-to-X roadmap, which aims for 4–6 GW of electrolysis by 2030. Vendors able to integrate rack power distribution with fuel-cell stacks may carve out a premium segment, reshaping the Denmark data center rack market over the long term.
Denmark Data Center Rack Industry Leaders
Rittal GMBH & Co.KG
Schneider Electric SE
Vertiv Group Corp.
Eaton Corporation plc
Cabinet System A/S
- *Disclaimer: Major Players sorted in no particular order

Recent Industry Developments
- February 2025: Schneider Electric posted EUR 38.2 billion (USD 43.1 billion) revenue for FY 2024, citing double-digit data-center growth
- February 2025: Eaton reported USD 24.9 billion 2024 sales, with Electrical Americas up 17% on data-center demand
- January 2025: Microsoft allocated USD 80 billion for AI-enabled data-center buildouts, continuing Danish district-heating integration
- December 2024: atNorth revealed plans for a 250 MW DEN02 campus in Ølgod with full heat reuse


Research Methodology Framework and Report Scope
Market Definitions and Key Coverage
Our study defines the Denmark data center rack market as the sale of new, factory-built enclosures, cabinet, open-frame, and wall-mount that house servers, networking devices, and power or cooling attachments inside commercial data centers. Revenue is tracked at first sale in Denmark and converted to USD at the annual average rate.
Scope Exclusion: Secondary revenue such as installation labor, refurbishment of used racks, and aftermarket cable management kits are outside this definition.
Segmentation Overview
- By Rack Size
- Quarter Rack
- Half Rack
- Full Rack
- By Rack Height
- 42U
- 45U
- 48U
- Other Heights (?52U and Custom)
- By Rack Type
- Cabinet (Closed) Racks
- Open-Frame Racks
- Wall-Mount Racks
- By Data Center Type
- Colocation Facilities
- Hyperscale and Cloud Service Provider DCs
- Enterprise and Edge
- By Material
- Steel
- Aluminum
- Other Alloys and Composites
Detailed Research Methodology and Data Validation
Primary Research
Mordor analysts held structured calls with facility design engineers in Copenhagen, procurement heads at two hyperscale builds in Jutland, and regional sales managers from rack OEMs. Interviews clarified typical rack heights ordered for AI clusters, average selling price brackets, and near-term inventory plans, helping us reconcile secondary estimates and close data gaps across end-user cohorts.
Desk Research
We reviewed national energy statistics from the Danish Energy Agency, import-export data published by Statistics Denmark, rack density benchmarks from Uptime Institute surveys, product certification filings on the CE database, and Nordic trade association white papers on free-air economization. Annual reports and 10-Ks of leading enclosure manufacturers, as well as investor decks from colocation operators, supplied price and volume clues. Paid resources that our team accessed include D&B Hoovers for supplier financials and Dow Jones Factiva for deal tracking. These sources informed baseline demand, pricing corridors, and regulatory context. The sources listed are illustrative; many additional public and proprietary materials were consulted during validation.
Market-Sizing & Forecasting
A combined top-down and bottom-up framework is applied. National data center white space (m²) and power capacity (MW) pools are rebuilt from energy permits and building completions, then translated into rack counts using observed density shifts. Sampled ASP × volume roll-ups from five large suppliers provide a bottom-up cross-check. Key variables like new hyperscale floorspace, average rack density (kW), year-average steel price, renewable power tariff, heat recovery incentives, and import duty on frame steel feed a multivariate regression that projects value through 2030. Where vendor roll-ups underrun or overshoot the top-down total, proportional scaling is applied to align with validated demand indicators.
Data Validation & Update Cycle
Outputs undergo variance checks against shipment data, analyst peer review, and anomaly flags generated in our modeling template. Reports refresh every twelve months, with mid-cycle revisions if Denmark issues major energy pricing or tax changes. Before release, an analyst reruns the model with the latest inputs so clients receive the current view.
Credibility Anchor for Denmark Data Center Rack Estimates
Why Our Denmark Rack Baseline Commands Reliability
Published figures often differ because firms choose varying geographies, include services, or extrapolate from global averages.
The widest gaps stem from scope breadth (hardware only versus hardware and services), reliance on vendor surveys without local validation, exchange rate timing, and update frequency. Mordor's model ties rack counts directly to Denmark's permitted data center power, adjusts ASPs for local steel surcharges, and refreshes annually, minimizing drift.
Benchmark comparison
| Market Size | Anonymized source | Primary gap driver |
|---|---|---|
| USD 53.9 M (2025) | Mordor Intelligence | - |
| USD 70 M (2024) | Global Consultancy A | Includes installation services and uses vendor revenue surveys with no power capacity cross-check |
| USD 1.08 B (2023, Europe) | Regional Consultancy B | Aggregates 20 country region; no Denmark breakout; relies on historical rack width shipments for forecasts |
The comparison shows that when definitions widen or geography expands, numbers inflate rapidly. By centering on Denmark only hardware sales and corroborating both supply and demand signals, Mordor Intelligence delivers a balanced, traceable baseline decision makers can trust.


Key Questions Answered in the Report
What is the current value of the Denmark data center rack market?
The market is valued at USD 60.46 million in 2026 and is forecast to reach USD 107.56 million by 2031.
Which rack size is most popular in Denmark?
Full-rack configurations, particularly 42U and 48U, held 70.72% market share in 2025.
Why are 48U cabinets gaining traction?
AI workloads requiring 60-120 kW per rack drive demand for the extra 6U of vertical space, supporting an 18.16% CAGR for 48U units.
How does Denmark’s district heating influence rack choices?
Data centers can sell waste heat, so operators prefer closed-cabinet designs optimized for thermal capture to monetize up to 15% of operating costs.
Page last updated on:


