Dehumidifier Market Size and Share
Market Overview
| Study Period | 2020 - 2031 |
|---|---|
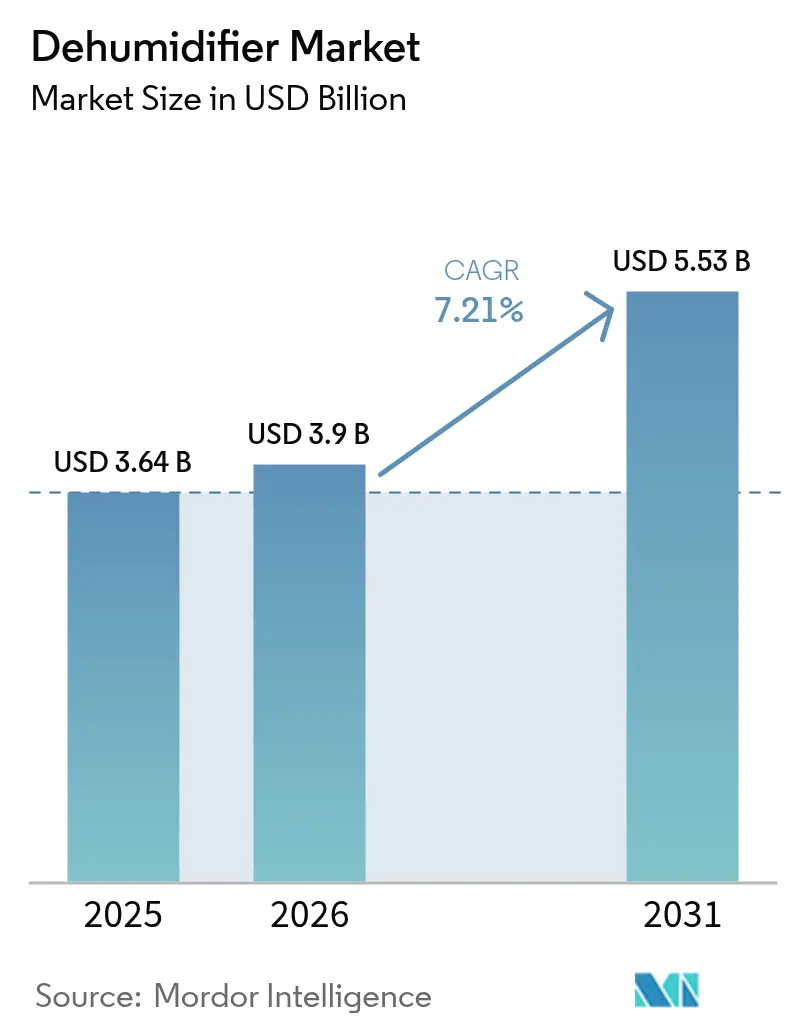
| Market Size (2026) | USD 3.9 Billion |
| Market Size (2031) | USD 5.53 Billion |
| Growth Rate (2026 - 2031) | 7.21% CAGR |
| Fastest Growing Market | Asia Pacific |
| Largest Market | North America |
| Market Concentration | Low |
Major Players *Disclaimer: Major Players sorted in no particular order Image © Mordor Intelligence. Reuse requires attribution under CC BY 4.0. | |
Dehumidifier Market Analysis by Mordor Intelligence
The dehumidifier market size is expected to grow from USD 3.64 billion in 2025 to USD 3.9 billion in 2026 and is forecast to reach USD 5.53 billion by 2031 at 7.21% CAGR over 2026-2031. Demand reflects two parallel forces that shape the dehumidifier market: higher efficiency expectations under new labeling and test procedures, and rising indoor air quality awareness in humid geographies. North America benefits from ENERGY STAR Version 6.0 adoption and refrigerant transition activity under the AIM Act, while Asia-Pacific accelerates on housing density and precision manufacturing needs. Supply chains continue to normalize after the 2025 refrigerant cylinder tightness, although component localization and code updates still influence lead times in several markets. The shift toward online distribution is steady as platforms embed better product guidance and faster delivery, yet in-store selection remains important for mid to large capacity purchases that rely on hands-on evaluation and contractor support.
Key Report Takeaways
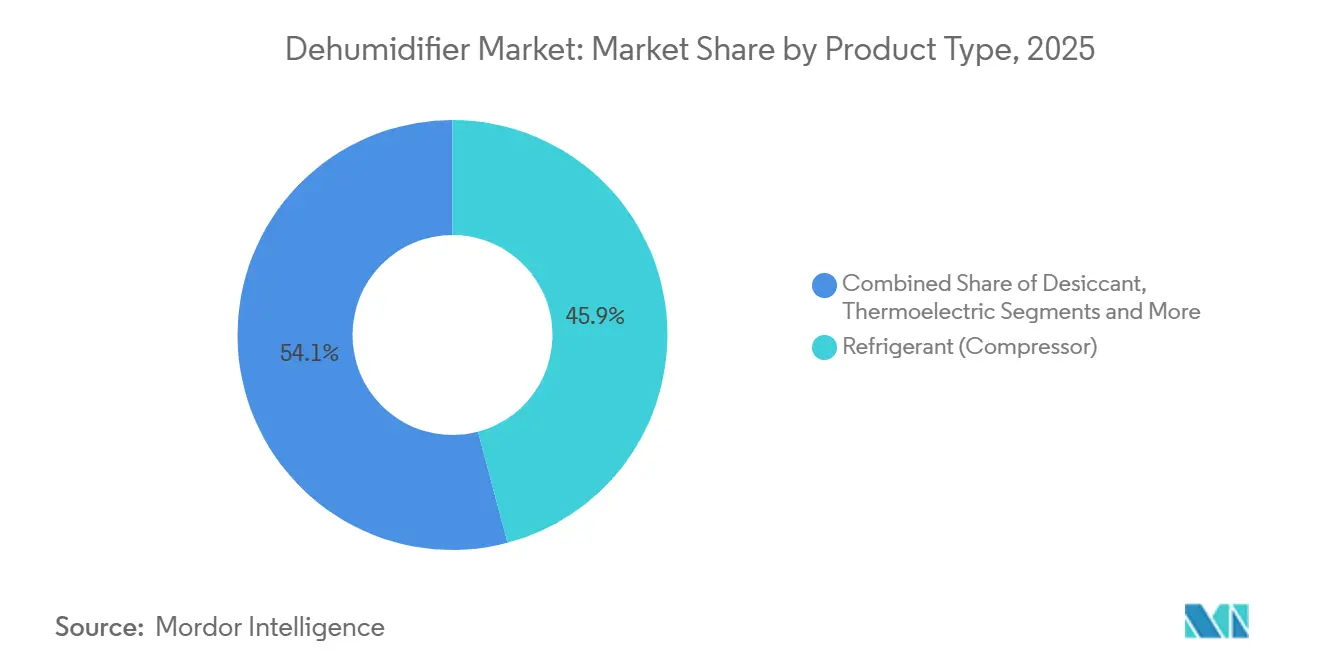
- By product type, refrigerant compressor dehumidifiers led with 45.88% of the dehumidifier market share in 2025, and desiccant systems are projected to expand at a 7.58% CAGR through 2031.
- By end-user, industrial applications held a 41.65% share in 2025, while residential is forecast to advance at a 7.95% CAGR through 2031.
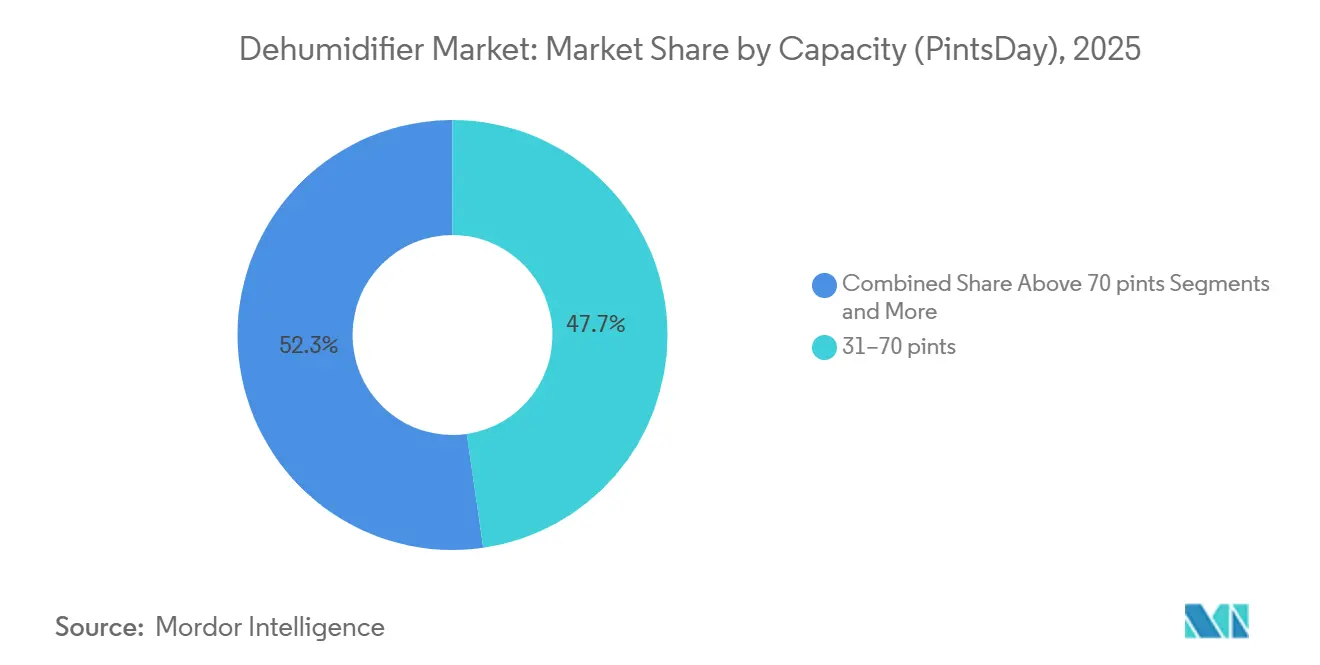
- By capacity, the 31-70 pints-per-day segment accounted for 47.72% of sales in 2025, and the ≤30-pint category is set to grow at 8.31% CAGR through 2031.
- By distribution channel, offline channels commanded a 66.84% share in 2025, while online e-commerce is expected to grow at a 9.08% CAGR through 2031.
- By geography, North America held a 35.89% share in 2025, with Asia-Pacific projected as the fastest-growing region at a 9.85% CAGR over 2026-2031.
Note: Market size and forecast figures in this report are generated using Mordor Intelligence’s proprietary estimation framework, updated with the latest available data and insights as of 2026.
Global Dehumidifier Market Trends and Insights
Drivers Impact Analysis*
| Driver | (~) % Impact on CAGR Forecast | Geographic Relevance | Impact Timeline |
|---|---|---|---|
| Energy-efficiency standards and updated test procedures accelerate product refresh | +1.2% | North America, Europe (ENERGY STAR, European Union Ecodesign directives) | Short term (≤ 2 years) |
| IAQ and mold prevention awareness boost residential adoption | +1.5% | Global, with concentration in humid climates (North America, Southeast Asia, Asia-Pacific Southeast) | Medium term (2-4 years) |
| Industrial humidity control needs sustained leadership in process industries | +0.9% | Global, emphasis on pharmaceutical hubs (India, European Union, North America) | Long term (≥ 4 years) |
| Asia-Pacific construction and manufacturing expansion widens addressable demand | +2.1% | Asia-Pacific core (China, India, ASEAN), spillover to the Middle East | Medium term (2-4 years) |
| Battery gigafactory dry rooms and advanced manufacturing lift desiccant demand | +1.3% | Asia-Pacific (China, South Korea, Japan), North America, Europe | Long term (≥ 4 years) |
| Global HFC phasedown triggers refrigerant transitions and replacement cycles | +0.8% | Global, led by North America (EPA AIM Act), Europe (F-Gas Regulation) | Short term (≤ 2 years) |
| Source: Mordor Intelligence | |||
Energy-Efficiency Standards and Updated Test Procedures Accelerate Product Refresh
The United States Department of Energy withdrew proposed energy conservation standards for dehumidifiers in March 2025, which put near-term mandatory redesigns on hold and kept capital retooling limited for 2026 production cycles[1]Appliance Standards Staff, “Appliance and Equipment Standards Program,” U.S. Department of Energy, energy.gov. ENERGY STAR Version 6.0 took effect on October 1, 2025, with higher Integrated Energy Factor thresholds and updated labeling expectations, which shifted premium positioning toward models with best-in-class efficiency[2]ENERGY STAR Program Staff, “Dehumidifiers Version 6.0 Specification,” U.S. Environmental Protection Agency, energystar.gov. Manufacturers keep a conservative compliance buffer on nameplate ratings to reduce test variance risk, a practice that aligns engineering focus on coil geometry, fan systems, and defrost control. These dynamics raise the bar for value models as retailers and e-commerce filters surface ENERGY STAR listings first, a factor that reinforces brand trust in the dehumidifier market. Marketplace oversight has also tightened, with platforms and retailers asking for clear evidence of third-party safety certifications before stocking or fulfilling orders. The combined effect is a steady refresh cycle that favors compliant refrigerants, verifiable efficiency, and transparent certifications across North America and Europe.
IAQ and Mold Prevention Awareness Boosts Residential Adoption
The United States EPA guidance to maintain indoor relative humidity between 30% and 50% to limit mold growth has become a common reference point in home maintenance and renovation decisions. Health guidance in 2024 reinforced the link between dampness, respiratory symptoms, and allergic responses, which helped extend humidity control beyond basements to whole-home solutions in humid regions. Residential adoption is rising faster than the historical norm, as homeowners in hot and humid climates prioritize moisture control along with ventilation and filtration to address indoor air quality holistically. Contractors increasingly bundle dehumidifiers with smart thermostats and leak detection to support preventive maintenance and insurance compliance, which strengthens installed performance and service attachment in the dehumidifier market. Updated product safety and labeling rules in the United States and the European Union promote clearer consumer guidance at the point of sale and in online listings. This clarity helps consumers compare efficiency, moisture removal, and safety features more easily, which in turn supports confident upgrades in residential settings.
Industrial Humidity Control Needs Sustain Leadership in Process Industries
Pharmaceutical manufacturing requires controlled temperature and humidity to protect hygroscopic ingredients and to remain in compliance with current good manufacturing practice rules under 21 CFR Part 211, which keeps industrial-grade dehumidification a critical utility in sterile production. Food processing and electronics assembly also rely on targeted moisture ranges to protect quality, throughput, and device reliability, which sustains diverse demand in the dehumidifier market across large plants. In these environments, desiccant wheels and heat recovery features help deliver stable dew points while improving energy productivity in continuous-duty applications. Data center and semiconductor cleanrooms have also increased the focus on precise humidity bands and dew point control for uptime and yield, a need that supports advanced desiccant designs with high heat recovery effectiveness. Industrial buyers evaluate life-cycle cost under recognized standards for performance and safety, including UL and ISO requirements that guide selection across global projects. As more factories modernize with smart monitoring, predictive maintenance, and connected controls improve uptime and service scheduling, which is a positive for the total cost of ownership.
Asia-Pacific Construction and Manufacturing Expansion Widens Addressable Demand
Asia-Pacific posts the fastest growth outlook over 2026 to 2031, driven by dense urban housing, high humidity in coastal cities, and a growing base of precision manufacturing that requires humidity control. Urban apartments and compact homes in major cities value small footprints and quiet operation, which fuels the rise of compact portable units in the dehumidifier market. Regional public and private investments in cleanrooms and advanced manufacturing expand opportunities for high-performance desiccant systems that can deliver ultra-low dew points. Standards and codes across key Asia-Pacific markets encourage energy-conscious designs and verified safety performance, which steers demand toward brands with compliant refrigerants and proven test data. Combined, these factors expand installation opportunities across residential, commercial, and industrial projects during the forecast period, while supply footprints continue to localize to serve lead time and compliance needs. This local manufacturing and service capacity helps reduce logistics costs and stabilizes after-sales support for installed bases in the region.
Restraints Impact Analysis*
| Restraint | (~) % Impact on CAGR Forecast | Geographic Relevance | Impact Timeline |
|---|---|---|---|
| Compliance costs and performance tradeoffs from tighter efficiency standards | -0.6% | North America, Europe (ENERGY STAR, DOE, European Union Ecodesign) | Short term (≤ 2 years) |
| Refrigerant transition constraints and supply quotas add redesign complexity | -0.9% | Global, concentrated in North America, Europe | Short term (≤ 2 years) |
| Data center humidity setpoint relaxation reduces the need for aggressive dehumidification | -0.3% | Global enterprise data centers, counterbalanced by AI and hyperscale precision needs | Medium term (2-4 years) |
| Product safety recalls and retailer risk controls weigh on consumer sell-through | -0.5% | North America, Europe | Medium term (2-4 years) |
| Source: Mordor Intelligence | |||
Compliance Costs and Performance Tradeoffs from Tighter Efficiency Standards
The decision to halt new federal minimum efficiency rules for dehumidifiers in 2025 avoided an immediate wave of mandatory redesign expenses, yet the voluntary ENERGY STAR Version 6.0 threshold remains a practical benchmark that shapes product roadmaps. Industry feedback has emphasized that tested value protocols require added design margin to ensure compliant results in witness testing and market surveillance, which can reduce flexibility in cost-sensitive trims. Platform conversions that align refrigerant updates with efficiency improvements concentrate engineering resources on coils, compressors, and controls, which adds development time in the near term. The cost to qualify and certify new models increases when manufacturers add safety features and labels for A2L refrigerants under accepted standards. Retailers and e-commerce distributors have responded with stricter documentation checks before placement and fulfillment, which lengthens time to shelf for brands without established compliance workflows in the dehumidifier market[3]Policy and Guidance Team, “Business Education Resources,” U.S. Consumer Product Safety Commission, cpsc.gov. These near-term frictions moderate rollout speed for lower-priced tiers even as higher efficiency trims move forward for premium buyers.
Refrigerant Transition Constraints and Supply Quotas Add Redesign Complexity
United States refrigerant allowances and phasedown schedules under the AIM Act guide supply availability for lower GWP gases and drive planning for cylinder production and distribution. In 2025, select refrigerants encountered cylinder shortages, which pushed some compliant equipment deliveries later into the year and raised price pressure in several categories. Engineering teams have adjusted system designs to meet A2L safety requirements, including sensor strategies and electrical protections aligned with UL and related standards. The transition has also required contractor training and local permitting familiarity, which varies by jurisdiction during the early stages of code adoption. Because legacy platforms are not retrofit candidates for A2L refrigerants, the resulting product swaps and platform updates flow into the installed base over time in the dehumidifier market. As allocations tighten in future years, brands with diversified sources and inventory discipline can reduce volatility in their launch calendars.
*Our forecasts treat driver/restraint impacts as directional, not additive. The impact forecasts reflect baseline growth, mix effects, and variable interactions.
Segment Analysis
By Product Type: Desiccant Gains as Battery Dry Rooms Demand Ultra-Low Dew Points
Desiccant dehumidifiers are forecast to grow at a 7.58% CAGR from 2026 to 2031, outpacing the overall market as ultra-low dew point requirements expand in battery cell and advanced manufacturing projects in the dehumidifier market. Refrigerant compressor dehumidifiers led with 45.88% of the dehumidifier market share in 2025 due to strong adoption in residential and light commercial environments that target mid-range relative humidity levels. Thermoelectric units retain a small niche for very quiet and compact use cases, while hybrid configurations that combine refrigerant pre-cooling with desiccant polishing serve applications that need precision bands. Battery and semiconductor projects rely on desiccant technology because it can achieve very low dew points with strong heat recovery in regeneration, which maintains process stability and reduces total energy intensity. In residential and light commercial settings, refrigerant platforms continue to deliver value at mid to high moisture loads with updated A2L refrigerants and improved controls. Across product categories, safety certifications and published lab performance carry greater weight in channel selection as retailers and e-commerce platforms filter listings with energy and safety flags.
Residential and light-commercial buyers focus on ENERGY STAR labels and quiet operation, trends that keep compressor-based models on shopping lists for basements, bedrooms, and crawl spaces. As refrigerant transitions proceed, models that combine safer charge sizes, proven leakage safeguards, and robust detection align with updated codes, which aid adoption at retail and in contractor channels[4]Standards & Testing Team, “Standards and Certifications,” UL Solutions, ul.com. The dehumidifier market continues to segment by performance band and application, a pattern that allows each technology to grow in its best-fit use cases.


By End-User: Residential Adoption Accelerates Despite Industrial's Larger Installed Base
Industrial end users held a 41.65% share in 2025 as plants and process facilities maintained controlled humidity to protect product quality and uptime in the dehumidifier market. Residential demand is advancing faster with a 7.95% CAGR outlook through 2031 as households in humid regions maintain indoor relative humidity between 30% and 50% to limit mold and improve comfort. Contractors and insurers increasingly view moisture control as part of whole-home risk management, which increases attachment rates for connected humidity monitoring and service. Commercial environments such as retail and hospitality apply targeted dehumidification for comfort and asset protection, and some sites use energy recovery to improve efficiency. Data centers that operate within broad humidity envelopes have less dehumidifier runtime than in the past, although precision zones for AI workloads remain a steady niche.
The dehumidifier industry supports a wide spectrum of needs that range from GMP-compliant rooms in pharma to seasonal dampness in homes, which explains the divergence in long-term growth between industrial and residential lines. In factories and cleanrooms, purchases are driven by standards, audits, and uptime goals that reward robustness and documented performance. In residential use, risk awareness, easy installation, and app-based monitoring matter most, which keeps refresh cycles steady as ENERGY STAR labeling pushes efficiency higher. Battery dry rooms remain a specialized industrial niche with significant energy sensitivity, which sustains demand for advanced desiccant designs with high heat recovery. This mix ensures the dehumidifier market grows across multiple verticals, even as end-user priorities differ.
By Capacity (Pints/Day): Compact Units Surge as Urbanization Drives Space Efficiency
The 31-70 pints-per-day segment held 47.72% share of sales in 2025, a balance that reflects the sweet spot for home basements, crawl spaces, and light commercial spaces in the dehumidifier market. The ≤30-pint category is the fastest-growing with an 8.31% CAGR outlook through 2031, driven by urban apartments, smaller room footprints, and preference for quiet operation in sleeping spaces. Models at the low end of the capacity range combine compact form factors with improved efficiency under updated test procedures. Mid-capacity units remain the default for broad household uses due to flexibility and robust availability in-store and online. Large capacity systems support restoration, warehousing, and whole-home ducted installations where contractor engagement is common.
The dehumidifier market size associated with 31-70 pints-per-day units reflects strong replacement demand, while compact units gain share on convenience and price points. ENERGY STAR Version 6.0 thresholds vary by capacity class, which helps consumers compare models based on moisture removal and energy use in a consistent way. Retail associates and online product pages that demonstrate expected moisture removal at typical room conditions help educate buyers who are deciding between 30-pint and mid-capacity choices. For large systems, installed performance depends on correct sizing, ducting, and condensate management, which underlines the role of qualified contractors. These dynamics will continue to segment the category by capacity as housing stock and commercial footprints evolve.
By Distribution Channel: E-Commerce Outpaces as AI Recommendations and Speed Delivery Shift Buyers Online
Offline or in-store channels held a 66.84% share in 2025 as hands-on evaluation and immediate pickup remained important for many household and contractor purchases in the dehumidifier market. Online e-commerce is the fastest-growing segment with a 9.08% CAGR expected through 2031, supported by better product discovery, reviews, and fast delivery. Retailers and platforms have tightened safety and certification verification requirements, which strengthens consumer trust while raising documentation expectations for new SKUs. Brands with direct-to-consumer programs and stronger digital content on installation and troubleshooting improve conversion during peak humidity seasons. In parallel, large-format and contractor-grade models continue to sell through in-store pro desks where project support and bundled services are valued.
Omnichannel behavior is common, with buyers researching online and purchasing in-store or using click-and-collect when fast access matters. Platforms that highlight ENERGY STAR certification, refrigerant type, and expected moisture removal help consumers select the right capacity class, which reduces returns and improves satisfaction. Safety and recall communication have improved in online flows, including notification tools and clearer instructions for corrective actions when needed. These changes create a stronger baseline for the dehumidifier market as digital interfaces continue to evolve. Over time, the balance between convenience, compliance clarity, and post-sale service will determine channel mix across regions.
Geography Analysis
North America maintained a 35.89% share in 2025, with growth projected at a 5.5% CAGR from 2026 to 2031, supported by ENERGY STAR Version 6.0 adoption and refrigerant transition activity under the AIM Act in the dehumidifier market. Retailers managed down R 410A inventories ahead of the 2025 manufacturing cutoff while ensuring compliant listings with stronger safety and labeling checks. Whole-home installations by HVAC contractors continue to grow in coastal and flood-prone regions, where moisture management supports property protection and system efficiency. Canada tracks similar efficiency and safety practices with additional attention to defrost strategies in colder climates, and Mexico’s construction pipeline sustains import demand for portable units. The policy environment shapes specification choices, and broader state code adoption for A2L refrigerants simplifies installs and service training over time.
Asia-Pacific is the fastest-growing region with a 9.85% CAGR outlook for 2026 to 2031 as densifying cities, coastal humidity, and precision manufacturing expand the dehumidifier market. Compact designs gain traction in apartments and smaller homes, while high-spec desiccant systems address ultra-low dew point needs in cleanrooms. As regional production footprints grow, lead times improve, and products are tailored to local safety and performance standards. Battery manufacturing projects across the region require stringent humidity control, which keeps desiccant demand resilient through the forecast window. A larger installed base of smart-home devices also encourages connected dehumidifier adoption in urban markets.
Europe’s outlook reflects steady growth over 2026 to 2031, supported by the European Union F-Gas framework and the General Product Safety Regulation, which together elevate refrigerant and product safety expectations. Space-constrained apartments in several countries favor compact units, while passive house and energy recovery practices integrate dehumidification into ventilation designs. Manufacturing expansion in selected cleanroom segments supports high-performance desiccant systems with strong heat recovery. Beyond Europe, growth in the Middle East and parts of Africa is supported by commercial build-out and a focus on comfort and asset protection in high-humidity environments, while Latin America’s trend reflects humidity-driven purchases in large urban centers. These patterns diversify geographic momentum for the dehumidifier market through 2031.


Competitive Landscape
Competition remains highly fragmented with many brands competing on efficiency, refrigerant compliance, connected features, and safety certification clarity in the dehumidifier market. Brands that bring forward transparent ENERGY STAR data, A2L-ready designs, and clear installation guidance see stronger placement with retailers and e-commerce platforms. Companies continue to invest in North American and European capacity to shorten lead times and comply with local rules for energy and safety labeling. As distribution modernizes, digital content and training for installers enhance conversion, especially for whole-home systems and higher-capacity models.
Product strategies align with three themes: verified energy performance, low GWP refrigerants, and connected controls. GE Appliances introduced an inverter-driven portable AC line with integrated dehumidification that emphasizes quiet operation and low GWP refrigerant, which mirrors the broader push toward low noise and safer refrigerants. Munters expanded its United States manufacturing with a large facility supported by onsite solar, streamlined Americas operations, and continued to secure multi-million-dollar orders for ultra-dry room solutions. Santa Fe and Quest moved their lines to R 454B during 2024, which helped align contractor-installed whole-home solutions with new refrigerant guidance. These moves all fit the market’s direction toward better documented safety, higher efficiency, and more precise humidity control.
Channel execution has become a differentiator as platforms increase compliance checks and recall communications while retailers refine category management around ENERGY STAR and safety filters. Vendors that publish clear specs on moisture removal, noise, integrated controls, and refrigerant type see better search placement and lower return rates online. Local production and regional service footprints reduce lead times and support better installed performance in large projects, especially in industrial and data center segments that emphasize up time. Given these conditions, the dehumidifier market favors brands that can document compliance end-to-end from refrigerant sourcing and component design to independent lab testing and field service readiness.
Dehumidifier Industry Leaders
Haier Smart Home
LG Electronics
Whirlpool Corporation
Honeywell International
Munters AB
- *Disclaimer: Major Players sorted in no particular order

Recent Industry Developments
- March 2026: Munters Group launched the MX3 dehumidifier series with advanced desiccant rotors and high heat recovery for sub-10% RH applications in pharmaceutical cleanrooms and semiconductor fabs.
- May 2025: Munters opened a large facility in Amesbury, Massachusetts, with rooftop solar and integrated operations to reduce lead times for data center and battery manufacturing customers.
- May 2025: The United States Department of Energy proposed rescinding amended energy conservation standards for non-whole-home dehumidifiers, which deferred near-term redesign costs while voluntary ENERGY STAR thresholds remained the market signal.
- April 2025: GE Appliances launched a dual-hose inverter portable AC line with built-in dehumidification using a low GWP refrigerant and optimized noise profile for residential use.


Research Methodology Framework and Report Scope
Market Definitions and Key Coverage
Our study defines the global dehumidifier market as all newly manufactured, electrically powered devices, portable or fixed, that actively extract moisture from ambient air by means of refrigerant coils, desiccant wheels, thermoelectric (Peltier) modules, or hybrid assemblies. Values are expressed in USD at manufacturer selling price, net of discounts and taxes.
Scope exclusion: Units embedded in large-tonnage HVAC chillers, short-term rental services, and passive moisture sachets are outside our frame.
Segmentation Overview
- By Product Type
- Refrigerant (Compressor)
- Desiccant
- Thermoelectric (Peltier)
- Hybrid / Others
- By Capacity (Pints/Day)
- ≤30
- 31–70
- Above 70
- By End-user
- Residential
- Commercial
- Industrial
- By Distribution Channel
- Offline / In-store
- Online / E-commerce
- By Geography
- North America
- Canada
- United States
- Mexico
- South America
- Brazil
- Peru
- Chile
- Argentina
- Rest of South America
- Europe
- United Kingdom
- Germany
- France
- Spain
- Italy
- BENELUX (Belgium, Netherlands, Luxembourg)
- NORDICS (Denmark, Finland, Iceland, Norway, Sweden)
- Rest of Europe
- Asia-Pacific
- India
- China
- Japan
- Australia
- South Korea
- South-East Asia
- Rest of Asia-Pacific
- Middle East & Africa
- United Arab Emirates
- Saudi Arabia
- South Africa
- Nigeria
- Rest of Middle East & Africa
- North America
Detailed Research Methodology and Data Validation
Primary Research
We conduct structured interviews and short surveys with HVAC distributors, facility managers, e-commerce category heads, and component suppliers across North America, Europe, and APAC. These conversations validate moisture-removal capacity mix, average selling prices, retrofit versus new-build demand, and emerging standards that secondary data alone cannot capture.
Desk Research
We start by mapping demand drivers and supply concentrations through open datasets such as UN Comtrade shipment codes, US DOE appliance efficiency databases, Eurostat PRODCOM production files, and customs-level HS-code splits for key exporting nations. Trade association white papers from bodies such as AHAM and China Home Appliance Association help our analysts spot capacity shifts and technology pivots. Quarterly 10-K filings, investor decks, and reputable press archives round out pricing and channel cues. Paid sources, D&B Hoovers for company revenues and Dow Jones Factiva for deal flow, let us benchmark top vendor footprints. This list is illustrative; many additional references are tapped for context, clarification, and cross-checks.
Market-Sizing & Forecasting
A top-down reconstruction of global factory shipments, triangulating production, import, and export volumes, builds the first market pool, which we then reconcile with sampled bottom-up roll-ups of leading supplier revenues and channel checks. Key modeling variables include average pint-per-day capacity sold, regional housing starts in humid zones, data-center floor-space additions, and energy-efficiency mandate timelines; each is forecast by multivariate regression, and forecasts are sense-checked with expert consensus. Where supplier disclosures are partial, sampled ASP × volume ranges are interpolated to patch gaps before weights are applied to segment splits.
Data Validation & Update Cycle
Outputs run through variance screens against historical ratios, peer signals, and price-volume elasticity rules. An analyst panel reviews anomalies, after which the model is locked. Reports refresh every twelve months, with off-cycle updates triggered when material events, such as major efficiency standards or flood-induced demand spikes, occur.
Why Mordor's Dehumidifier Baseline Commands Reliability
Published estimates often diverge; scope choices, exchange-rate fixes, and refresh cadence explain much of the spread.
Key gap drivers include whether thermoelectric table-top units are counted, how rental fleet turnover is booked, the aggressiveness of price-deflation curves, and the year each firm last re-benchmarked supplier capacities.
Benchmark comparison
| Market Size | Anonymized source | Primary gap driver |
|---|---|---|
| USD 3.64 B | Mordor Intelligence | - |
| USD 3.61 B | Global Consultancy A | Skips thermoelectric units and relies mainly on 2023 shipment ratios |
| USD 4.44 B | Trade Journal B | Applies higher ASPs drawn from retail tags, inflating value base |
| USD 5.60 B | Industry Association C | Bundles rental revenues and whole-house HVAC systems into scope |
The comparison shows how Mordor Intelligence, by anchoring on verifiable factory output and carefully filtering ancillary revenue streams, delivers a balanced, transparent baseline that decision-makers can trace back to clear variables and repeatable steps.


Key Questions Answered in the Report
What is the dehumidifier market growth outlook for 2031?
The dehumidifier market size is projected to reach USD 5.53 billion by 2031 at a 7.21% CAGR from 2026 to 2031.
Which region will grow fastest in the dehumidifier market from 2026 to 2031?
Asia-Pacific is the fastest-growing region with a 9.85% CAGR outlook, supported by dense housing, coastal humidity, and precision manufacturing expansion.
Which product types lead to demand in the dehumidifier market today?
Refrigerant compressor units lead by share for general household and light commercial uses, while desiccant systems grow fastest where ultra-low dew points are required.
How are efficiency rules and labels affecting purchasing in the dehumidifier market?
ENERGY STAR Version 6.0 has raised performance thresholds and improved labeling clarity, which guides buyers toward verified high-efficiency models in stores and online.
What role do refrigerant rules play in the dehumidifier market?
The United States AIM Act phased down shifted designs to lower GWP refrigerants such as R‑454B and R‑32, which influences availability, pricing, and safety requirements in new models.
Where are the main application hotspots for advanced dehumidification?
Battery cell dry rooms, select semiconductor and data center zones, and regulated pharmaceutical environments are key hotspots for advanced desiccant solutions.
Page last updated on:


