Water Purifier/Filter Market Size and Share
Market Overview
| Study Period | 2020 - 2031 |
|---|---|
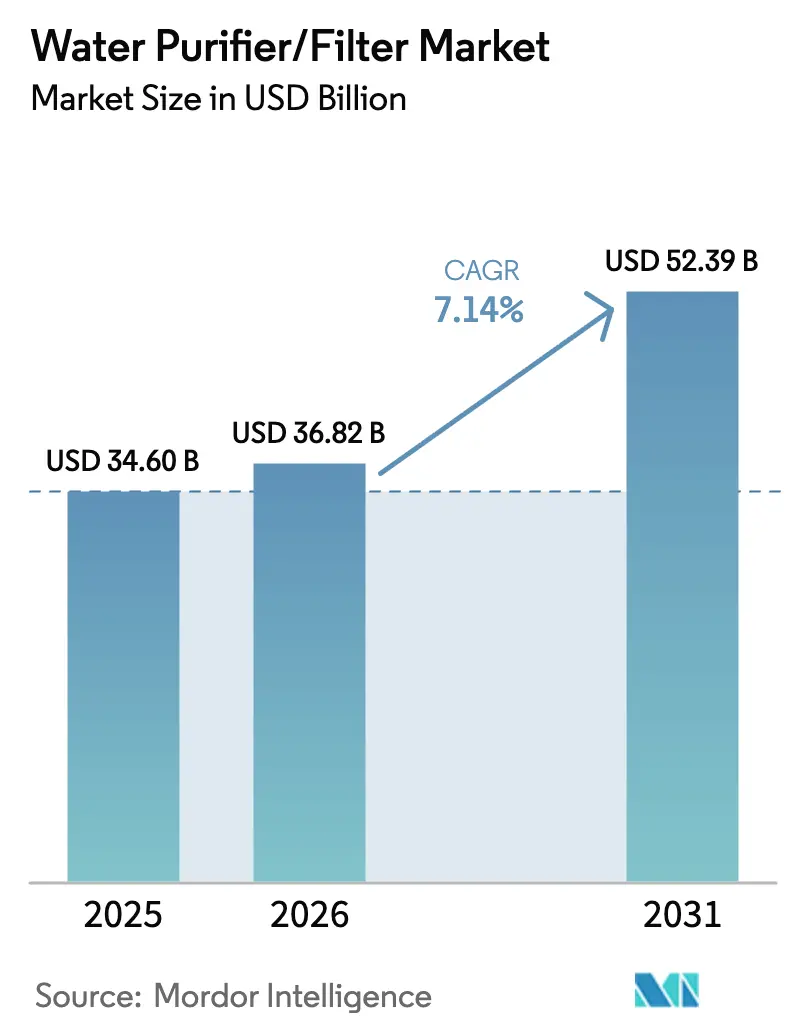
| Market Size (2026) | USD 36.82 Billion |
| Market Size (2031) | USD 52.39 Billion |
| Growth Rate (2026 - 2031) | 7.14% CAGR |
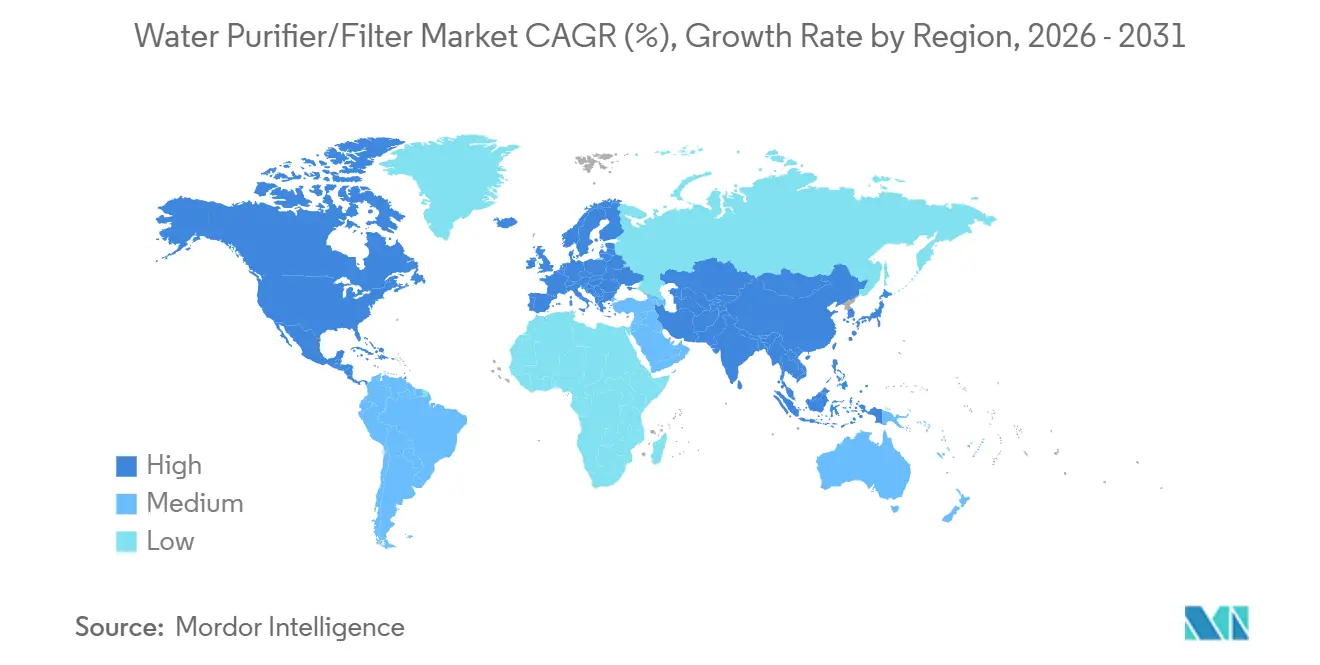
| Fastest Growing Market | Middle East and Africa |
| Largest Market | Asia Pacific |
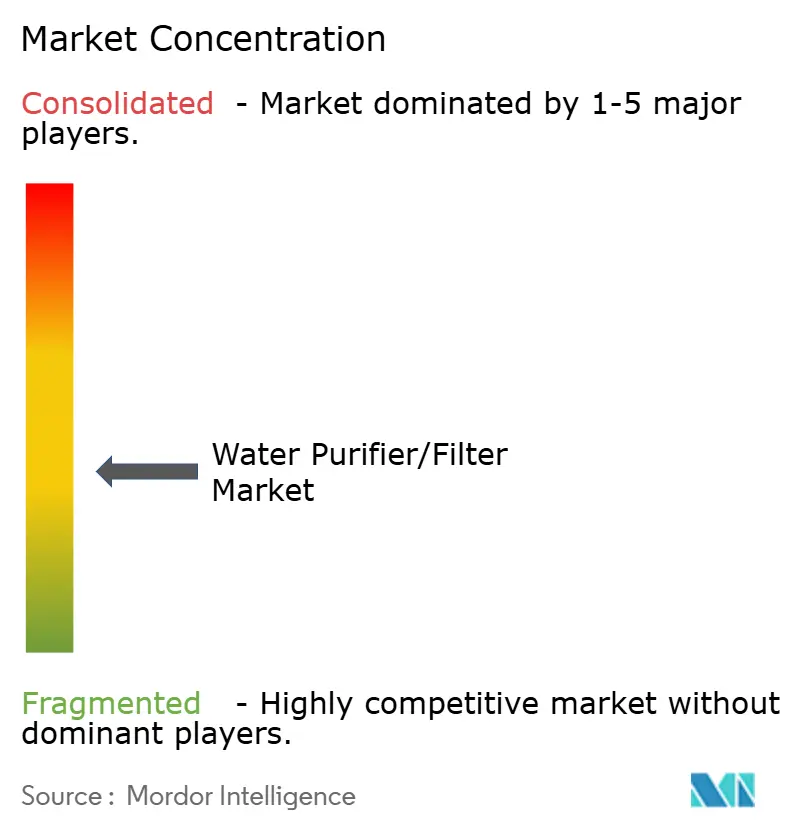
| Market Concentration | Medium |
Major Players *Disclaimer: Major Players sorted in no particular order Image © Mordor Intelligence. Reuse requires attribution under CC BY 4.0. | |
Water Purifier/Filter Market Analysis by Mordor Intelligence
The water purifier/filter market size was valued at USD 34.60 billion in 2025 and is estimated to grow from USD 36.82 billion in 2026 to reach USD 52.39 billion by 2031, at a CAGR of 7.14% during the forecast period (2026-2031). The growth profile is shaped by widening regulatory actions against persistent contaminants, heightened awareness of microplastics and pharmaceutical residues in drinking water, and government-led service expansion in underserved regions[1]European Commission, “Drinking Water Directive and Microplastics Methodology,” European Commission, europa.eu. A persistent gap in safely managed drinking water continues to stimulate adoption of point-of-use and point-of-entry systems, particularly in emerging economies where public networks are still stabilizing. Technology differentiation now focuses on higher recovery membranes, certified PFAS reduction, and UV-LED platforms, while connected features and predictive maintenance are sharpening engagement and lifetime value in consumer and enterprise segments. In parallel, ESG commitments in workplaces and hospitality settings are funneling demand into bottle-less dispensers that reduce plastic waste and support emissions reporting. Policy support and funding channels in the United States, the European Union, India, and selected GCC states are reinforcing infrastructure investments and standards that normalize advanced filtration at the municipal level, which in turn validates household adoption.
Key Report Takeaways
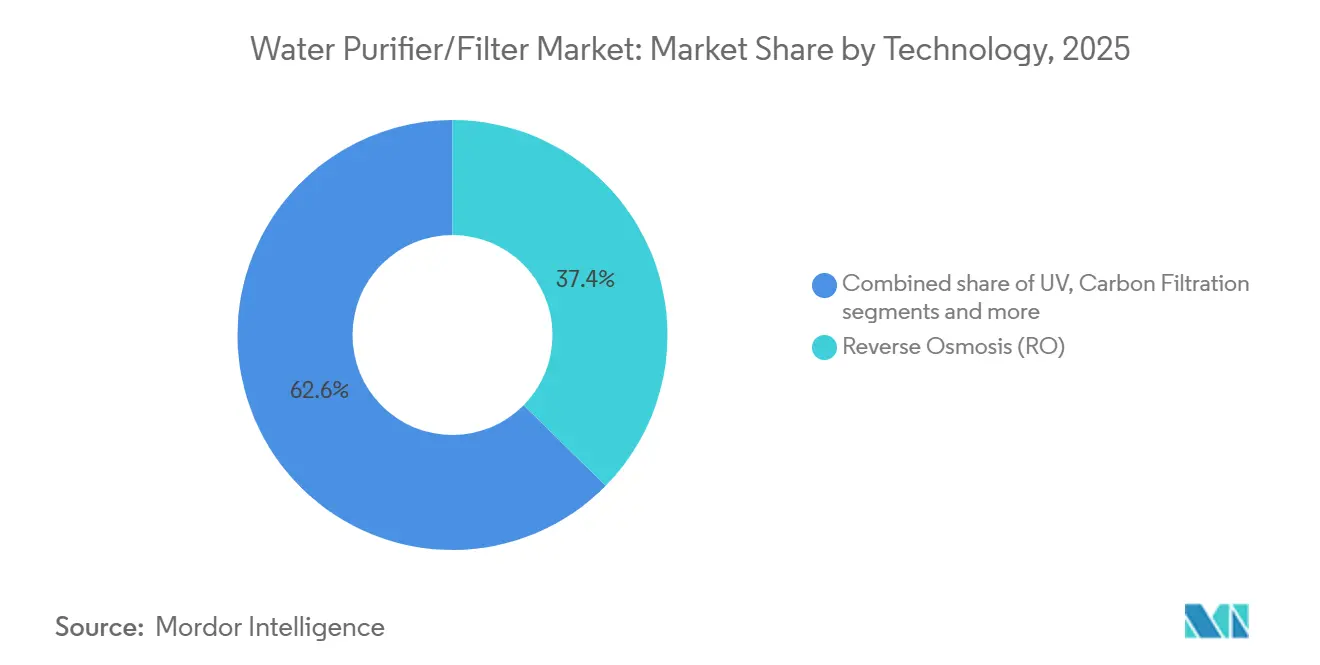
- By technology, reverse osmosis led with 37.37% market share in 2025, while UV advanced at an 8.76% CAGR through 2031.
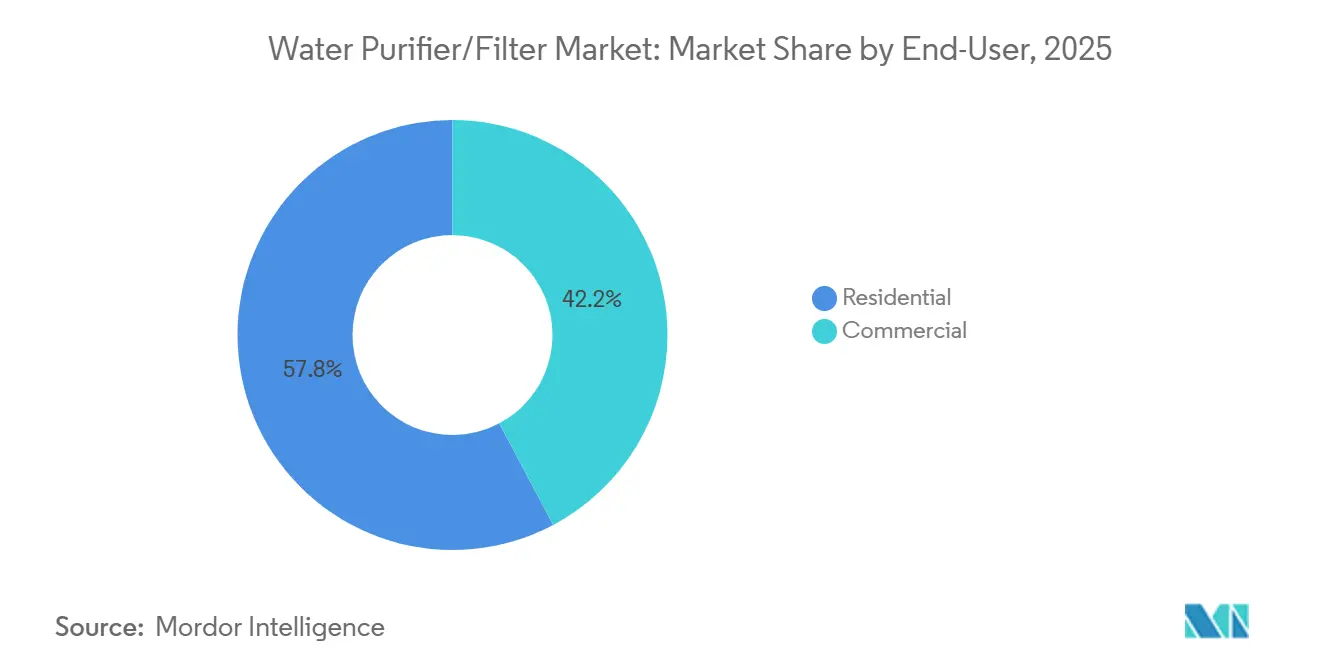
- By end-user, residential accounted for a 57.76% market share in 2025, while commercial recorded the highest growth at a 7.89% CAGR through 2031.
- By distribution channel, multi-brand stores held a 38.35% market share in 2025, while online posted the fastest 9.87% CAGR through 2031.
- By geography, Asia-Pacific captured 43.74% of the water purifiers market size in 2025, and the Middle East and Africa are projected to expand at a 7.49% CAGR through 2031.
Note: Market size and forecast figures in this report are generated using Mordor Intelligence’s proprietary estimation framework, updated with the latest available data and insights as of January 2026.
Global Water Purifier/Filter Market Trends and Insights
Drivers Impact Analysis*
| Driver | (~) % Impact on CAGR Forecast | Geographic Relevance | Impact Timeline |
|---|---|---|---|
| Deteriorating Potable Water Quality and Increasing Water-Borne Diseases | +2.2% | Global, most acute in South Asia, Sub-Saharan Africa, and fragile contexts | Medium term (2-4 years) |
| Government Incentives and Mandates for Safe Drinking Water | +1.9% | APAC (India, China), selected MEA nations (Saudi Arabia, UAE) | Short term (≤ 2 years) |
| Urbanization Across APAC Driving Residential Demand | +1.6% | APAC core (India, China, Southeast Asia), spill-over to MEA | Long term (≥ 4 years) |
| Smart and IoT-Enabled Purifiers Creating Recurring Revenue Models | +1.2% | North America, Europe, urban APAC hubs (Seoul, Tokyo, Shanghai) | Medium term (2-4 years) |
| Microplastic Contamination Fueling Demand for Premium Filtration Solutions | +1.0% | Global, with early adoption in North America and EU driven by awareness campaigns | Medium term (2-4 years) |
| Corporate ESG Commitments Supporting Adoption of Bottle-Less POU Dispensers | +1.1% | North America, Europe, APAC multinationals | Short term (≤ 2 years) |
| Source: Mordor Intelligence | |||
Deteriorating Potable Water Quality and Increasing Water-Borne Diseases
Deteriorating source water quality and gaps in municipal treatment capacity continue to raise health risks, which directly increases the appeal of certified home and commercial purification solutions. The United States Centers for Disease Control and Prevention reported in May 2025 that waterborne illnesses affect more than 7 million Americans annually and impose healthcare costs exceeding USD 3 billion, with biofilm-dwelling pathogens linked to high hospitalization and mortality despite a smaller share of cases[2]Centers for Disease Control and Prevention, “Waterborne Disease in the United States,” CDC Feature, cdc.gov. Globally, the World Health Organization estimates that hundreds of thousands of deaths per year could be averted through wider access to safely managed drinking water, which reinforces the addressable base for the water purifiers market. Shifting contaminant profiles sustain demand for multi-stage systems that handle legacy hazards such as arsenic and fluoride, and also reduce microbial risks as climate extremes stress water networks and accelerate disinfectant decay. In India, the Jal Jeevan Mission’s focus on water quality has prioritized arsenic- and fluoride-affected habitations, aligning public interventions with post-connection household purification adoption. European evidence synthesized in 2025 attributes outbreaks of pathogens like Giardia and Campylobacter to a mix of aging infrastructure and extreme rainfall that overwhelms treatment barriers, which underscores the need for resilient point-of-use safeguards within the water purifiers market.
Government Incentives and Mandates for Safe Drinking Water
Public programs and standards are expanding the regulatory and economic space for advanced filtration technologies across regions, with tangible spillovers into residential and commercial adoption. India’s Jal Jeevan Mission mobilized a multi-year public outlay to extend functional household tap connections that meet BIS:10500 drinking water norms, creating the precondition for in-home devices where source quality and last-mile risks remain variable. China’s 14th Five-Year Plan caps national water consumption and tightens efficiency goals, encouraging wastewater reuse and treatment technologies that complement point-of-use and point-of-entry systems in urbanizing areas. In the United States, the Bipartisan Infrastructure Law is channeling capital to the Drinking Water State Revolving Fund and earmarking funds for emerging contaminants, which accelerates deployment of granular activated carbon, anion exchange, and membrane filtration that households recognize and trust in the water purifiers market. The EPA’s final PFAS rule sets maximum contaminant levels for PFOA and PFOS at 4 parts per trillion with a 2031 compliance horizon, which helps align consumer and municipal expectations around certified PFAS reduction. India’s move to mandate certification for domestic purification systems in late 2024 signals a consolidation tailwind for compliant brands and gives consumers clearer product cues, which supports premiumization in high-volume categories.
Urbanization Across APAC Driving Residential Demand
Rapid urban migration in Asia-Pacific is concentrating households in cities where water infrastructure upgrades often lag population growth, which increases the role of household purifiers as a practical risk mitigation layer. The 2024 UN SDG assessment recorded uneven access to safely managed water and documented that deficits remain clustered, which implies new users will continue to drive appliance uptake as networks expand. China’s official update in early 2025 noted great improvements in monitored surface waters, yet the gap between urban and rural wastewater treatment rates highlights a persistent quality gradient that sustains purifier penetration in cities. The region’s housing density favors compact formats like under-sink and countertop units, which aligns with manufacturers’ push toward integrated cartridges and app-based monitoring for smaller living spaces in the water purifiers market. As urban incomes rise, households shift from basic gravity units to multi-stage RO and UV combinations that address both aesthetic and health parameters, which sustains average selling price growth. These patterns create a durable demand runway for residential systems even as public systems improve, because in-home purification complements network enhancements rather than replaces them in the water purifiers market.
Smart and IoT-Enabled Purifiers Creating Recurring Revenue Models
Connected purification platforms transform a one-time purchase into an ongoing service relationship that rewards timely maintenance and filter replacement with predictive prompts. Once a household or a workplace installs a connected unit, telemetry on total dissolved solids, usage patterns, and flow rates enables proactive consumable replenishment and upkeep scheduling, which raises retention and lifetime value compared with unconnected devices. Manufacturers benefit from better demand forecasting and inventory planning for cartridges and membranes, while consumers experience fewer performance lapses, which collectively strengthen satisfaction within the water purifiers market. Subscription options that bundle filters over a fixed period lower upfront costs and spread cash flows, making premium models accessible to mass-market customers in large urban centers. As AI features detect fluctuations in source water quality and automatically adjust purification intensity while balancing mineral retention, early adopters in North America, Europe, and urban APAC hubs anchor a premium tier that ripples into mainstream offerings.
Restraints Impact Analysis*
| Restraint | (~) % Impact on CAGR Forecast | Geographic Relevance | Impact Timeline |
|---|---|---|---|
| High upfront and maintenance costs of RO units | –1.4% | Global, pronounced in cost-sensitive markets | Short term (≤ 2 years) |
| Widespread access to low-cost bottled water | –0.8% | Urban centers in APAC and MEA | Medium term (2-4 years) |
| Activated-carbon feedstock supply constraints | –0.6% | Worldwide, concentrated sourcing regions | Short term (≤ 2 years) |
| Tightening regulations on RO brine disposal | –0.5% | Developed markets with strict discharge standards | Long term (≥ 4 years) |
| Source: Mordor Intelligence | |||
High upfront and maintenance costs of RO units
Upfront purchase prices and recurring filter expenses remain barriers in lower-income segments, which restrain first-time adoption and upgrade cycles. In India, premium RO units like a recent flagship priced at USD 278.24 can exceed monthly household income for a wide swath of customers, even as financing programs improve access for mid-tier models. Annual filter replacement costs add USD 33.38 to USD 55.64, which shapes the total cost of ownership perceptions and defers purchases when budgets tighten. Manufacturers are introducing water recovery innovations that cut wastewater discharge and raise perceived value, such as a unit achieving 55% recovery, which compares favorably to traditional systems and supports premium positioning. Rental and installment plans offered in Southeast Asian markets show how consumer financing reduces friction and expands the pool of households that can consider advanced purification, especially when bundled with scheduled maintenance. As awareness grows that recovery improvements lower both operating cost and environmental footprint, price-sensitive buyers may accept a higher initial outlay in exchange for better performance within the water purifiers market.
Widespread access to low-cost bottled water
In cities where bottled water is widely available, many consumers still default to on-the-go purchases rather than installing a purifier, which weighs on residential penetration in certain demographics. The convenience advantage of bottled water remains strong despite concerns over contaminants such as PFAS in public systems, as many consumers prioritize immediate access without maintenance responsibilities. Behavioral barriers also matter because the visible upfront cost of devices and setup can outweigh the less visible annual spending on bottled water for households that do not track those expenditures closely. Policy nudges are starting to shift behaviors, with the European Union encouraging tap water access in public venues and restaurants to curb plastic use and improve trust in local supplies. Where public utilities upgrade treatment with technologies like granular activated carbon and high-selectivity ion exchange due to stricter PFAS norms, consumer hesitancy toward tap sources may decline, which benefits the water purifiers market. Over time, as refill infrastructure expands and device makers refine compact formats that address small living spaces, the bottled water convenience premium can erode in favor of in-home filters.
*Our forecasts treat driver/restraint impacts as directional, not additive. The impact forecasts reflect baseline growth, mix effects, and variable interactions.
Segment Analysis
By Technology: Membrane Efficiency and Energy Reduction Drive RO Dominance, While UV-LED Capitalizes on Chemical-Free Appeal
Reverse osmosis held 37.37% of the water purifiers market size in 2025 due to its effectiveness in rejecting dissolved solids and heavy metals, particularly in high-TDS regions. Advances in membrane technology are enhancing efficiency, with suppliers introducing lower-pressure operations and extended cleaning intervals that stabilize performance and reduce operational costs. Toray, in October 2025, launched the TLF-400ULD RO membrane featuring an ultra-low pressure drop design. This innovation reduces energy consumption by approximately 10%, enhances chemical resistance during cleaning, extends service life, and lowers maintenance costs. Additionally, new electro-active RO methods use a low electrical potential across membranes to mitigate fouling and scaling, enabling higher recovery rates without acid or antiscalant dosing. These advancements reduce life cycle costs, especially in desalination-reliant and brackish water markets, where municipal process validation supports household and commercial adoption.
Ultraviolet purifiers are advancing rapidly, with an 8.76% CAGR through 2031, driven by the adoption of UV-LED systems over mercury lamps for chemical-free disinfection. UV-LED technology gained prominence for its instant on-off cycling and reduced power consumption, aligning with intermittent household usage patterns and improving device longevity in compact countertop and under-sink models. Innovations in this segment emphasize NSF-validated claims for removing biological and chemical contaminants, appealing to consumers seeking certified performance and low-maintenance solutions. Premium UV and hybrid models increasingly feature connected controls and filter-tracking modules, which integrate with mobile apps to alert users to flow or quality issues. As suppliers combine UV-LED with high-iodine activated carbon and fine-pore membranes, end users benefit from a comprehensive solution targeting microbial and microplastic risks, boosting the appeal of premium water purifiers.


By End-User: Commercial Segment Outpaces Residential Growth on ESG-Driven Workplace Installations
Residential applications accounted for 57.76% market share of demand, reflecting a large installed base and steady first-time adoption in emerging cities in 2025. Public initiatives, like India's Jal Jeevan Mission, are pivotal. By February 2025, the mission connected 15.44 crore rural households, or 154.4 million, to piped networks. This milestone not only underscores the country's commitment to water accessibility but also sets the stage for heightened residential installations as awareness of water quality grows. With mass-market RO prices in India hovering between USD 111.29 and USD 222.59, many households are opting for installment plans and service bundles. These financial strategies are not just about affordability; they're a means to achieve better taste, odor control, and reduced contaminants. Furthermore, as manufacturers enhance warranties and simplify filter changes, they bolster residential buyers' confidence in the long-term ownership of water purifiers.
The commercial segment is advancing at a 7.89% CAGR through 2031, driven by corporate sustainability pledges and a shift from bottled deliveries to on-site filtration in 2025. Venues like airports, offices, and educational institutions are adopting bottle-less stations, not just to curb plastic waste but also to minimize service truck journeys. This choice of water equipment is now intricately linked to broader emissions and waste reduction goals. In the hospitality sector, operators are installing dispensers in rooms and common areas, signaling a commitment to health and sustainability. Similarly, healthcare and food service entities are aligning their purification processes with stringent hygiene standards. Commercial buyers are increasingly willing to pay a premium upfront, especially when it's bundled with service contracts, remote diagnostics, and predictive maintenance, all of which ensure operational continuity. As water quality and refill availability become integral to building standards, the market for water purifiers is witnessing a surge in commercial buyers, spanning both new constructions and retrofits.
By Distribution Channel: Online Platforms Surge as Subscription Models and D2C Brands Disrupt Traditional Retail
Multi-brand stores held a significant 38.35% share within B2C channels in the water purifiers market. In 2025, many buyers continued to prefer in-person inspections and installation support before purchasing. Large-format chains and specialty outlets serve as demonstration hubs, showcasing filtration stages, energy consumption, and app integration. Exclusive brand outlets extend this showroom model by providing immediate post-sale support and same-day setup, reducing uncertainty for higher-priced models and fostering repeat purchases. Service contracts remain crucial in these physical channels, as periodic maintenance strengthens brand loyalty and ensures compliance with filter replacements, a key driver of aftermarket revenues. As brands align in-store and online experiences, price transparency and bundled services have become central to driving conversions.
Online channels are growing at the fastest pace, with a 9.87% CAGR through 2031. This growth was driven by seamless product comparisons, nationwide reach, and subscription enrollments at checkout. Direct-to-consumer models eliminate retail markups, enabling limited-time bundles for filters and extended services, which lower initial costs and improve retention. Embedded financing options, such as installment plans and lease-to-own schemes, appeal to price-sensitive segments by spreading cash outlays over predictable schedules. Online platforms also allow brands to penetrate tier-2 and tier-3 cities, where retail coverage is limited, while logistics integrations ensure fast delivery and installation scheduling. As manufacturers streamline serial registration, app onboarding, and cartridge auto-replenishment, the water purifiers market is gaining a more stable recurring revenue base from e-commerce segments.
Geography Analysis
Asia-Pacific held a 43.74% share of the water purifiers market, supported by population scale, urban migrations, and government infrastructure drives in 2025. India’s Jal Jeevan Mission connected 154.4 million rural households by February 2025 and reinforced water quality monitoring through a nationwide lab network, raising awareness of contamination risks and last-mile safeguards. The mission’s quality testing covered 6.632 million samples, linking supply expansion with stronger contaminant surveillance and consumer information. China reported notable surface water quality improvements, boosting public trust but leaving room for household devices to address local taste and pipe-related issues in older buildings. Rising incomes in Southeast Asia are driving the adoption of compact under-sink and countertop units, which suit apartment layouts and offer multi-stage protection, strengthening regional momentum in the water purifiers market.
North America accounts for a significant market size of global value, with product differentiation centered on certified PFAS reduction, microplastic claims, and connected performance monitoring. The EPA finalized maximum contaminant levels of 4 parts per trillion for PFOA and PFOS in April 2024, setting a 2031 compliance horizon. This drives municipal investments and standardizes advanced filtration te, technologies that households trust. The Bipartisan Infrastructure Law allocated USD 11.7 billion to the Drinking Water State Revolving Fund and USD 4 billion for emerging contaminants, accelerating upgrades that normalize granular activated carbon, anion exchange, and membranes in public systems[3]United States Environmental Protection Agency, “DWSRF Funding and Emerging Contaminants,” EPA Program Page, epa.gov. As utilities disclose compliance progress, household buyers increasingly seek NSF or equivalent certifications, boosting premium and mid-tier device adoption and recurring filter subscriptions in suburban and urban markets.
Europe represents a standards-driven demand center, where policy updates are shaping municipal and household filtration expectations. The revised EU Drinking Water Directive, effective January 2026, sets PFAS thresholds and codifies microplastics measurement in drinking water. Device makers align product labeling and third-party testing with EU frameworks to streamline compliance and reduce consumer confusion. Consumers prefer systems combining chemical-free disinfection and high-performance carbon blocks, while replacement programs emphasize ease of use and recycling. Green procurement and energy efficiency criteria in municipalities reinforce trust in home devices, driving steady adoption and replacement cycles with smart features and improved energy profiles.
The Middle East and Africa, though smaller in market share, are expanding rapidly at a projected 7.49% CAGR through 2031 due to water scarcity and desalination investments. GCC states prioritize water security with large-scale investments, validating membrane-based solutions and creating downstream demand for post-treatment purifiers. In 2024, the UN highlighted limited transboundary water governance in several African nations, emphasizing the need for decentralized solutions where centralized networks are insufficient. Urbanization in North and Sub-Saharan Africa drives demand for compact systems and robust service models. In South America, urban centers in Brazil, Argentina, and Chile lead uptake due to aging infrastructure and drought cycles, supporting growth in the water purifiers market.

Competitive Landscape
The water purifiers market exhibits moderate concentration in premium and commercial categories, with greater fragmentation in price-sensitive tiers. Competition has intensified as incumbents expand service ecosystems and challengers scale direct-to-consumer (D2C) channels. Multinational companies like Pentair and A. O. Smith leverage integrated portfolios and strong distribution networks to serve commercial and high-margin residential buyers with products such as bottle-less dispensers and advanced reverse osmosis (RO) systems. In November 2024, A. O. Smith acquired Unilever's Pureit business, strengthening its South Asia presence and consumer portfolio. Regional specialists sustain brand loyalty in markets like India and Southeast Asia by tailoring configurations to local water chemistry, pricing, and service expectations. Pentair’s September 2025 acquisition of Hydra-Stop enhanced its municipal and utility capabilities, extending its relevance from treatment to distribution maintenance[4]Pentair, “Acquisition of Hydra-Stop and Infrastructure Business Focus,” News Releases, pentair.com.
Technology leadership remains a key differentiator. Suppliers are investing in membranes, sensors, and digital platforms to improve efficiency and enable predictive maintenance. Toray’s 2025 RO membrane launch reduced energy consumption and improved chemical resistance, enhancing durability and recovery rates in industrial and municipal applications. Electro-active membrane innovations lower life-cycle costs and chemical use, appealing to commercial buyers. Service differentiation, including installation, maintenance, and cartridge logistics, drives satisfaction and retention. Proprietary apps and auto-replenishment features create ecosystem lock-in, while predictive maintenance and hygiene alerts influence procurement decisions.
Opportunities are emerging in building retrofits, PFAS reduction programs in North America and Europe, and urban migration corridors in Asia and Africa. Mature markets favor premium features like PFAS certifications and smart capabilities, while fast-growing markets adopt compact, cost-effective formats. Transparent pricing models integrating hardware and services enhance repeat purchases. Public dashboards on water quality and consumer education align municipal and household interventions, sustaining demand for replacements and new installations.
Water Purifier/Filter Industry Leaders
Pentair PLC
A. O. Smith Corporation
Culligan International
Coway Co., Ltd.
Panasonic Corporation
- *Disclaimer: Major Players sorted in no particular order

Recent Industry Developments
- November 2025: A.O. Smith Corporation announced the acquisition of Leonard Valve Company, a leader in water temperature and flow solutions, for USD 470 million, with the transaction expected to close in the first quarter of 2026, expanding A.O. Smith's portfolio of commercial plumbing components and strengthening its integrated water solutions offering.
- October 2025: Toray Industries launched the TLF-400ULD reverse osmosis membrane for industrial wastewater reuse and sewage treatment, delivering approximately 10 percent lower energy consumption through an ultra-low pressure drop design that halves differential pressure increases, doubling chemical resistance during cleaning to extend service life and reduce maintenance costs.
- September 2025: Pentair plc completed the acquisition of Hydra-Stop LLC for approximately USD 290 million in cash, net of expected tax benefits, to enhance its commercial and infrastructure business by adding Hydra-Stop's specialty insertion valve and line-stop manufacturing capabilities, enabling municipalities to maintain water flow and prevent loss during repairs.


Research Methodology Framework and Report Scope
Market Definitions and Key Coverage
Our study counts every new point-of-use or point-of-entry purifier that removes dissolved solids, microbes, heavy metals, or organics by UV, RO, carbon, ion-exchange, or hybrid stages, plus manufacturer-approved replacement cartridges.
Scope exclusion: Municipal plants, heavy industrial systems, and portable filter bottles sit outside our frame.
Segmentation Overview
- By Technology
- Ultraviolet Light (UV)
- Reverse Osmosis (RO)
- Carbon Filtration
- Ion-Exchange & De-ionisation
- Other Technologies
- By End User
- Residential
- Commercial
- By Distribution Channel
- B2C Channels
- Multi-brand Stores
- Exclusive Brand Outlets
- Online
- Other Distribution Channels (Teleshopping, Discount Clubs, etc.)
- B2B Channels (directly from the manufacturers)
- B2C Channels
- By Geography
- North America
- Canada
- United States
- Mexico
- South America
- Brazil
- Peru
- Chile
- Argentina
- Rest of South America
- Asia-Pacific
- India
- China
- Japan
- Australia
- South Korea
- South East Asia (Singapore, Malaysia, Thailand, Indonesia, Vietnam, and Philippines)
- Rest of Asia-Pacific
- Europe
- United Kingdom
- Germany
- France
- Spain
- Italy
- BENELUX (Belgium, Netherlands, and Luxembourg)
- NORDICS (Denmark, Finland, Iceland, Norway, and Sweden)
- Rest of Europe
- Middle East and Africa
- United Arab of Emirates
- Saudi Arabia
- South Africa
- Nigeria
- Rest of Middle East And Africa
- North America
Detailed Research Methodology and Data Validation
Primary Research
Analysts spoke with OEM engineers, distributors, and service crews across Asia-Pacific, North America, Europe, and the Gulf to validate filter-change cycles, channel margins, and short-term demand signals.
Desk Research
We drew ratios from WHO/UNICEF JMP, US EPA SDWIS, India's Jal Jeevan Mission, Eurostat HS codes, and Water Quality Association bulletins. Shipment clusters, ASP bands, and company financials came from D&B Hoovers, Volza, and Dow Jones Factiva, while patent feeds (Questel) and standards such as India's draft RO-wastewater rule signaled technology pivots. The list is illustrative; many other sources guided checks.
Market-Sizing & Forecasting
A top-down pool layers household and workplace counts with historical penetration and average replacement intervals, then aligns totals with import-export records. Manufacturer shipment roll-ups and sampled ASP × volume runs act as a bottom-up test. Model drivers include urbanization pace, disposable income, documented coliform outbreaks, RO membrane cost index, and online appliance share. Multivariate regression plus policy-shock scenarios shape the 2025-2030 curve; missing shipment data are bridged with proxies verified during calls.
Data Validation & Update Cycle
Outputs clear variance screens against trade codes and retail scanner flashes before a two-level review. Mordor refreshes yearly and releases interim updates whenever events like planned RO bans alter key assumptions.
Why Mordor's Water Purifier Baseline Commands Reliability
Published numbers diverge because product sets, price bases, and refresh cadences seldom match.
Typical gaps are the inclusion of filter media or services, reliance on single global ASPs, and models refreshed only every few years.
Benchmark comparison
| Market Size | Anonymized source | Primary gap driver |
|---|---|---|
| USD 34.6 B | Mordor Intelligence | - |
| USD 36.8 B | Global Consultancy A | Counts media and service sales |
| USD 37.7 B | Industry Association B | Uses blended ASP, merges PoU & PoE scopes |
| USD 38.0 B | Regional Consultancy C | Forward-shifted base year, few primary checks |
The comparison confirms that a disciplined scope, regular fieldwork, and transparent drivers let Mordor Intelligence deliver a reproducible baseline clients can trust.


Key Questions Answered in the Report
What is the current size and projected growth of the global water purifiers market?
The water purifiers market size is estimated to be valued USD 36.82 billion in 2026 and is projected to reach USD 52.39 billion by 2031 at a 7.31% CAGR, underpinned by regulatory action on contaminants and public investment that normalizes advanced filtration.
Which technology segments are leading the growth in water purification?
Reverse osmosis leads by share due to broad contaminant removal, while UV technology is the fastest-growing at an 8.76% CAGR as chemical-free disinfection and lower power use attract residential and commercial buyers.
Where is regional demand strongest for water purifiers?
Asia-Pacific holds 43.74% share supported by urbanization and public programs like India’s Jal Jeevan Mission, while the Middle East and Africa are the fastest-growing regions due to water scarcity and desalination-led infrastructure.
What policy changes are shaping consumer adoption in North America and Europe?
The EPA’s 2024 PFAS rule, with a 2031 compliance deadline in the United States, and the EU’s methodology for microplastics under the Drinking Water Directive are aligning consumer expectations with advanced filtration at the point of use.
How are ESG commitments influencing commercial purchases of water filters?
Corporations and public venues are adopting bottle-less dispensers and service contracts to reduce plastic waste and support emissions goals, which reinforces premium commercial demand for connected and service-backed systems.
What are the main barriers to household adoption of water purifiers?
Upfront device prices and recurring cartridge costs remain the primary constraints, while readily available bottled water reduces urgency for some urban consumers despite rising awareness of contaminants and regulatory upgrades.
Page last updated on:


