Data Collection And Labelling Market Size and Share
Market Overview
| Study Period | 2020 - 2031 |
|---|---|
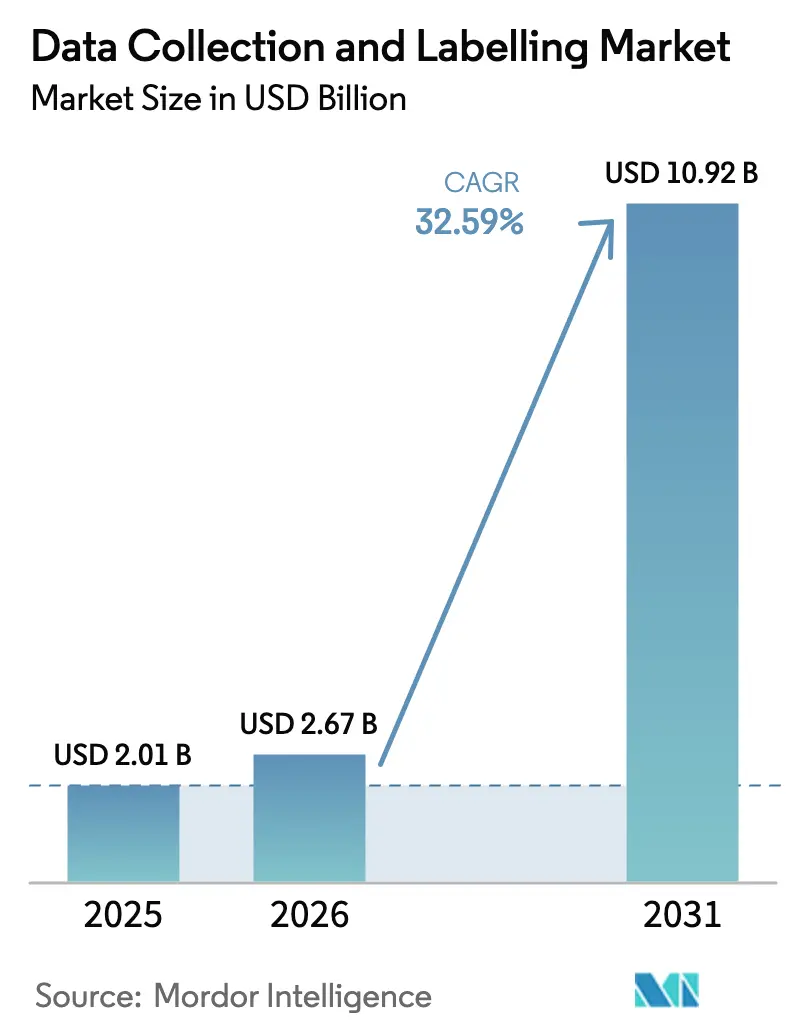
| Market Size (2026) | USD 2.67 Billion |
| Market Size (2031) | USD 10.92 Billion |
| Growth Rate (2026 - 2031) | 32.59% CAGR |
| Fastest Growing Market | Asia Pacific |
| Largest Market | North America |
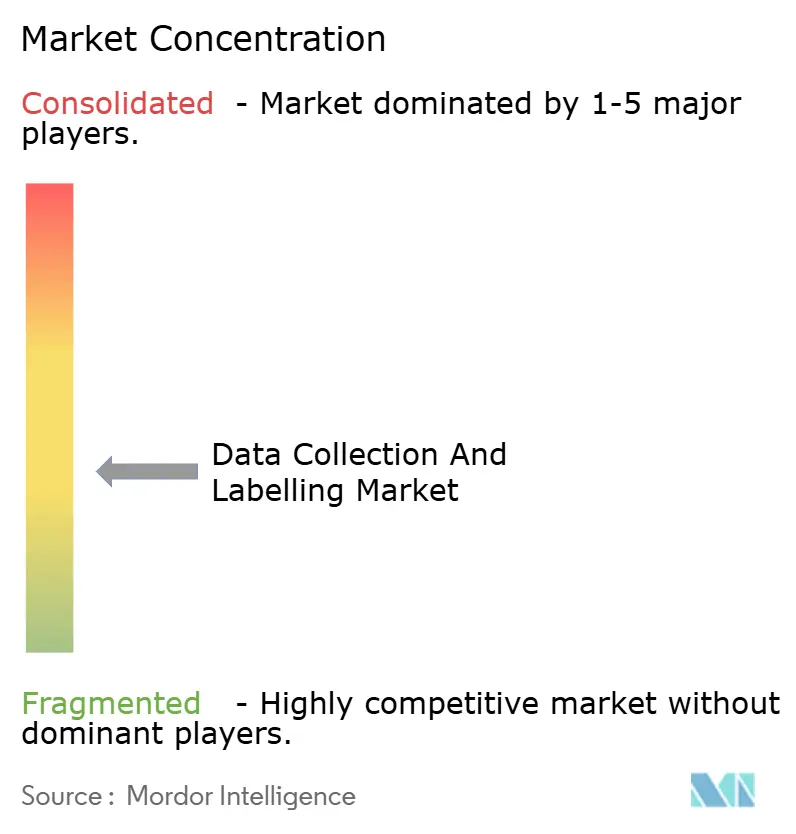
| Market Concentration | Medium |
Major Players *Disclaimer: Major Players sorted in no particular order Image © Mordor Intelligence. Reuse requires attribution under CC BY 4.0. | |
Data Collection And Labelling Market Analysis by Mordor Intelligence
The data collection and labelling market size was valued at USD 2.01 billion in 2025 and estimated to grow from USD 2.67 billion in 2026 to reach USD 10.92 billion by 2031, at a CAGR of 32.59% during the forecast period (2026-2031). Unrelenting demand for high-quality, cross-domain training data is fueled by multi-modal foundation models, the pivot toward continuous-learning pipelines, and fast-approaching regulatory compliance deadlines. Generative-AI-assisted pre-labelling now handles routine tasks with 20-fold speed gains, freeing scarce human experts for complex edge cases. Synthetic data generation, privacy-centric data localisation rules, and rising annotator burnout costs are reshaping sourcing strategies. Commercial momentum is strongest in North America, yet Asia-Pacific is scaling the fastest as China and India build domestic capacity despite stringent data-sovereignty laws. Competitive rivalry is intense because domain-specific “small data” niches such as medical imaging still command premium pricing even though overall automation levels are rising.
Key Report Takeaways
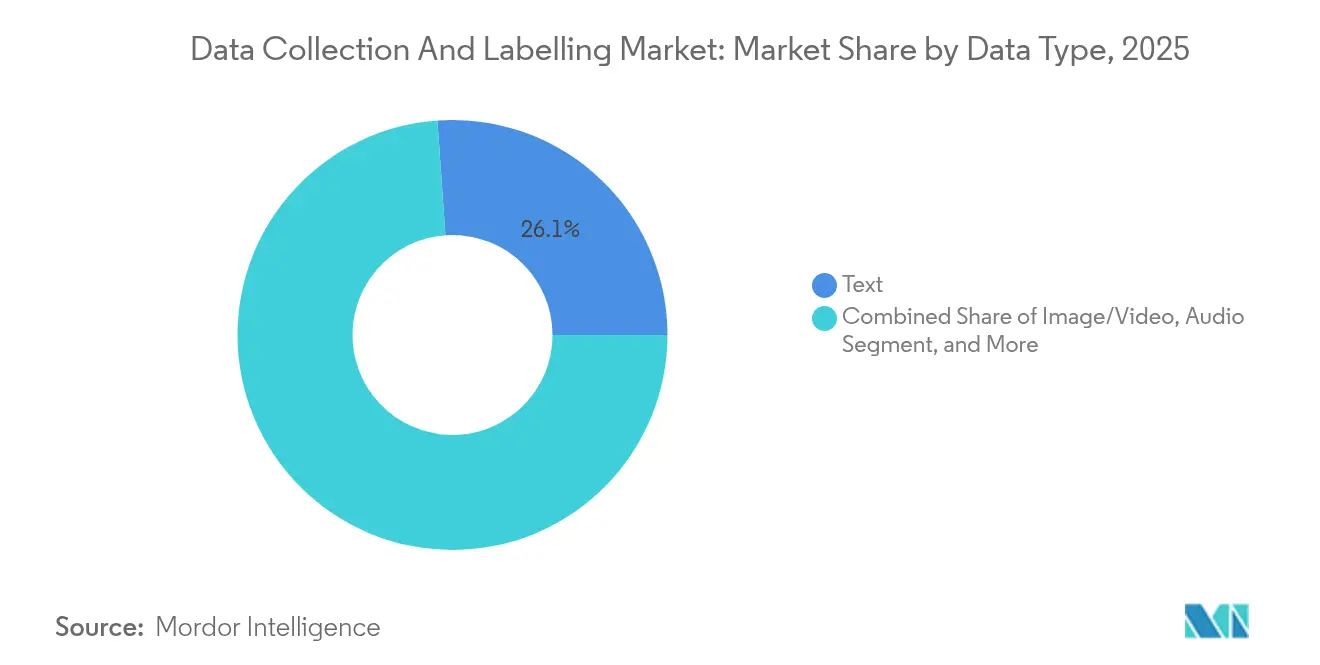
- By data type, text annotation led with 26.12% revenue share of the data collection and labelling market in 2025, while sensor-fusion streams are forecast to expand at a 35.42% CAGR through 2031.
- By end-use industry, the automotive and mobility segment held 22.05% of the data collection and labelling market share in 2025, whereas healthcare is projected to register the fastest 34.89% CAGR to 2031.
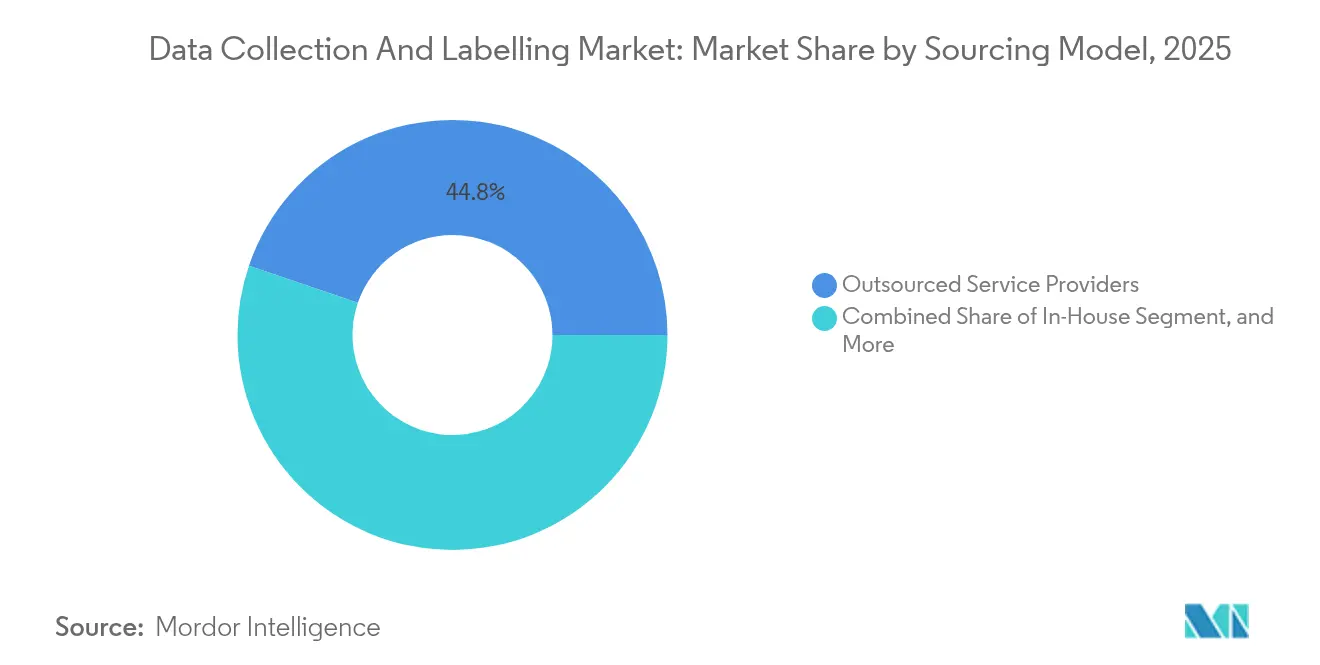
- By sourcing model, outsourced service providers captured 44.78% of the data collection and labelling market in 2025, but synthetic data generation is expected to grow 36.2% annually.
- By annotation type, manual human-in-the-loop workflows still accounted for 49.45% of the data collection and labelling market size in 2025, yet fully automated approaches are advancing at a 34.95% CAGR.
- North America commanded 39.92% of the data collection and labelling market in 2025, while Asia-Pacific is the fastest-growing geography at 35.65% CAGR.
Note: Market size and forecast figures in this report are generated using Mordor Intelligence’s proprietary estimation framework, updated with the latest available data and insights as of 2026.
Market Trends and Insights
Drivers Impact Analysis of Data Collection And Labelling Market*
| Driver | (~) % Impact on CAGR Forecast | Geographic Relevance | Impact Timeline |
|---|---|---|---|
| Surge in multi-modal foundation models | +8.2% | North America, China | Medium term (2-4 years) |
| Shift to continuous-learning pipelines | +7.1% | US, EU, Asia-Pacific | Long term (≥ 4 years) |
| Generative-AI-assisted pre-labelling | +6.8% | North America, EU | Short term (≤ 2 years) |
| Rapid compliance deadlines (EU AI Act, US AI Bill of Rights) | +5.3% | EU, North America | Short term (≤ 2 years) |
| Vertical “small data” needs in medical imaging & geospatial | +4.7% | Developed markets | Medium term (2-4 years) |
| Source: Mordor Intelligence | |||
Surge in Multi-Modal Foundation Models Drives Cross-Domain Dataset Demand
Multi-modal foundation models require massive, diverse datasets that blend text, images, audio, video, and sensor streams, igniting fresh demand across the data collection and labelling market [1]Anas Awadalla et al., “MINT-1T: Scaling Open-Source Multimodal Data by 10×,” arXiv, arxiv.org. Landmark corpora such as MINT-1T scaled open-source multimodal data by 10× and illustrate the new baseline for training modern AI. Vendors able to orchestrate cross-media annotation workflows now win premium contracts because clients require tightly aligned labels across modalities. Investors view this capability as core infrastructure, as evidenced by Scale AI’s USD 1 billion 2024 funding round. Early adopters in autonomous driving, voice assistants, and robotics are catalysing volume growth, while healthcare providers ramp imaging–text fusion datasets for diagnostic models. As these use cases mature, the data collection and labelling market is expected to see sustained multi-year volume inflows.
Data-Centric AI Transforms Static Annotation into Continuous Learning Pipelines
Enterprises have shifted from one-off dataset creation toward perpetual data-quality iteration, fundamentally altering commercial models within the data collection and labelling market [2]Matei Zaharia, “What Can Data-Centric AI Learn from Data and ML Engineering?” arXiv, arxiv.org . Platform vendors now offer streaming dataset version control, automated pipeline orchestration, and feedback-loop optimisation under emerging DataOps frameworks. Continuous-learning pipelines elevate annotation demand because incoming model telemetry constantly reveals new failure modes requiring targeted re-labelling. Service providers that can pair rapid turnaround with fine-grained audit trails are winning compliance-sensitive contracts. This long-term driver supports recurring-revenue engagements rather than sporadic projects, strengthening the data collection and labelling market’s growth visibility.
Generative-AI-Assisted Pre-Labelling Accelerates Annotation Productivity
Large language models such as GPT-4 now pre-label data with 88.4% ground-truth agreement and 20× speed gains, transforming unit economics. Hybrid workflows route routine cases to algorithms while reserving human effort for ambiguities, cutting manual hours by up to 90.6% in biological datasets. Productivity uplift enables vendors to handle surging volumes without linear workforce expansion, reinforcing price competitiveness. As AI tools mature, enterprise buyers increasingly expect built-in automation, making technical stack sophistication a decisive qualifier across the data collection and labelling market.
Regulatory Compliance Deadlines Accelerate Data Governance Investments
Article 10 of the EU AI Act, effective 2024, mandates documented dataset provenance and rigorous data-governance controls for high-risk AI systems [3]European Parliament and Council, “Regulation – EU – 2024/1689,” eur-lex.europa.eu . Similar provisions appear in the US AI Bill of Rights blueprint, compelling firms to budget for lineage tracking, bias audits, and continuous quality-assurance checks. Providers offering compliance-ready tooling and secure on-premise annotation environments are capturing premium engagements. These obligations raise switching costs and lengthen contract durations, giving the data collection and labelling market a regulatory-anchored tailwind through the decade.
Restraints Impact Analysis of Data Collection And Labelling Market*
| Restraint | (≈) % Impact on CAGR Forecast | Geographic Relevance | Impact Timeline |
|---|---|---|---|
| Rising unit costs from annotator burnout & quality decay | -3.9% | Philippines, Kenya, global hubs | Medium term (2-4 years) |
| Cross-border data-transfer restrictions | -2.8% | China, EU, India | Long term (≥ 4 years) |
| Synthetic-data substitution reduces traditional spend | -2.1% | Tech-forward markets | Medium term (2-4 years) |
| Source: Mordor Intelligence | |||
Annotator Burnout and Quality Decay Raise Unit Costs
High task repetition and tight deadlines have elevated turnover across major outsourcing hubs, pushing wages upward and threatening quality consistency. Providers now rotate workers more frequently and embed AI-based quality monitoring, but these mitigation measures inflate cost bases. If unaddressed, escalating labour expenses could erode margins and slow adoption, particularly among price-sensitive SMEs in the data collection and labelling market.
Cross-Border Data Transfer Restrictions Fragment Global Operations
China’s Network Data Security Management Regulations and India’s Digital Personal Data Protection Act impose stringent localisation and security-assessment obligations. EU GDPR adequacy reviews add further complexity. Annotation firms must build regional processing centres, invest in encryption, and navigate duplicative audits, raising fixed costs. Smaller vendors lacking resources may exit restricted jurisdictions, tightening supply and prolonging project lead times within the data collection and labelling market.
*Our forecasts treat driver/restraint impacts as directional, not additive. The impact forecasts reflect baseline growth, mix effects, and variable interactions.
Data Collection And Labelling Market Segment Analysis
By Data Type:
Sensor-Fusion Streams Accelerate Future ApplicationsText annotation remained the largest slice of the data collection and labelling market at 26.12% revenue share in 2025, sustained by surging large language model training pipelines. Sensor-fusion streams, however, are racing ahead with a 35.42% CAGR as autonomous robots, smart-factory equipment, and advanced driver-assistance systems fuse LiDAR, radar, camera, and inertial data. Image and video labelling retains momentum across manufacturing defect detection and retail shelf analytics, while 3-D medical imaging datasets such as M3D are broadening healthcare AI horizons. Audio annotation benefits from voice-enabled customer-experience applications, and tabular-time-series tasks support risk models in finance and telecom.
Sensor-fusion’s complexity, involving time-synchronisation and spatial calibration, commands premium pricing, raising its revenue contribution despite lower absolute job counts. Providers deploying automated validation routines and physics-based simulators lower re-work rates and differentiate in competitive tenders. Close collaboration between annotation teams and sensor-hardware engineers becomes indispensable, cementing integrated service offerings as a competitive moat in the data collection and labelling market.


By End-Use Industry:
Healthcare Outpaces Growth BenchmarksAutomotive and mobility accounted for 22.05% of the data collection and labelling market in 2025, driven by petabyte-scale datasets for autonomous driving. Rolling regulatory updates such as Euro-NCAP’s 2026 ADAS validation rules sustain data-generation pipelines. Healthcare is forecast to log the fastest 34.89% CAGR, propelled by high-resolution imaging, clinical-note structuring, and AI-augmented drug discovery. The data collection and labelling market size for medical imaging alone is set to climb steeply as expert radiology annotation remains non-substitutable due to liability considerations.
Government agencies expand classification, threat-detection, and citizen-service chatbots, while BFSI institutions refine fraud-analytics models requiring balanced false-positive-rate labelling. Retail e-commerce platforms elevate product-taxonomy coverage and visual-search performance. Agriculture leverages UAV imagery for yield prediction and pest monitoring, and telecom operators curate domain-specific language corpora to optimise network operations. Each vertical broadens the demand aperture, but growth spreads unevenly, giving specialised vendors room to excel in niches within the data collection and labelling industry.
By Sourcing Model:
Synthetic Generation Challenges Outsourcing DominanceOutsourced service providers held 44.78% of the data collection and labelling market in 2025, underpinned by scale, multilingual talent pools, and ISO-certified facilities. Yet synthetic data generation, scaling at 36.2% CAGR, is destabilising established workflows. Simulation environments fabricate rare driving events, and generative adversarial networks fill gaps in under-represented medical classes. Enterprises increasingly blend synthetic and real data, trimming annotation volumes for routine scenarios while reserving human effort for validation.
In-house annotation capacity is strengthening where data sensitivity or IP protection is paramount, notably among defence contractors and top-tier hospitals. Crowdsourcing retains relevance for long-tail consumer tasks needing cultural nuance, such as sentiment analysis across dialects, although quality-variance risk necessitates advanced review layers. Hybrid service models combining synthetic augmentation, AI-assisted pre-labelling, and on-shore secure facilities are emerging as the new standard across the data collection and labelling market.
By Annotation Type:
Automation Gains Momentum Amid Human OversightManual human-in-the-loop processes still represented 49.45% of 2025 revenue, underscoring the enduring value of expert context judgement. Semi-supervised and active-learning loops now trim annotation counts by over 60% without measurable accuracy loss in benchmark studies. Automated pipelines posting a 34.95% CAGR rely on foundation-model-powered labellers for first-pass tagging, feeding human validators via exception queues. Data-centric AI tooling logs provenance metadata, automates consensus scoring, and flags drift for re-labelling, reducing cycle times and bolstering compliance reporting.
As algorithmic accuracy improves, fully automated annotation will penetrate routine domains such as bounding-box detection in retail shelf images, yet intricate medical or legal interpretations will keep humans indispensable. Vendors balancing cost-efficient automation with rapid expert escalation will capture the highest-margin opportunities across the data collection and labelling market.
Geography Analysis
North America Data Collection And Labelling Market
North America dominated the data collection and labelling market with 39.92% share in 2025, backed by robust venture funding, mature AI ecosystems, and high enterprise adoption rates. Initiatives such as the US Defense Innovation Unit’s Thunderforge project signal government demand for secure, mission-critical labelling pipelines diu.mil. Canada’s Scale AI innovation cluster invested USD 96 million across 22 projects, further expanding regional infrastructure. The region’s academic-industry nexus sustains technical leadership, but rising labour costs fuel adoption of AI-assisted automation.
APAC Data Collection And Labelling Market
Asia-Pacific is the fastest-growing territory at 35.65% CAGR, driven by large-scale AI deployments and regional data-residency mandates. China’s Network Data Security Management Regulations, effective 2025, demand annual risk assessments, prompting on-shore annotation facilities. India’s Digital Personal Data Protection Act imposes explicit consent and security assessments, spawning demand for compliant domestic providers. ASEAN markets leverage multilingual crowdsourcing pools to attract global buyers, while Japan and South Korea invest in high-precision annotation for robotics and semiconductor inspection.
Europe Data Collection And Labelling Market
Europe exhibits steady growth underpinned by policy-driven data-governance imperatives. The EU AI Act’s focus on transparency escalates demand for audit-ready labelling documentation. Government Digital Service projects have demonstrated substantial efficiency gains from machine-learning-based categorisation of public-sector content . Providers offering secure, GDPR-aligned environments command premium pricing, while regional research collaborations fuel innovation in privacy-preserving annotation techniques.
Competitive Landscape
Competition is fragmented. Scale AI, Appen, and TELUS International anchor the high-end of the data collection and labelling market, each expanding through strategic partnerships. OpenAI’s 2024 alliance with Scale AI extends enterprise fine-tuning support, underscoring the value of integrated data-model services. TaskUs teamed with V7, linking a 670,000-strong annotator community to advanced data-infrastructure tooling.
Technology differentiation is intensifying. Vendors deploy active-learning engines, label-error detectors, and domain-specific foundation models to lift productivity and quality. Synthetic data capacity is a rising battleground; firms combining real and simulated pipelines market lower bias and superior edge-case coverage. Healthcare, legal, and scientific sectors value certified experts, prompting new entrants to build targeted talent networks.
Investors continue to back scale-driven platforms. Scale AI’s USD 1 billion Series F round at a USD 13.8 billion valuation highlighted faith in data-infrastructure economics. Labelbox’s 2024 partnership with Handshake expands access to specialised annotators to handle complex machine-learning workloads.TELUS Digital earned NelsonHall recognition for automotive data-annotation excellence. Overall, competitive intensity is likely to remain high as automation compresses margins and buyers demand end-to-end, compliance-ready solutions across the data collection and labelling market.
Data Collection And Labelling Industry Leaders
Appen Limited
Alegion Inc.
Cogito Tech
iMerit Technology
SuperAnnotate AI Inc.
- *Disclaimer: Major Players sorted in no particular order
Data Collection And Labelling Market Companies Covered in this Report
- Appen
- TELUS International AI Data (Lionbridge AI)
- iMerit
- CloudFactory
- Scale AI
- SuperAnnotate
- Sama
- Labelbox
- Alegion
- Cognizant (Servian)
- Defined.ai
- Cogito Tech
- V7
- Kili Technology
- Keymakr
- Deepen AI
- Playment
- Trilldata
- Tasq.ai
- Shaip

Recent Industry Developments in Data Collection And Labelling Market
- January 2025: China’s Network Data Security Management Regulations entered force, compelling annual risk assessments for data-intensive enterprises and prompting regional annotation facility build-outs Rödl & Partner.
- December 2024: Labelbox formed a strategic alliance with Handshake to tap specialised AI talent for complex labelling tasks Labelbox.
- October 2024: TELUS Digital was named a leader in NelsonHall’s CX Services report for high-tech and automotive, citing strong ADAS data-annotation capabilities TELUS Digital.
- August 2024: Singtel and Nscale partnered to unlock GPU capacity across Europe and Southeast Asia, easing compute bottlenecks for data-intensive annotation workloads Nscale.


Global Data Collection And Labelling Market Report Scope
The data collection and labeling industry is a sector that involves gathering, processing, and annotating data, which is then used to train machine learning (ML) models and artificial intelligence (AI) systems. The research also examines underlying growth influencers and significant industry vendors, all of which help to support market estimates and growth rates throughout the anticipated period. The market estimates and projections are based on the base year factors and arrived at top-down and bottom-up approaches.
Data collection and labelling market is segmented by data type (Text, Image/Video and Audio), by end-use industry (Automotive, Government, Healthcare, BFSI, Retail & E-Commerce and Other End-Use Industries) and by geography (North America, Europe, Asia Pacific, South America and Middle East and Africa). The market sizing and forecasts are provided in terms of value (USD) for all the above segments.
Segmentation Overview
| Text |
| Image/Video |
| Audio |
| 3D Point Cloud |
| Sensor and Fusion Streams |
| Tabular/Time-Series |
| Automotive and Mobility |
| Government and Public Sector |
| Healthcare and Life Sciences |
| BFSI |
| Retail and E-Commerce |
| Agriculture |
| IT and Telecom |
| Other End-Use Industry |
| In-House |
| Outsourced Service Providers |
| Crowdsourced Platforms |
| Synthetic Data Generation |
| Manual (Human-in-the-Loop) |
| Semi-Supervised / Active Learning |
| Fully Automated |
| North America | United States | |
| Canada | ||
| Mexico | ||
| Europe | Germany | |
| United Kingdom | ||
| France | ||
| Italy | ||
| Spain | ||
| Russia | ||
| Rest of Europe | ||
| Asia-Pacific | China | |
| India | ||
| Japan | ||
| South Korea | ||
| Australia and New Zealand | ||
| Rest of Asia-Pacific | ||
| Middle East and Africa | Middle East | United Arab Emirates |
| Saudi Arabia | ||
| Turkey | ||
| Rest of Middle East | ||
| Africa | South Africa | |
| Nigeria | ||
| Egypt | ||
| Rest of Africa | ||
| South America | Brazil | |
| Argentina | ||
| Rest of South America | ||
| By Data Type | Text | ||
| Image/Video | |||
| Audio | |||
| 3D Point Cloud | |||
| Sensor and Fusion Streams | |||
| Tabular/Time-Series | |||
| By End-Use Industry | Automotive and Mobility | ||
| Government and Public Sector | |||
| Healthcare and Life Sciences | |||
| BFSI | |||
| Retail and E-Commerce | |||
| Agriculture | |||
| IT and Telecom | |||
| Other End-Use Industry | |||
| By Sourcing Model | In-House | ||
| Outsourced Service Providers | |||
| Crowdsourced Platforms | |||
| Synthetic Data Generation | |||
| By Annotation Type | Manual (Human-in-the-Loop) | ||
| Semi-Supervised / Active Learning | |||
| Fully Automated | |||
| By Geography | North America | United States | |
| Canada | |||
| Mexico | |||
| Europe | Germany | ||
| United Kingdom | |||
| France | |||
| Italy | |||
| Spain | |||
| Russia | |||
| Rest of Europe | |||
| Asia-Pacific | China | ||
| India | |||
| Japan | |||
| South Korea | |||
| Australia and New Zealand | |||
| Rest of Asia-Pacific | |||
| Middle East and Africa | Middle East | United Arab Emirates | |
| Saudi Arabia | |||
| Turkey | |||
| Rest of Middle East | |||
| Africa | South Africa | ||
| Nigeria | |||
| Egypt | |||
| Rest of Africa | |||
| South America | Brazil | ||
| Argentina | |||
| Rest of South America | |||


Key Questions Answered in the Report
What is the current size of the data collection and labelling market?
The data collection and labelling market size reached USD 2.67 billion in 2026 and is forecast to rise to USD 10.92 billion by 2031.
Which region leads the data collection and labelling market?
North America led with 39.92% market share in 2025, reflecting deep AI investment and mature data-infrastructure ecosystems.
Which segment is expanding the fastest within the data collection and labelling market?
Sensor-fusion data streams are projected to grow at a 35.42% CAGR, driven by autonomous systems and IoT applications.
How is synthetic data affecting traditional annotation services?
Synthetic data engines are scaling at a 36.2% CAGR and are expected to supply the majority of training datasets, reducing routine manual-labelling demand while creating new validation needs.
What impact does the EU AI Act have on data labelling operations?
The EU AI Act mandates strict data-governance and provenance tracking, prompting enterprises to invest in compliant annotation workflows and boosting demand for audit-ready service providers.
Page last updated on:


