
Data Classification Automation Market Size and Share
Market Overview
| Study Period | 2020 - 2031 |
|---|---|
| Market Size (2026) | USD 1.41 Billion |
| Market Size (2031) | USD 4.27 Billion |
| Growth Rate (2026 - 2031) | 24.81 % |
| Fastest Growing Market | Asia-Pacific |
| Largest Market | North America |
| Market Concentration | Medium |
Major Players *Disclaimer: Major Players sorted in no particular order Image © Mordor Intelligence. Reuse requires attribution under CC BY 4.0. | |
Data Classification Automation Market Analysis by Mordor Intelligence
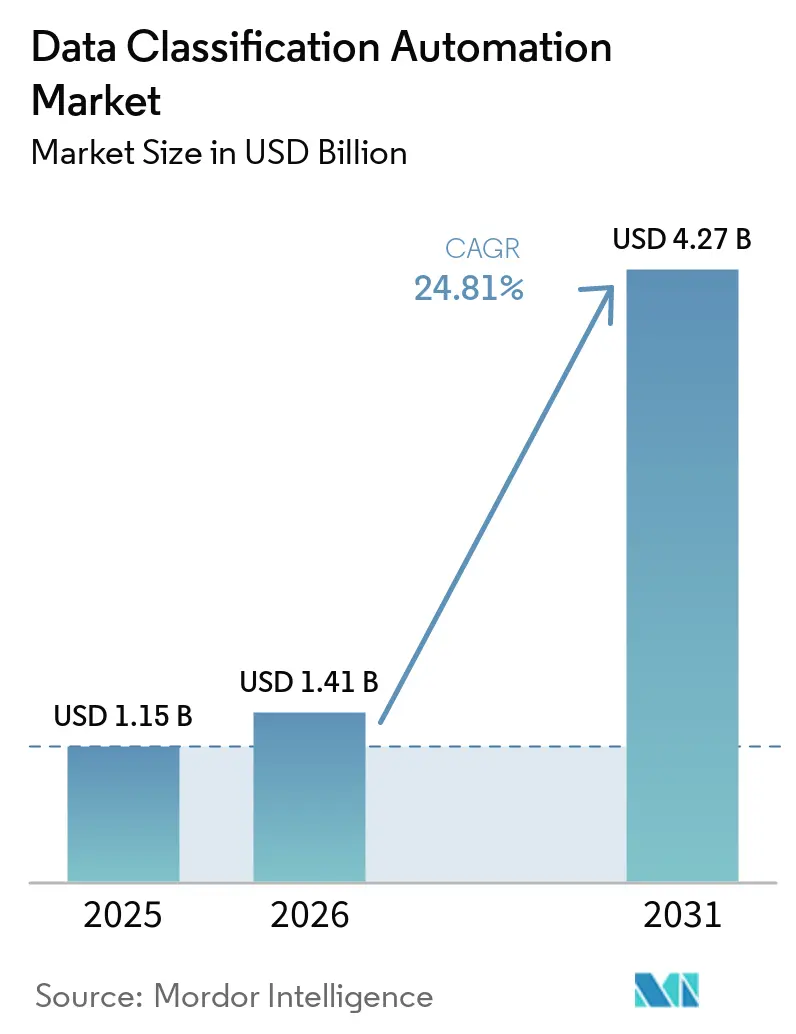
The data classification automation market size is projected to expand from USD 1.15 billion in 2025 and USD 1.41 billion in 2026 to USD 4.27 billion by 2031, registering a CAGR of 24.81% between 2026 and 2031. The full application of the EU AI Act's requirements for high-risk systems, starting August 2, 2026, makes documented training data a requirement for compliant AI deployment. This places data classification alongside privacy controls as a core part of enterprise AI governance. Enterprises are also handling much larger volumes of unstructured content, which makes manual review across documents, emails, images, collaboration files, and videos difficult. Hybrid cloud adoption and sovereign cloud rules are shifting classification from isolated repositories to policy pipelines that track data across environments. Vendors are responding through integrated platforms that combine classification with data loss prevention, data security posture management, AI governance, and access controls.
Key Report Takeaways
- By component, software accounted for 67.39% of revenue in the data classification automation market in 2025, while services are projected to expand at a 27.62% CAGR through 2031.
- By deployment mode, cloud-based deployments accounted for 57.83% of revenue in 2025 and are projected to grow at a 26.28% CAGR through 2031.
- By organization size, large enterprises held 69.74% revenue share in 2025, while small and medium-sized enterprises are projected to expand at a 28.51% CAGR through 2031.
- By data environment, unstructured data held 43.91% of the data classification automation market share in 2025, while structured data is projected to expand at a 26.32% CAGR through 2031.
- By industry vertical, banking, financial services, and insurance held 27.68% revenue share in 2025, while government and public administration are projected to expand at a 27.26% CAGR through 2031.
- By geography, North America held 42.39% revenue share in the data classification automation market in 2025, while Asia-Pacific is projected to expand at a 28.66% CAGR through 2031.
Note: Market size and forecast figures in this report are generated using Mordor Intelligence’s proprietary estimation framework, updated with the latest available data and insights as of January 2026.
Global Data Classification Automation Market Trends and Insights
Drivers Impact Analysis*
| DRIVER | (~) % IMPACT ON CAGR FORECAST | GEOGRAPHIC RELEVANCE | IMPACT TIMELINE |
|---|---|---|---|
| Generative AI And AI-Agent Data Governance Requirements | +6.1% | Global, most acute in North America and EU | Short term (≤ 2 years) |
| Expanding Privacy And Data-Security Regulations | +5.4% | Global, with concentrated early impact in EU, Asia-Pacific core, spill-over to MEA | Medium term (2-4 years) |
| Growth Of Unstructured And Sensitive Data Volumes | +4.8% | Global | Long term (≥ 4 years) |
| Expansion Of Hybrid, Multi-Cloud, And SaaS Environments | +4.2% | Global, most pronounced in North America and Asia-Pacific | Medium term (2-4 years) |
| Continuous Classification For Streaming, IoT, And Machine-Generated Data | +1.8% | Asia-Pacific core, with spill-over to North America | Long term (≥ 4 years) |
| Classification-Aware Retrieval-Augmented Generation Pipelines | +1.5% | North America and EU | Short term (≤ 2 years) |
| Source: Mordor Intelligence | |||
Generative AI And AI-Agent Data Governance Requirements
The EU AI Act requires providers of high-risk systems to document data origins, preparation steps, and bias examination for training, validation, and testing datasets from August 2, 2026. This requirement creates a data classification mandate that sits alongside established privacy reporting obligations. Enterprises therefore need one classification structure for personal and sensitive information and another for AI model documentation. Microsoft Purview and Amazon SageMaker Catalog show how vendors are adding automated classification to AI data management workflows. Amazon SageMaker Catalog can analyze table metadata with Amazon Bedrock language models and apply business glossary and personally identifiable information tags. Agentic AI raises the need for classification at the point where data is accessed or changed, rather than only where it is stored.
Expanding Privacy And Data-Security Regulations
Privacy and data-security rules now affect a broader set of jurisdictions, bringing automated classification to markets that had previously invested less in these tools. China issued a four-tier financial data grading framework on January 24, 2026, covering core data, important data, sensitive general data, and general data. Financial institutions must maintain auditable inventories and submit catalogs of important data to regulators under this framework. The Reserve Bank of India proposed a data governance framework in 2026 that includes data classification in regulated entities’ risk management systems. DORA enforcement from January 2025, NIS2, and the GDPR require European organizations to meet overlapping data governance expectations. ISO 27001 and ISO 27701:2025 information-labeling controls also help standardize classification taxonomies across multinational operations.
Growth Of Unstructured And Sensitive Data Volumes
Unstructured files include documents, email, collaboration content, scanned images, and video, creating a large discovery and labeling burden for enterprises. The Cloud Security Alliance reported that unstructured content represented 33% of enterprise data by volume and more than half of annual data growth for nearly 1 in 3 surveyed enterprises.[1] The same research found that more than 56% of organizations had only partial visibility over where their data resided. Komprise reported that 56% of enterprises identified data classification as the top challenge when preparing data for AI in 2026, up from 41% in 2024. NIST SP 1800-39, published in February 2026, provides methods for discovering, identifying, and labeling unstructured data to support Zero Trust Architecture and quantum-safe cryptography readiness. Internal AI outputs can also reproduce proprietary or regulated information, so organizations need to classify model outputs as well as inputs.
Expansion Of Hybrid, Multi-Cloud, And SaaS Environments
Hybrid and multi-cloud environments weaken the value of controls that rely only on a traditional network perimeter. Classification enables policies to be applied to data across different cloud platforms and software services. AvePoint stated that classification turns general access policies into enforceable controls for AI use cases.[2] Sovereign-cloud rules can accelerate cloud classification deployments while requiring the same controls to operate independently across multiple national environments. A 2024 journal study described automated metadata management and real-time monitoring at a global investment bank that supported GDPR and CCPA obligations in a hybrid cloud setting. ISO 27001, CMMC 2.0, and SOC 2 requirements also support investment in documented classification controls during certification and renewal cycles.
Restraints Impact Analysis*
| RESTRAINT | (~) % IMPACT ON CAGR FORECAST | GEOGRAPHIC RELEVANCE | IMPACT TIMELINE |
|---|---|---|---|
| High Integration And Implementation Costs | -3.2% | Global, most acute among mid-market enterprises in North America and EU | Medium term (2-4 years) |
| Shortage Of Data-Governance And Classification Specialists | -2.6% | Global, most severe in EU, North America, and emerging Asia-Pacific | Long term (≥ 4 years) |
| Taxonomy Drift Across Federated Business Units | -1.4% | Global, concentrated in large enterprises with decentralized structures | Medium term (2-4 years) |
| Explainability And False-Positive Risks In LLM-Based Classification | -1.1% | Global | Short term (≤ 2 years) |
| Source: Mordor Intelligence | |||
High Integration And Implementation Costs
Data classification automation deployments require work beyond software licensing because they must connect with data loss prevention, identity and access management, encryption, and security information and event management workflows. Large enterprise implementations typically took 18-24 months of sustained engineering work. This burden is more acute for mid-market companies, where data governance staff often manage security operations as well. Research from the 2026 ACL Industry Track found that enterprise classification systems require ongoing calibration as institutional taxonomies evolve.[3] The same work identified explanation stability as an important deployment criterion, as models should consistently justify similar labels under minor input changes. SaaS platforms with pre-built connectors may reduce integration work, but taxonomy design and policy tuning will still require ongoing attention.
Shortage Of Data-Governance And Classification Specialists
The shortage of classification specialists limits how quickly organizations can implement and maintain governance programs. LinkedIn reported 150% year-over-year growth in demand for AI governance skills in 2026. Axipro identified 3,004 AI builder roles for every 446 governance roles in its European hiring research, which shows the imbalance between model development and governance capacity. ManpowerGroup surveyed 39,000 employers and found that AI governance roles were the most difficult to fill globally in 2026. This shortage can also strengthen demand for automation because organizations use tools to address staffing gaps. Vendors that provide taxonomy wizards, regulatory templates, and low-code policy editors can reduce reliance on scarce specialist resources.
*Our forecasts treat driver/restraint impacts as directional, not additive. The impact forecasts reflect baseline growth, mix effects, and variable interactions.
Segment Analysis
By Component: Software Anchors The Governance Stack
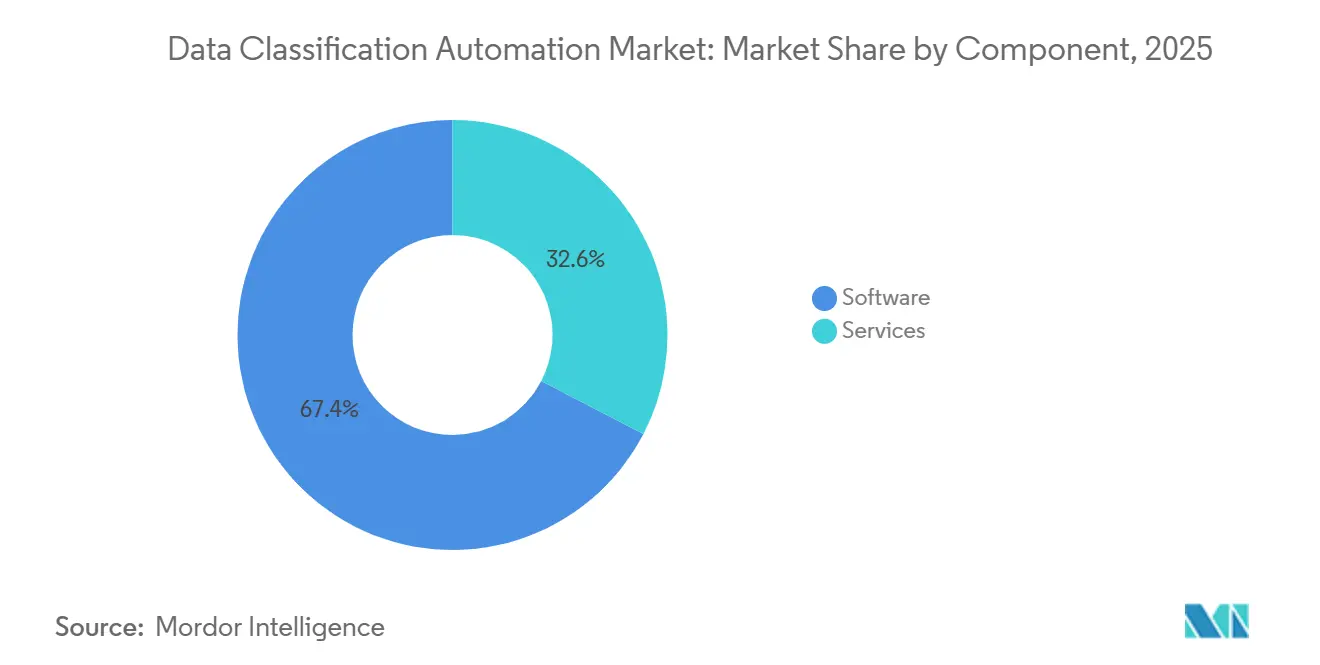
Software held 67.39% of the Data Classification Automation Market share in 2025 because scanning engines, rules, and sensitivity labels form the operating layer for automated decisions. These capabilities must be in place before encryption, data loss prevention, or access revocation can operate against a consistent classification. Varonis, Cyera, and Sentra combine deterministic pattern matching with domain-specific AI models to improve classification quality. Varonis received US Patent 12664203 in June 2026 for an embedding machine-learning method that classifies data items and applies management policies. The software layer remains central because it processes the data signals that downstream enforcement controls use.
Services are projected to expand at a 27.62% CAGR through 2031, making them the fastest-growing component. Organizations need support to reconcile labels across business units, map regulations to data elements, and validate accuracy through audit cycles. Managed classification services can monitor and correct classification gaps for customers without dedicated governance teams. The Data Classification Automation Market is therefore likely to continue to have a significant need for services even as software becomes easier to deploy. Commvault and Forcepoint show how managed offerings are combining data security posture management, data loss prevention, and post-deployment classification.
By Deployment Mode: Cloud-Based Deployments Drive Scalable Governance
Cloud-based deployments held 57.83% revenue share in 2025, reflecting the growing volume of sensitive data created, processed, and stored in cloud-native environments. Continuous scanning can identify and classify data as it changes, rather than relying on periodic batch reviews. Komprise found that data volumes are growing faster than manual and semi-automated review processes can handle. Microsoft Purview, AWS Macie, SageMaker Catalog, and Google Cloud DLP API connect classification to their respective cloud environments. This makes cloud deployment a practical option for distributed data estates.
The cloud-based Data Classification Automation Market size is projected to grow at a 26.28% CAGR through 2031. Sovereign-cloud requirements in France, Germany, India, and Australia are directing cloud deployments toward national infrastructure rather than global public-cloud regions. OpenText and S3NS announced a partnership in April 2026 for SecNumCloud-compliant content management and data classification in France and Europe. On-premises systems retain a relevant role for defense contractors, utilities, and healthcare providers with air-gapped requirements. Hybrid deployment remains necessary in regulated organizations that cannot move all data to public cloud services while still needing consistent policies across locations.
By Organization Size: Large Enterprises Anchor Demand, SMEs Accelerate
Large enterprises held 69.74% revenue share in 2025 because they operate multi-cloud estates and face regulation across several jurisdictions. Their datasets can span structured databases, unstructured repositories, SaaS platforms, and collaboration tools. This scale makes manual and semi-automated classification commercially impractical. A 2024 study of a global investment bank found that AI-enabled governance and real-time monitoring could support compliance processes across GDPR and CCPA.[4] ISO 27001 and PCI DSS 4.0 requirements also support demand for documented and auditable classification programs among large organizations.
Small and medium-sized enterprises are projected to grow at a 28.51% CAGR through 2031. SaaS-delivered tools with pre-built templates for GDPR, CCPA, HIPAA, and sector-specific requirements have lowered adoption barriers for this group. The EU AI Act and India’s Digital Personal Data Protection Act extend classification expectations to smaller organizations that develop or deploy AI systems. Low-code onboarding and ready-made classifiers matter where companies do not have dedicated governance teams. Sentra introduced an AI Classifier for Unstructured Data in November 2025 using domain-specific small language models with support for more than 70 languages.
By Data Environment: Unstructured Data Dominates, AI Reshapes Priorities
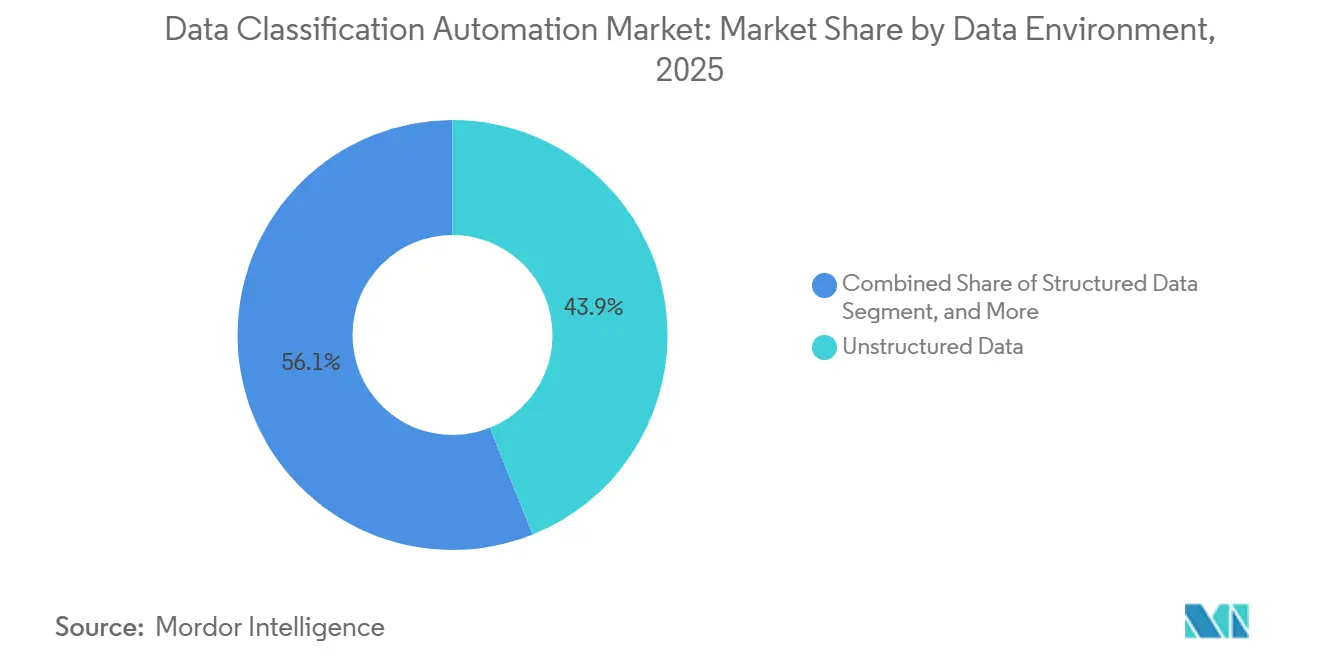
Unstructured data held 43.91% of the Data Classification Automation Market share in 2025 because text, images, and file-based content are widespread across enterprise repositories. The Cloud Security Alliance found that 56% of enterprises had only partial visibility into where their unstructured data resided. Nearly 30% of those enterprises identified unstructured data as the source of most annual data growth. NIST SP 1800-39 describes unstructured data classification as a foundation for Zero Trust Architecture and AI training-data readiness. Forcepoint expanded its AI Mesh Data Classification technology in October 2025 to address structured and unstructured data through one platform.
Structured data is projected to grow at a 26.32% CAGR through 2031, the highest rate among data environments. Organizations building large language model and retrieval-augmented generation pipelines need to identify which database tables are permitted for model training and inference. China’s GB/T 43697-2024 standard, effective in October 2024, establishes classification and grading rules for structured financial and operational datasets.[5] Semi-structured logs, XML files, and JSON outputs also need automated labels as API-driven architectures generate more audit-relevant metadata. These requirements keep all 3 data environments relevant to the Data Classification Automation Market.

By Industry Vertical: BFSI Leads While Government Gains Pace
Banking, financial services, and insurance accounted for 27.68% of revenue in 2025, making it the largest vertical in the Data Classification Automation Market. Financial institutions must manage DORA, GDPR, PCI DSS 4.0, SOX, GLBA, and China’s financial data grading rules. The combination requires auditable records for data processing activities across many systems. A 2025 AAAI study found that domain-specific classification models outperformed general-purpose commercial alternatives on recall measures for personally identifiable financial information and transaction data. Healthcare and life sciences, IT and telecommunications, and energy and utilities form a secondary group with their own compliance and operational requirements.
The government and public administration industry is projected to expand at a 27.26% CAGR through 2031. The US Department of Defense Zero Trust Data Pillar requirements and Controlled Unclassified Information guidance establish data classification as a federal security baseline. NIST SP 1800-39 provides an implementation reference that supports these requirements. India’s proposed banking data governance framework also creates classification obligations for banks and nonbanking financial companies. Education and research, retail and e-commerce, transportation and logistics, and oil and gas are smaller verticals in which AI use and cloud migration are creating new classification needs.
Geography Analysis
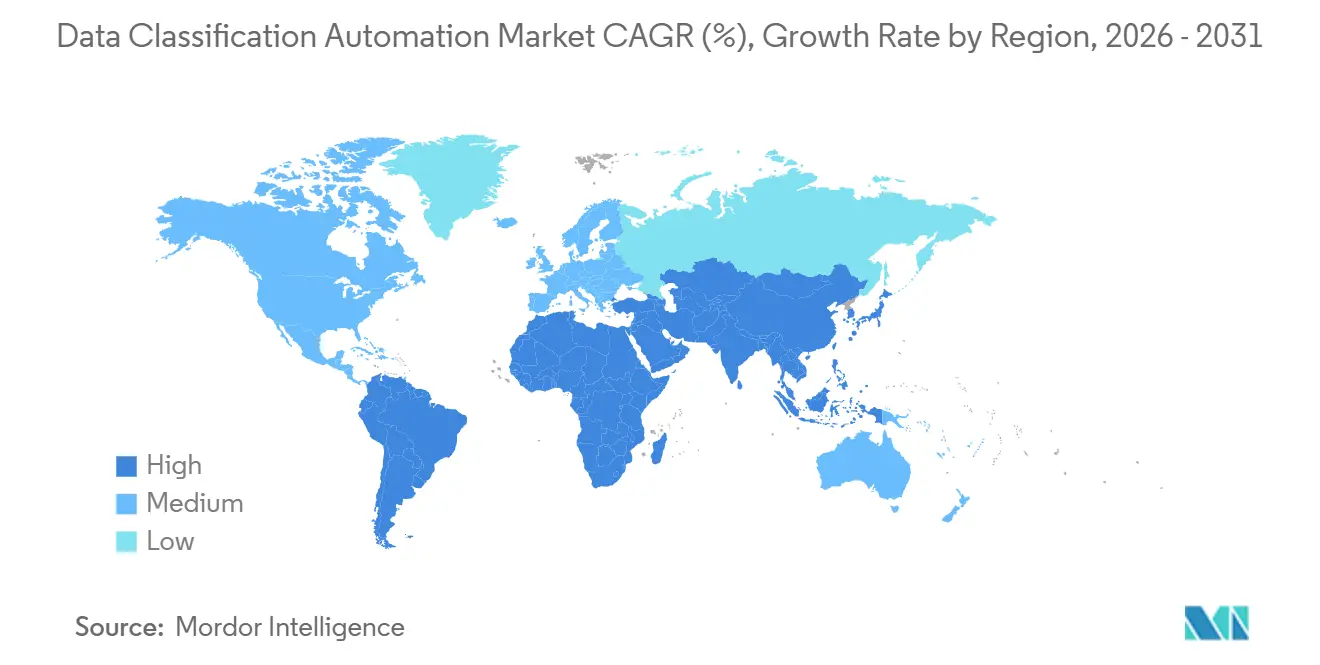
North America held 42.39% of the Data Classification Automation Market share in 2025. The region has early enterprise cloud adoption, mature data-security requirements, and an installed base of data loss prevention and identity systems that classification software can integrate with. The United States is the main contributor because federal mandates, state privacy laws in 13 states, and financial rules create overlapping classification needs. Canada and Mexico add demand through their privacy frameworks and wider cloud adoption in financial services and healthcare. NIST SP 1800-39, published in February 2026, provides a government reference architecture for federal agencies and their supply chains.
Europe is the second-largest geographic bloc and has strong regulatory density. The GDPR, DORA, NIS2, and EU AI Act require organizations in hybrid environments to demonstrate data classification coverage across multiple frameworks. Germany, France, the UK, and the BENELUX countries lead adoption through their financial services, manufacturing, and healthcare sectors. France’s SecNumCloud requirements add demand for sovereign-compliant tools. OpenText and S3NS announced a partnership in April 2026 to support SecNumCloud-compliant content management and data classification for French and European cloud deployments. ISO 27001 and BSI C5 certification expectations further support classification investment across the region.
Asia-Pacific is projected to grow at a 28.66% CAGR through 2031, the highest regional rate. India, Japan, South Korea, Australia, and Singapore have data localization requirements that make classification necessary before sensitive information can move to sovereign cloud infrastructure. China applies PIPL, GB/T 43697-2024, and financial data grading requirements that support classification demand among domestic enterprises. India’s 2025 operational rules under the Digital Personal Data Protection Act have created a procurement cycle among regulated financial entities, IT-services exporters, and healthcare organizations. South America is emerging through Brazil’s LGPD enforcement and Argentina’s updated data protection framework, with São Paulo financial firms forming a key demand area. The Middle East and Africa remains the smallest region by revenue, but Saudi Arabia’s and the United Arab Emirates’ privacy rules are creating specialized requirements in financial centers including ADGM and DIFC.
Competitive Landscape
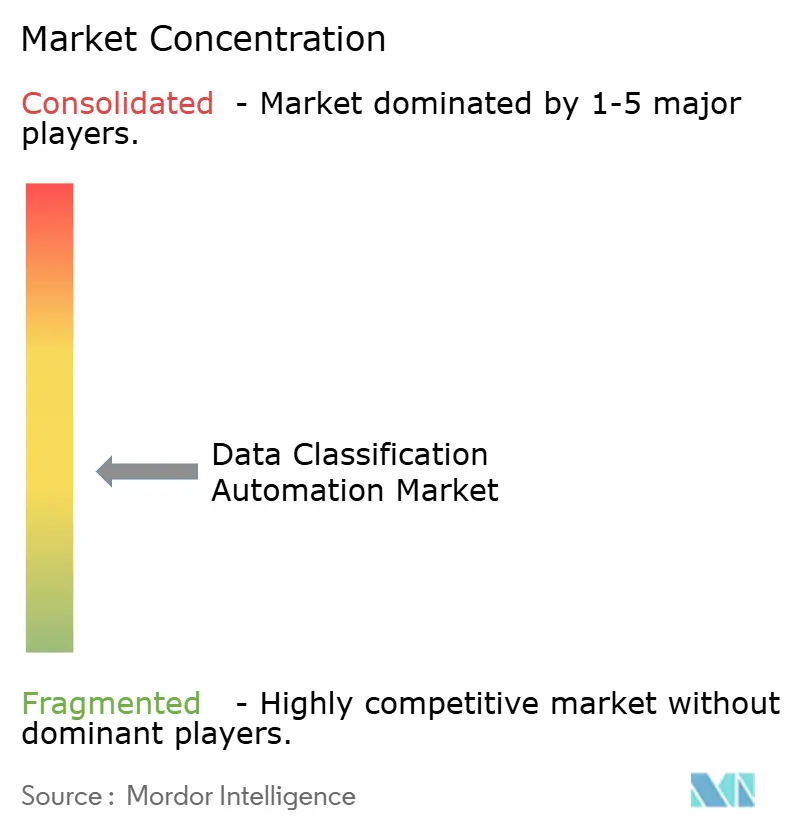
The data classification automation market is moderately fragmented, with competition transitioning from a specialist-led structure to two distinct groups. Broad cybersecurity vendors and hyperscalers offer classification within wider security platforms, while specialized providers compete on accuracy, transparency, and implementation speed. The broad platform group includes Microsoft, IBM, Informatica, and Commvault. The specialized group includes Cyera, Varonis, BigID, and Sentra. These groups compete for the same enterprise data governance budgets, although they use different delivery models.
Microsoft integrates Purview across Microsoft 365 and Azure, while Salesforce incorporated Informatica’s data catalog, governance, quality, and privacy capabilities after its November 2025 acquisition. Commvault expanded its data and AI security capabilities in March 2026 after acquiring Satori, extending automated discovery, classification, and risk assessment to structured data and vector databases. Palo Alto Networks announced its intention to acquire Portkey in April 2026 to add centralized control and classification governance for autonomous AI agent communications to Prisma AIRS. Forcepoint and F5 formed a March 2026 alliance that combines AI-native data security posture management and classification with AI red teaming and guardrails. These moves show that vendors are connecting classification with AI security, resilience, and access governance.
Opportunities remain in SaaS offerings designed for small and medium-sized enterprises, where ready-made regulatory templates can reduce implementation work. Agentic AI creates a distinct need for governance over data that is accessed and transformed without human review. Sovereign-cloud-compatible offerings also matter in Germany, France, India, and Australia, where organizations must use national infrastructure for sensitive data. Concentric AI, Seclore, and Ground Labs address narrower requirements, including rights management and financial data classification in Asia-Pacific.
Data Classification Automation Industry Leaders
-
Microsoft Corporation
-
International Business Machines Corporation
-
Varonis Systems, Inc.
-
BigID, Inc.
-
Informatica Inc.
- *Disclaimer: Major Players sorted in no particular order
Recent Industry Developments
- September 2026: Palo Alto Networks completed its acquisition of Console, an AI-native agentic security platform, integrating it into its Cortex portfolio to enable natural-language-driven alert investigation and automated remediation workflows across data security posture management environments.
- June 2026: Cyera raised USD 600 million in a Series G round at a USD 12 billion valuation, bringing total funding to USD 2.3 billion; the round was led by Evolution Equity Partners, with Cyberstarts and Temasek among new investors, and is earmarked to scale the company's classification engine for enterprise AI security at exabyte scale.
- April 2026: OpenText and S3NS (a Thales-Google Cloud alliance) announced a strategic partnership to deliver SecNumCloud-compliant content management and data classification for French and European sovereign cloud environments, supporting GDPR and SecNum 3.2 compliance.
- April 2026: Palo Alto Networks announced its intent to acquire Portkey, an AI gateway platform processing trillions of tokens per month, to integrate centralized control and classification governance over autonomous AI agent communications into its Prisma AIRS platform.
Global Data Classification Automation Market Report Scope
The data classification automation market encompasses AI- and ML-powered solutions that automatically discover, scan, and categorize sensitive data across structured and unstructured data sources without manual intervention. This market focuses on identifying and labeling data types such as PII, PCI, PHI, financial records, and intellectual property by analyzing content patterns, context, and metadata at scale across on-premises, cloud, and hybrid environments. Automation eliminates manual classification bottlenecks by continuously monitoring data repositories, applying regulatory and organizational classification schemas, detecting data sensitivity in real-time, and enabling downstream security controls like encryption, access restrictions, and DLP policies based on automated classification tags to support GDPR, CCPA, HIPAA, and PCI-DSS compliance requirements.
The Data Classification Automation Market Report is Segmented by Component (Software, and Services), Deployment Mode (Cloud-Based, On-Premises, and Hybrid), Organization Size (Large Enterprises, and Small and Medium-Sized Enterprises), Data Environment (Structured Data, Unstructured Data, and Semi-Structured Data), Industry Vertical (Government and Public Administration, Industrial Manufacturing, Retail and E-Commerce, Transportation and Logistics, Energy and Utilities, Oil and Gas, IT and Telecommunication, Media and Entertainment, Education and Research Institutions, Healthcare and Life Sciences, Banking, Financial Services, and Insurance (BFSI), and Other Industry Verticals), and Geography (North America, South America, Europe, Asia-Pacific, and Middle East, and Africa). The Market Forecasts are Provided in Terms of Value (USD).
| Software |
| Services |
| Cloud-Based |
| On-Premises |
| Hybrid |
| Large Enterprises |
| Small and Medium-Sized Enterprises |
| Structured Data |
| Unstructured Data |
| Semi-Structured Data |
| Government and Public Administration |
| Industrial Manufacturing |
| Retail and E-Commerce |
| Transportation and Logistics |
| Energy and Utilities |
| Oil and Gas |
| IT and Telecommunication |
| Media and Entertainment |
| Education and Research Institutions |
| Healthcare and Life Sciences |
| Banking, Financial Services, and Insurance (BFSI) |
| Other Industry Verticals |
| North America | United States | |
| Canada | ||
| South America | Brazil | |
| Argentina | ||
| Mexico | ||
| Rest of South America | ||
| Europe | Germany | |
| United Kingdom | ||
| France | ||
| Italy | ||
| BENELUX | ||
| Rest of Europe | ||
| Asia-Pacific | China | |
| Japan | ||
| India | ||
| South Korea | ||
| Australia | ||
| Rest of Asia-Pacific | ||
| Middle East and Africa | Middle East | United Arab Emirates |
| Saudi Arabia | ||
| Rest of Middle East | ||
| Africa | South Africa | |
| Nigeria | ||
| Egypt | ||
| Rest of Africa | ||
| By Component | Software | ||
| Services | |||
| By Deployment Mode | Cloud-Based | ||
| On-Premises | |||
| Hybrid | |||
| By Organization Size | Large Enterprises | ||
| Small and Medium-Sized Enterprises | |||
| By Data Environment | Structured Data | ||
| Unstructured Data | |||
| Semi-Structured Data | |||
| By Industry Vertical | Government and Public Administration | ||
| Industrial Manufacturing | |||
| Retail and E-Commerce | |||
| Transportation and Logistics | |||
| Energy and Utilities | |||
| Oil and Gas | |||
| IT and Telecommunication | |||
| Media and Entertainment | |||
| Education and Research Institutions | |||
| Healthcare and Life Sciences | |||
| Banking, Financial Services, and Insurance (BFSI) | |||
| Other Industry Verticals | |||
| By Geography | North America | United States | |
| Canada | |||
| South America | Brazil | ||
| Argentina | |||
| Mexico | |||
| Rest of South America | |||
| Europe | Germany | ||
| United Kingdom | |||
| France | |||
| Italy | |||
| BENELUX | |||
| Rest of Europe | |||
| Asia-Pacific | China | ||
| Japan | |||
| India | |||
| South Korea | |||
| Australia | |||
| Rest of Asia-Pacific | |||
| Middle East and Africa | Middle East | United Arab Emirates | |
| Saudi Arabia | |||
| Rest of Middle East | |||
| Africa | South Africa | ||
| Nigeria | |||
| Egypt | |||
| Rest of Africa | |||
Key Questions Answered in the Report
What is the size of the data classification automation market?
The Data Classification Automation Market was valued at USD 1.15 billion in 2025, is estimated at USD 1.41 billion in 2026, and is projected to reach USD 4.27 billion by 2031. It is projected to register a CAGR of 24.81% during 2026-2031. Growth reflects the need for enterprises to document data used in AI systems, strengthen privacy controls, and apply policies across expanding cloud and SaaS environments. The forecast also reflects more data being created across unstructured repositories, structured databases, and semi-structured operational files. Classification is becoming an operating control for data governance and AI deployment rather than a stand-alone compliance activity, particularly where enterprises must demonstrate that the data supporting AI decisions was identified, labeled, and managed under documented policies.
What is driving demand for automated data classification?
AI governance obligations, expanding privacy rules, unstructured data growth, and hybrid cloud adoption are supporting demand. Enterprises need to identify and label information across documents, databases, collaboration platforms, cloud services, and internal AI workflows. Requirements for auditable records also make classification relevant to compliance programs, access management, data loss prevention, encryption, and the secure use of AI models. AI-generated internal content can also contain regulated or proprietary information, which extends the need for classification from model inputs to model outputs. Regulatory and operational needs are therefore converging around the same data controls, which makes it important to use consistent labels across business units, repositories, and the systems that enforce access, protection, and retention policies.
Which component leads data classification automation spending?
Software led with 67.39% revenue share in 2025 because scanning engines, classification rules, and sensitivity labels support downstream controls. These tools provide the classification layer that enables consistent policy enforcement through encryption, data loss prevention, and access revocation. Services are also growing as organizations need help with taxonomy design, integrations, regulatory mapping, classification validation, and continuous audit preparation across federated data estates. Managed services can also help organizations monitor classification gaps when they cannot hire dedicated governance specialists. This work remains important when local business labels must align with enterprise-wide policy requirements, especially in organizations where data is created and managed across several departments, cloud services, and jurisdictions with different compliance obligations.
Which deployment model is expanding fastest?
Cloud-based deployments are projected to grow at a 26.28% CAGR through 2031 because they support continuous scanning across distributed environments. This approach helps teams classify information as it is created and changed rather than only during scheduled reviews. Sovereign-cloud requirements also create a need for tools that can operate on national infrastructure, while hybrid environments require policies that span both public-cloud services and on-premises repositories. On-premises systems retain a role in defense, utilities, and healthcare settings where air-gapped operations remain necessary. The resulting environment requires consistent classification coverage across several deployment models, so security and governance teams can apply the same sensitivity rules even when information remains in a local repository or moves between cloud services.
Which organization type is growing fastest?
Small and medium-sized enterprises are projected to grow at a 28.51% CAGR through 2031 as SaaS tools reduce adoption barriers. Pre-built templates, low-code onboarding, and ready-made classifiers help companies deploy controls without large technical teams. These features are important where governance personnel also manage security operations, while EU AI Act and data protection obligations create classification requirements for organizations that develop or deploy AI systems. Large enterprises remain the largest customer group because their multi-cloud data estates and cross-jurisdictional requirements make manual approaches impractical. Both groups need controls that can be adapted to changing data types and regulatory obligations, because effective programs require classification policies to remain aligned with evolving business taxonomies, cloud architectures, and AI use cases.
Which region is projected to grow fastest?
Asia-Pacific is projected to grow at a 28.66% CAGR through 2031, supported by data localization rules and expanding enterprise data volumes. China’s classification standards and financial data grading rules, together with regulatory change in India and other economies, support adoption. Organizations also need classification before moving sensitive information to sovereign cloud platforms, which links regulatory compliance, cloud migration, AI use, and domestic data infrastructure across the region. North America remained the largest regional contributor in 2025, with a 42.39% revenue share supported by mature cloud adoption and overlapping data-security requirements. Europe also has sustained demand because organizations must address GDPR, DORA, NIS2, and EU AI Act requirements together, which raises the value of tools that can document classification coverage and support audits across overlapping regulatory requirements.