Countertop Ice Makers Market Size and Share
Market Overview
| Study Period | 2020 - 2031 |
|---|---|
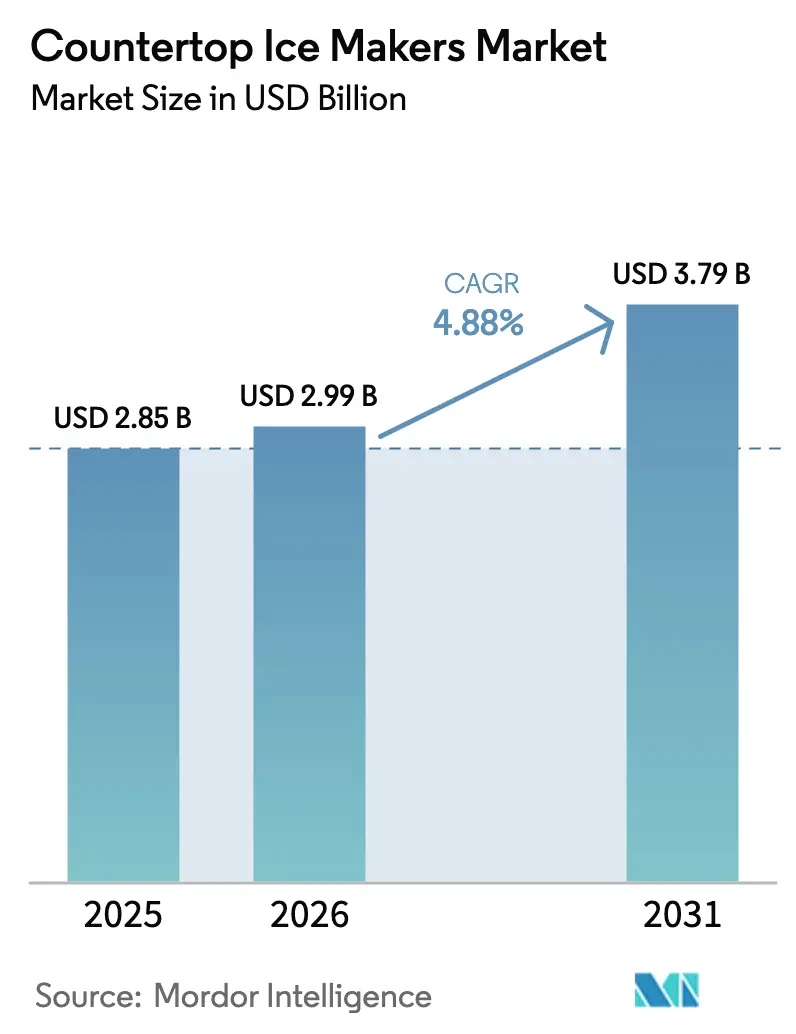
| Market Size (2026) | USD 2.99 Billion |
| Market Size (2031) | USD 3.79 Billion |
| Growth Rate (2026 - 2031) | 4.88% CAGR |
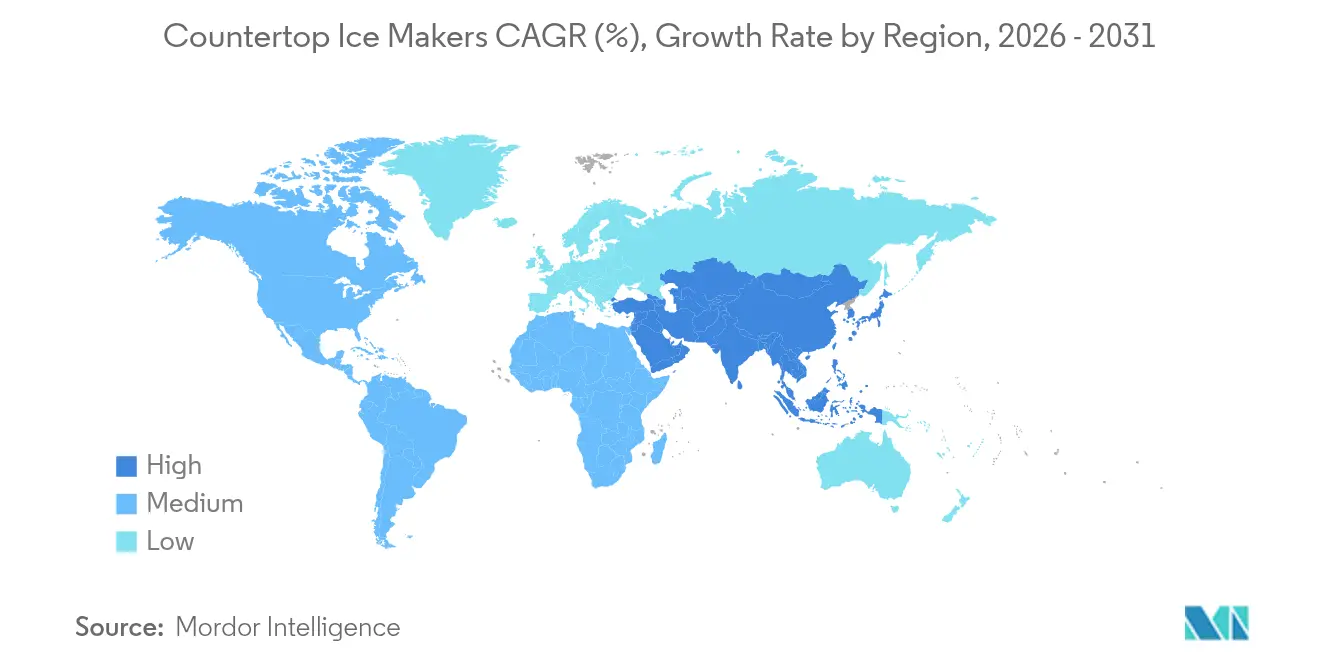
| Fastest Growing Market | Asia Pacific |
| Largest Market | North America |
| Market Concentration | Medium |
Major Players *Disclaimer: Major Players sorted in no particular order Image © Mordor Intelligence. Reuse requires attribution under CC BY 4.0. | |
Countertop Ice Makers Market Analysis by Mordor Intelligence
The Countertop Ice Makers Market size was valued at USD 2.85 billion in 2025 and estimated to grow from USD 2.99 billion in 2026 to reach USD 3.79 billion by 2031, at a CAGR of 4.88% during the forecast period (2026-2031). Growth stems from shrinking urban living spaces, a durable shift toward at-home beverage rituals, and steady technology upgrades that shrink form factors while lifting output. Premium refrigerators add built-in ice, yet portability, specialized ice textures, and lower entry prices keep standalone units relevant. Manufacturers differentiate through nugget and gourmet ice formats, smart-home connectivity, and energy-saving compressors that anticipate 2029 U.S. efficiency rules. Rising online penetration, especially in Asia-Pacific, broadens reach and accelerates new-brand entry, reshaping competitive dynamics across the countertop ice maker market[1]Source: U.S. Department of Energy, “Energy Conservation Standards for Miscellaneous Refrigeration Products,” energy.gov .
Key Report Takeaways
- By product type, bullet machines led with 45.03% of countertop ice maker market share in 2025; nugget models are forecast to advance at a 9.22% CAGR to 2031.
- By capacity, units above 40 lb/day captured 8.33% CAGR, the fastest pace, while the Up to 26 lbs/day group held 38.12% of the countertop ice maker market size in 2025.
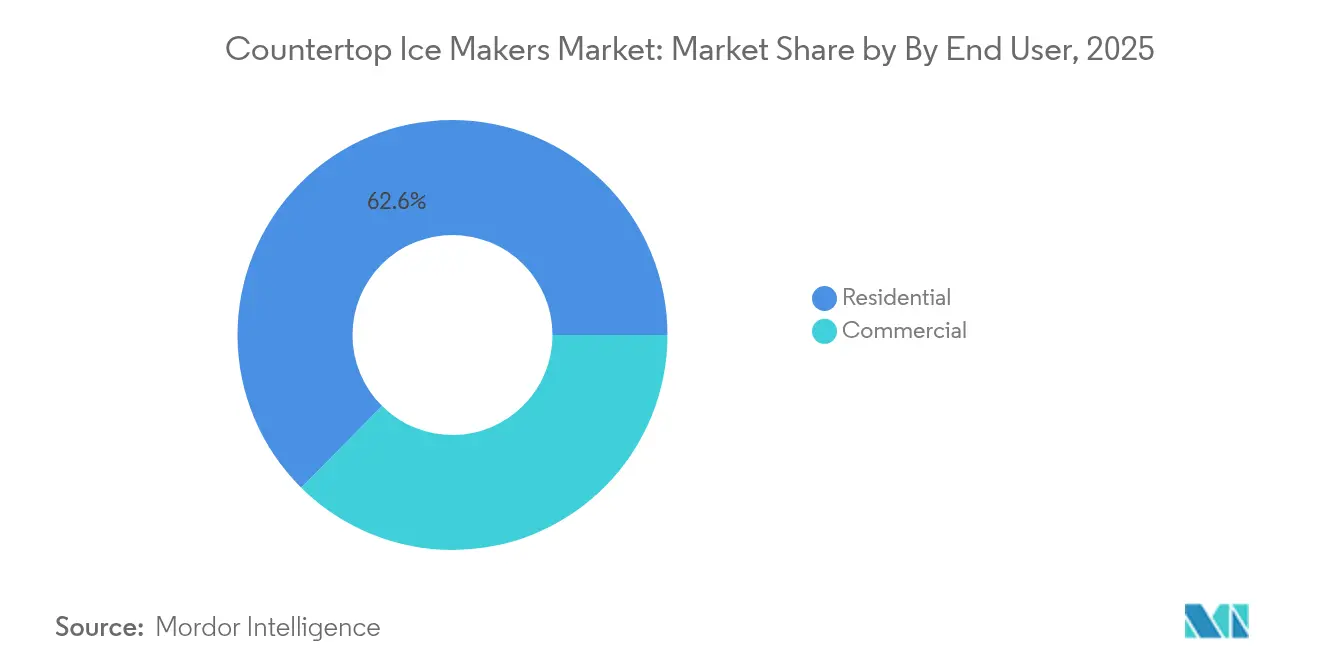
- By end user, residential applications accounted for 62.58% of the countertop ice maker market size in 2025; commercial installations post the highest 9.55% CAGR through 2031.
- By distribution channel, offline retail retained a 58.44% share in 2025, yet online sales are growing at a 8.95% CAGR in the countertop ice maker market.
- By geography, North America commanded 36.62% revenue share in 2025, whereas Asia-Pacific is set to grow at 10.06% CAGR in the countertop ice maker market.
- Competition is moderate, balancing appliance multinationals and agile e-commerce entrants. GE Appliances, Whirlpool, NewAir, Frigidaire, and Igloo head the leaderboard through nationwide retail ties and extensive service networks.
Note: Market size and forecast figures in this report are generated using Mordor Intelligence’s proprietary estimation framework, updated with the latest available data and insights as of 2026.
Global Countertop Ice Makers Market Trends and Insights
Drivers Impact Analysis*
| Driver | (~) % Impact on CAGR Forecast | Geographic Relevance | Impact Timeline |
|---|---|---|---|
| Growth in compact living spaces pushing demand for portable appliances | +1.2% | Global, with concentration in North America & APAC urban centers | Medium term (2-4 years) |
| Consumer convenience preference and at-home beverage culture | +0.9% | North America & EU, expanding to APAC | Long term (≥ 4 years) |
| Rising adoption in offices, breakrooms, and small HoReCa outlets | +0.8% | Global, led by North America commercial sector | Medium term (2-4 years) |
| E-commerce channel proliferation improving product accessibility | +0.7% | Global, with strongest impact in APAC and emerging markets | Short term (≤ 2 years) |
| Van-life and RV community demand for off-grid ice | +0.4% | North America, with spillover to EU recreational markets | Long term (≥ 4 years) |
| Efficiency gains enabling solar-powered countertop units | +0.3% | Global, with early adoption in off-grid communities | Long term (≥ 4 years) |
| Source: Mordor Intelligence | |||
Growth in Compact Living Spaces Pushing Demand for Portable Appliances
Urban densification drives consumers toward smaller kitchens where built-in dispensers do not fit. Millennials and Gen Z renters choose appliances they can move between leases, favoring lightweight countertop designs that plug into standard outlets. DOE’s 2029 energy standards assure baseline efficiency, nudging brands to adopt variable-speed compressors and thicker insulation. These forces position the countertop ice maker market as a staple rather than a discretionary category, particularly in cities where floor-space costs top USD 50 per square foot annually.
Consumer Convenience Preference and At-Home Beverage Culture
Permanent shifts toward home mixology, specialty coffee, and sparkling water elevate ice quality expectations. Nugget machines meet demands for chewable texture ideal for cold brew and craft cocktails. GE Appliances’ Opal line exemplifies premium willingness to pay, with models retailing near USD 700 and ranking among the brand’s bestsellers[2]Source: GE Appliances, “FirstBuild Marks 10 Years of Co-Creation Success,” pressroom.geappliances.com . Continuing interest in gourmet beverages sustains double-digit growth for higher-spec units across the countertop ice maker market.
Rising Adoption in Offices, Breakrooms, and Small HoReCa Outlets
Cost-of-ownership studies show countertop makers save up to 80% versus bagged ice for locations using <100 lb/day. Co-working spaces deploy machines to raise tenant satisfaction, while food trucks embrace portable units to sidestep water and drain installations. The commercial CAGR of 9.97% therefore eclipses household growth, confirming broader acceptance beyond core residential demand[3]Source: Association of Home Appliance Manufacturers, “Counterfeit Filters Pose Safety Risks,” aham.org .
E-commerce Channel Proliferation Improving Product Accessibility
Amazon controlled 61% of online category sales in 2024, leveraging nationwide fulfillment and peer reviews that validate new brands. Digital storefronts also support long-tail models in smaller markets where traditional appliance aisles are thin. As logistics networks mature in Southeast Asia and Latin America, e-commerce adds incremental volume to the countertop ice maker market, especially for solar-compatible SKUs aimed at off-grid buyers.
Restraints Impact Analysis*
| Restraint | (~) % Impact on CAGR Forecast | Geographic Relevance | Impact Timeline |
|---|---|---|---|
| Integration of ice dispensers in modern refrigerators reducing need | -0.8% | Global, with strongest impact in North America premium segment | Medium term (2-4 years) |
| Operational noise and reliability concerns affecting consumer satisfaction | -0.5% | Global, with higher sensitivity in residential applications | Short term (≤ 2 years) |
| Emerging water-quality regulations increasing compliance costs | -0.4% | North America & EU, expanding globally | Long term (≥ 4 years) |
| Influx of sub-standard imports eroding brand trust | -0.3% | Global, with concentration in price-sensitive segments | Medium term (2-4 years) |
| Source: Mordor Intelligence | |||
Integration of Ice Dispensers in Modern Refrigerators Reducing Need
High-end fridges now include craft-ice spheres and dual makers, eroding standalone demand in affluent households. LG’s Craft Ice refrigerator supplies slow-melting spheres directly from the freezer door, challenging premium countertop units. However, countertop models counter with portability, faster cycle times, and specialty nugget formats, positioning themselves as complementary for parties, patios, and RVs.
Operational Noise and Reliability Concerns Affecting Consumer Satisfaction
Compressor hum and fan vibration can top 50 dB, deterring buyers who share open-plan living spaces. Mineral scale clogs valves, prompting warranty claims that hurt brand ratings. AHAM campaigns against counterfeit filters underscore reliability risks. Manufacturers answer with quieter DC fans, stainless-steel evaporators, and self-clean cycles that lengthen service life and protect reputation within the countertop ice maker market.
*Our forecasts treat driver/restraint impacts as directional, not additive. The impact forecasts reflect baseline growth, mix effects, and variable interactions.
Segment Analysis
By Product Type: Nugget Ice Drives Premium Growth
Bullet units delivered the largest 45.03% countertop ice maker market share in 2025 on the back of mature manufacturing, 8-minute first-freeze cycles, and price points under USD 150. The segment serves apartments, dorms, and breakrooms that value straightforward cubes. Nugget machines, though smaller in volume, expand at 9.22% CAGR on the allure of chewable pellets that retain soda carbonation. Consumers pay 2- 3 times more for these textures, fueling innovation such as GE’s Opal 2.0 with WiFi scheduling and scale-inhibiting filtration.
Specialized gourmet models aim at mixologists who require crystal-clear, 2-inch slabs that minimize dilution in aged whisky. Their double-wall freezing chambers force air bubbles out, selling at USD 500-900. Although niche, the category benefits from the craft-cocktail boom and Instagram visual culture. Collectively, product diversification sustains a climb in average selling price across the countertop ice maker market.


By Capacity: High-Output Units Capture Commercial Demand
The Up to 26 lbs/day tier owned the largest slice of the countertop ice maker market size in 2025 at 38.12%, matching the daily needs of typical households. Units rated 26–40 lb/day bridge into small cafés, providing 6-minute cycles and removable bins that fit under counters.
Above-40 lb/day models, the fastest-growing group at 8.33% CAGR, entice offices and food trucks that prioritize fewer refills and continuous service. Variable-speed condensers and R290 refrigerant cut power draw, satisfying environmental codes in California and the EU. Demand for bigger bins indicates convergence between light commercial and residential entertaining trends and advances overall output expectations in the countertop ice maker market.
By End User: Commercial Segment Accelerates Adoption
Households still accounted for 62.58% of the countertop ice maker market size in 2025, but commercial buyers, from coworking spaces to boutique bars, add units to streamline service. Payback analyses show operators recover capital in eight months by replacing bagged ice deliveries. Solar-ready machines emerge for food trucks and beach kiosks seeking grid independence. As city regulations curb single-use plastics, on-site ice reduces packaging waste, giving countertop solutions a sustainability edge that resonates with small enterprises.
Furniture rental firms now bundle ice makers with kitchen packages for short-term leases, broadening the appliance’s business-to-business footprint. This diversification underpins the 9.55% CAGR for commercial installations, further cementing the countertop ice maker market as a cost-effective operational tool.
By Distribution Channel: Digital Commerce Transforms Access
Brick-and-mortar chains kept 58.44% share in 2025, leveraging live demos and bundled financing. Yet online volume scales quickly: the countertop ice maker market recorded a 8.95% CAGR for e-commerce on richer model assortments and next-day delivery. Amazon’s category dominance motivates rivals such as Walmart.com and regional marketplaces like Lazada to invest in faster fulfilment. Direct-to-consumer webstores deepen brand-user feedback loops, accelerating firmware updates for app-controlled machines and offering subscription filters that lock in recurring revenue.
Cyber-week promotions compress yearly demand into peak weeks, prompting factories to align inventory with digital flash-sales cadence. Online success is especially pronounced in India, Indonesia, and Brazil, where physical appliance showrooms are sparse, pushing incremental gains across the countertop ice maker market.
Geography Analysis
North America anchors global demand with a 36.62% slice of revenue. U.S. households value nugget textures for cold brew, while offices use 40 lb/day units to replace vending bags. Canada mirrors these patterns, and Mexico’s urban condos adopt portable makers as kitchens shrink. FDA food-grade rules and DOE energy targets provide a clear regulatory landscape, nudging brands toward quieter compressors and food-safe interiors.
Asia-Pacific is the growth engine. China’s middle-class apartment boom fuels first-time purchases, and malls showcase countertop ice maker market flagships during 11-11 shopping festivals. India’s hospitality startups outfit co-working cafés with solar-ready makers, cutting reliance on erratic municipal ice deliveries. Japan’s fascination with gadget miniaturization yields crowd-funded upgrades featuring 10-minute crystal-clear cycles. ASEAN economies add volume through beach resorts where portable machines offset unreliable grid power.
Europe contributes stable, margin-rich sales. Energy-label revisions push brands to advertise kilowatt-hour drops, resonating with eco-conscious Nordic consumers. The UK home-bar hobby, rising after pandemic lockdowns, sustains nugget sales, while Spain’s coastal bars adopt high-output units to meet tourist surges. Importers must navigate emerging water-quality standards that raise certification costs, yet compliance enhances brand trust, sustaining long-run prospects across the countertop ice maker market.
Mordor Intelligence provides coverage of the countertop ice makers market across other key regional markets, including North America, each with their regulatory frameworks and demand patterns. Detailed country-level analysis extends to United Kingdom and Germany incorporating local coverage and market participation, as required.

Competitive Landscape
Competition is moderate, balancing appliance multinationals and agile e-commerce entrants. GE Appliances, Whirlpool, NewAir, Frigidaire, and Igloo head the leaderboard through nationwide retail ties and extensive service networks. GE’s Opal Nugget Ice Maker, co-created at the FirstBuild lab, illustrates crowdsourced R&D that slashed launch cycles and captured premium share.
Challengers harness direct-to-consumer tactics, funneling social-media feedback into monthly firmware tweaks. EUHOMY and Antarctic Star deploy Instagram-driven launches featuring matte-black finishes and app scheduling, courting millennials. Hoshizaki widens its footprint via a 25% stake in Fogel and new Philippine subsidiaries, signaling consolidation aimed at supply-chain synergies.
Smart-home integration is the new battleground. WiFi diagnostics dispatch filter alerts, while voice assistants trigger express-freeze modes. Solar-compatible compressors target RV and marine niches, opening a frontier where legacy brands hold limited presence. As online ratings weigh heavily on purchase decisions, warranty responsiveness and noise performance become decisive, steering future share shifts in the countertop ice maker market.
Countertop Ice Makers Industry Leaders
GE Appliances
Whirlpool Corporation
NewAir Appliances
Frigidaire
Igloo
- *Disclaimer: Major Players sorted in no particular order

Recent Industry Developments
- February 2025: Whirlpool Corporation introduced a family-focused countertop ice maker line during KBIS 2025.
- November 2024: SharkNinja launched the Ninja Swirl™ by CREAMi®, illustrating category spillover into frozen-treat appliances.


Research Methodology Framework and Report Scope
Market Definitions and Key Coverage
Our study defines the countertop ice makers market as all compact, self-contained machines that sit on a counter, draw water from an internal reservoir, and generate ready-to-use cubes, nuggets, or clear gourmet ice for homes, offices, and small cafés. According to Mordor Intelligence, values are reported in USD and reflect factory-gate revenue of new units and closely linked replacement filters or accessories.
Scope exclusion: this assessment omits built-in, under-counter, industrial flake makers and any rental or refurbished equipment.
Segmentation Overview
- By Product Type
- Bullet Ice Makers
- Nugget / Pea Ice Makers
- Gourmet / Clear Ice Makers
- By Capacity
- Up to 26 lbs / day
- 26 - 40 lbs / day
- Above 40 lbs / day
- By End User
- Residential
- Commercial
- Small Cafes and Bars
- Offices and Co-working Spaces
- Recreational Vehicles and Marine
- By Distribution Channel
- Offline
- Specialty Appliance Stores
- Big-Box Retailers
- Dealer and Distributor Networks
- Online
- E-commerce Marketplaces
- Brand-owned Webstores
- Offline
- By Geography
- North America
- Canada
- United States
- Mexico
- South America
- Brazil
- Peru
- Chile
- Argentina
- Rest of South America
- Asia-Pacific
- India
- China
- Japan
- Australia
- South Korea
- South East Asia (Singapore, Malaysia, Thailand, Indonesia, Vietnam, and Philippines)
- Rest of Asia Pacific
- Europe
- United Kingdom
- Germany
- France
- Spain
- Italy
- BENELUX (Belgium, Netherlands, and Luxembourg)
- NORDICS (Denmark, Finland, Iceland, Norway, and Sweden)
- Rest of Europe
- Middle East And Africa
- United Arab Emirates
- Saudi Arabia
- South Africa
- Nigeria
- Rest of Middle East And Africa
- North America
Detailed Research Methodology and Data Validation
Primary Research
Mordor analysts supplement desk work with interviews and surveys involving product engineers, regional distributors, big-box buyers, and online marketplace merchants across North America, Europe, and Asia-Pacific. These conversations validate price corridors, gauge emerging use cases in RVs and co-working spaces, and test preliminary growth assumptions before figures are finalized.
Desk Research
We begin by mapping unit shipment and trade volumes from open datasets such as UN Comtrade, United States International Trade Commission appliance codes, and Eurostat PRODCOM, which clarify global flow patterns. Consumer ownership ratios, retail average selling prices, and energy-label penetration are gathered from the Association of Home Appliance Manufacturers, the U.S. Census Household Appliance Survey, and EnergyStar qualified-product lists. Company 10-Ks, investor decks, and appliance retailer sell-through dashboards round out trend cues. D&B Hoovers enables us to benchmark producer revenue splits and validate capacity disclosures. The sources mentioned illustrate our broader documentary sweep and are not exhaustive.
Market-Sizing & Forecasting
We reconstruct 2024 demand using a top-down appliance-spend pool that aligns household counts, refrigerator penetration, and discretionary kitchen gadget budgets, which are then balanced with select bottom-up checks such as sampled ASP × unit tallies from leading brands. Key variables feeding the model include average replacement cycle length, e-commerce share of small appliance sales, residential remodeling outlays, hospitality seat additions, and regional disposable income growth. A multivariate regression forecasts each driver to 2030; scenario analysis tests sensitivity to price inflation and housing starts. Data gaps in channel volumes are bridged with weighted averages from retailer sell-through panels vetted during primary calls.
Data Validation & Update Cycle
Outputs pass anomaly scans against independent import volumes, EnergyStar registration trends, and retailer revenue disclosures. Senior analysts review variances, after which a peer not involved in modeling signs off. Reports refresh annually, and interim updates are triggered when major recalls, tariff shifts, or technology launches could skew the baseline.
Why Mordor's Countertop Ice Makers Baseline Commands Reliability
Published estimates differ because firms vary scope, pricing logic, and refresh cadence. We acknowledge these gaps upfront so decision-makers see exactly where numbers diverge.
Key gap drivers include whether larger under-counter machines are folded into totals, how aggressively future ASP erosion is booked, and the extent to which emerging Asia-Pacific online-only brands are captured.
Mordor's study limits scope to true countertop units, applies region-specific price curves vetted with distributors, and is refreshed every twelve months, giving users a balanced, current baseline.
Benchmark comparison
| Market Size | Anonymized source | Primary gap driver |
|---|---|---|
| USD 2.85 B (2025) | Mordor Intelligence | - |
| USD 2.85 B (2024) | Global Consultancy A | Bundles commercial under-counter models and assumes uniform global ASP progression |
| USD 2.70 B (2024) | Industry Association B | Excludes online-only brands and limits coverage to five core regions |
In short, while other publishers swing wider or narrower, Mordor's disciplined scope definition, variable selection, and annual refresh cycle deliver a dependable reference point clients can confidently build plans upon.


Key Questions Answered in the Report
What is the current value of the countertop ice maker market?
The countertop ice maker market size stands at USD 2.99 billion in 2026 with a 4.88% CAGR outlook to 2031.
Which region will grow the fastest?
Asia-Pacific leads with a 10.06% CAGR thanks to urbanization, rising disposable incomes, and stronger e-commerce logistics.
Why are nugget ice makers gaining traction?
Nugget machines offer chewable texture and slower melt, prompting a 9.22% CAGR that outpaces all other product types.
How important is e-commerce to future sales?
Online channels already grow at 8.95% CAGR, and Amazon alone holds 61% category share, highlighting digital retail’s pivotal role.
Page last updated on:


