
Corporate Debt Solutions Market Size and Share
Market Overview
| Study Period | 2020 - 2031 |
|---|---|
| Market Size (2026) | USD 65.95 Billion |
| Market Size (2031) | USD 85.04 Billion |
| Growth Rate (2026 - 2031) | 5.22 % |
| Fastest Growing Market | Asia-Pacific |
| Largest Market | North America |
| Market Concentration | Low |
Major Players *Disclaimer: Major Players sorted in no particular order Image © Mordor Intelligence. Reuse requires attribution under CC BY 4.0. | |
Corporate Debt Solutions Market Analysis by Mordor Intelligence
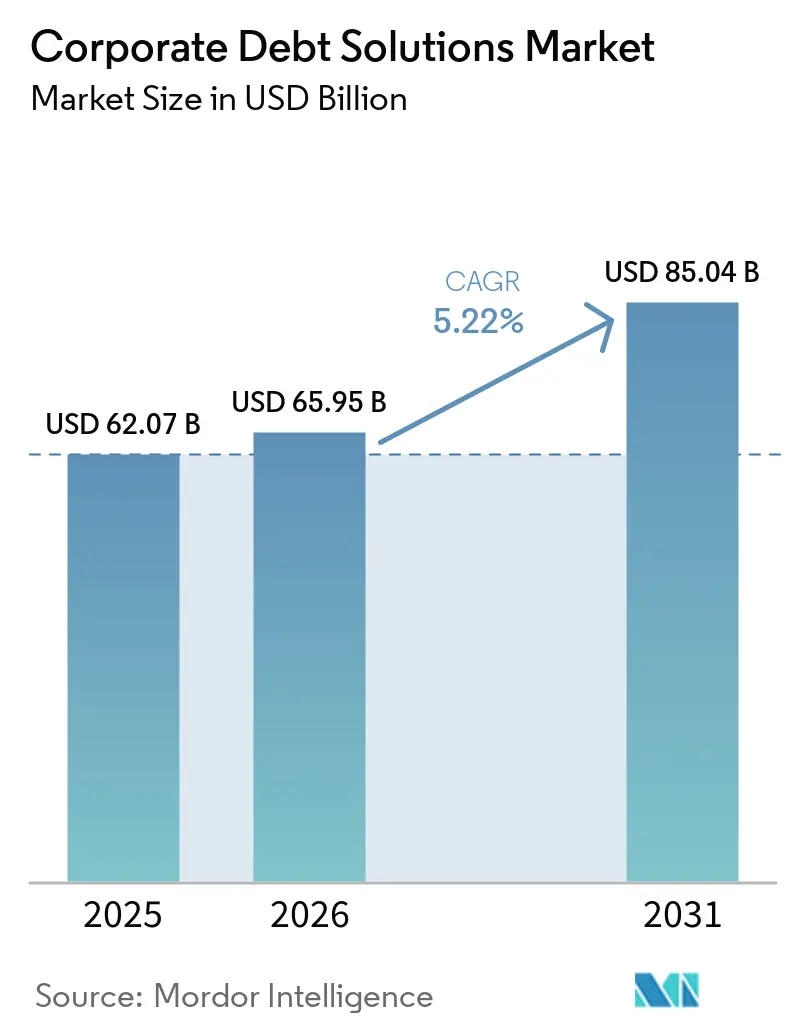
The Corporate Debt Solutions Market size is projected to expand from USD 62.07 billion in 2025 and USD 65.95 billion in 2026 to USD 85.04 billion by 2031, registering a CAGR of 5.22% between 2026 and 2031.
A large refinancing cycle is sustaining demand for advisory, origination, and structuring work across debt markets. The United States corporate debt of USD 5.9 trillion matures during 2025-2029, with maturities peaking at USD 1.46 trillion in 2028. Global corporate borrowing reached USD 13.7 trillion in 2025, including USD 6.8 trillion in bonds and USD 7 trillion in syndicated loans, while outstanding corporate debt reached USD 59.5 trillion at year-end. Artificial intelligence spending is also raising financing needs, as major hyperscalers plan USD 4.1 trillion in capital expenditure during 2026-2030, and nearly USD 500 billion of artificial intelligence-related debt had been issued in 2026 year-to-date. The corporate debt solutions market, therefore, combines a high volume of routine refinancing with increasingly complex financing assignments for technology, infrastructure, sustainable finance, and sponsor-backed transactions.
Key Report Takeaways
- By service type, debt origination, underwriting, and syndication captured 81.8% of the corporate debt solutions market share in 2025, while liability-management and restructuring advisory is projected to grow at a 7.6% CAGR through 2031.
- By debt instrument, corporate bonds and notes held 56.2% of the corporate debt solutions market size in 2025 and are projected to grow at a 5.7% CAGR through 2031.
- By credit quality, investment-grade credits accounted for 62.3% of the corporate debt solutions market share in 2025, while non-investment-grade and leveraged credits are forecast to expand at a 6.7% CAGR through 2031.
- By client type, non-financial corporate issuers held 48% of the corporate debt solutions market size in 2025, while financial sponsors are projected to grow at a 7% CAGR through 2031.
- By industry vertical, BFSI captured 36.1% of the corporate debt solutions market size in 2025, while technology, software, and digital infrastructure are forecast to grow at an 8.4% CAGR through 2031.
- By geography, North America held 41.8% of the corporate debt solutions market in 2025, while Asia-Pacific is projected to grow at a 7.1% CAGR through 2031.
Note: Market size and forecast figures in this report are generated using Mordor Intelligence’s proprietary estimation framework, updated with the latest available data and insights as of January 2026.
Global Corporate Debt Solutions Market Trends and Insights
Drivers Impact Analysis*
| Driver | (~) % Impact on CAGR Forecast | Geographic Relevance | Impact Timeline |
|---|---|---|---|
| Corporate Debt Refinancing and Maturity Management Demand | +2% | Global, with peak intensity in North America and Europe | Medium term (2-4 years) |
| Expansion of Private Credit and Alternative Debt Financing | +1.2% | Global, concentrated in North America and Asia-Pacific | Long term (≥ 4 years) |
| Rising Demand for Flexible and Bespoke Corporate Financing | +0.6% | Global | Medium term (2-4 years) |
| Large-Scale Infrastructure, Digital and Data Center Capital Requirements | +0.8% | North America and European Union, with spillover to Asia-Pacific | Short term (≤ 2 years) |
| Growing Complexity of Sustainable and Transition Debt Financing | +0.5% | European Union lead, with growth in Asia-Pacific and Middle East and Africa | Long term (≥ 4 years) |
| Cross-Border and Multi-Currency Debt Optimization | +0.4% | Global, strongest in Asia-Pacific and Europe, Middle East, and Africa | Medium term (2-4 years) |
| Source: Mordor Intelligence | |||
Corporate Debt Refinancing and Maturity Management Demand
Refinancing has become the leading issuance theme in global debt markets, supporting advisory and origination activity through the second half of the decade. Refinancings represented more than 70% of United States high-yield bond issuance in 2025 and 40% of investment-grade issuance. Refinancing needs during 2026-2028 equal 31% of outstanding non-investment-grade debt[1]https://www.oecd.org/en/publications/global-debt-report-2026_e9d80efd-en/full-report/corporate-debt-market-outlook-in-a-transforming-world_cf86a220.html. Of this debt, 67% carries a coupon below 6%, which means many issuers face higher market borrowing costs when they refinance. This gap supports liability-management work, including maturity extensions and changes to debt terms.
Expansion of Private Credit and Alternative Debt Financing
Private credit is widening the financing options available to companies and sponsors. Private credit assets under management in corporate lending are expected to exceed USD 2 trillion in 2026 and approach USD 4 trillion by the end of the decade[2]https://www.moodys.com/web/en/us/insights/credit-risk/outlooks/private-credit-2026.html. Direct lending represented 58.4% of private debt capital raised in 2024 but declined to 31% by the first quarter of 2026, as activity extended into infrastructure debt, real estate credit, asset-based finance, and artificial intelligence-related strategies. Artificial intelligence-related private credit transactions reached USD 59 billion in 2025, while their share of global private credit deal value rose from 9% in 2024 to 34% in 2025. Issuers and sponsors increasingly need advice on structures that combine syndicated debt, private credit, and structured instruments. This wider range of financing sources adds to the work handled within the corporate debt solutions market.
Rising Demand for Flexible and Bespoke Corporate Financing
Corporate borrowers increasingly require financing that matches their capital structure, operating profile, and transaction timetable. Standard bond or loan formats may not meet the needs of borrowers managing several funding sources at once. These situations can require changes to maturities, covenants, security packages, and repayment terms. The need is most visible where companies are refinancing, completing acquisitions, or managing complex debt stacks. Advisory teams, therefore, need to coordinate the requirements of borrowers, lenders, investors, and rating agencies. This demand supports the corporate debt solutions market by extending the role of advisers beyond basic underwriting and execution.
Large-Scale Infrastructure, Digital and Data Center Capital Requirements
Artificial intelligence data center projects are creating financing requirements that use several debt structures within the same transaction. Nearly USD 500 billion of artificial intelligence-related debt had been issued in 2026 year-to-date, and debt markets finance around 1-third of hyperscaler capital expenditure[3]https://www.goldmansachs.com/insights/goldman-sachs-exchanges/how-ai-debt-is-reshaping-the-credit-market. Meta and Blue Owl committed USD 27 billion to a data center joint venture, funded primarily through USD 27 billion in investment-grade bonds issued by Pimco through a bankruptcy-remote vehicle. Such structures combine project finance, structured credit, private lending, and corporate debt. Technology represented 9.6% of global non-financial corporate bond issuance in 2025, up 3.9 percentage points from 2024. The corporate debt solutions market gains from the need to align specialized financing with large and long-dated capital programs.
Restraints Impact Analysis*
| Restraint | (~) % Impact on CAGR Forecast | Geographic Relevance | Impact Timeline |
|---|---|---|---|
| Elevated Borrowing and Refinancing Costs | -0.2% | Global, acute for speculative-grade and cross-border borrowers | Short term (≤ 2 years) |
| Tight Credit Availability for Smaller and Lower-Rated Borrowers | -0.1% | Global, most severe in South America and Middle East and Africa | Medium term (2-4 years) |
| Corporate Credit Deterioration and Default Risk | -0.1% | Global, most acute in Europe and leveraged loan markets | Medium term (2-4 years) |
| Debt-Market Volatility and Reduced Liquidity During Financial Stress | -0.1% | Global | Short term (≤ 2 years) |
| Source: Mordor Intelligence | |||
Elevated Borrowing and Refinancing Costs
Higher borrowing costs continue to limit issuance economics for lower-rated and middle-market borrowers. At the end of 2024, new-debt costs exceeded outstanding-debt costs by 1.4 percentage points for non-investment-grade issuers. The gap narrowed to 0.7 percentage points in 2025, but 31% of outstanding non-investment-grade debt must refinance during 2026-2028 at higher rates. Unrated and sub-investment-grade borrowers without established syndicated lending relationships face a wider cost difference. This pressure can reduce advisory fee economics in some lower-rated issuer categories. It can also create demand for maturity extensions and liability-management work, producing a mixed effect on the corporate debt solutions market.
Tight Credit Availability for Smaller and Lower-Rated Borrowers
Smaller and lower-rated borrowers often have fewer financing options during periods of cautious credit conditions. Their access to regular capital markets can be more limited than that of large investment-grade issuers. This constraint is most severe in South America and the Middle East and Africa under the stated geographic assessment. Higher pricing can further reduce the range of available debt structures. Borrowers may need to rely on narrower lender groups or revise the terms of a proposed financing. These conditions can slow transaction execution and limit growth in the corporate debt solutions market for the affected borrower groups.
*Our forecasts treat driver/restraint impacts as directional, not additive. The impact forecasts reflect baseline growth, mix effects, and variable interactions.
Segment Analysis
By Service Type: Origination Leads Volume and Restructuring Leads Growth
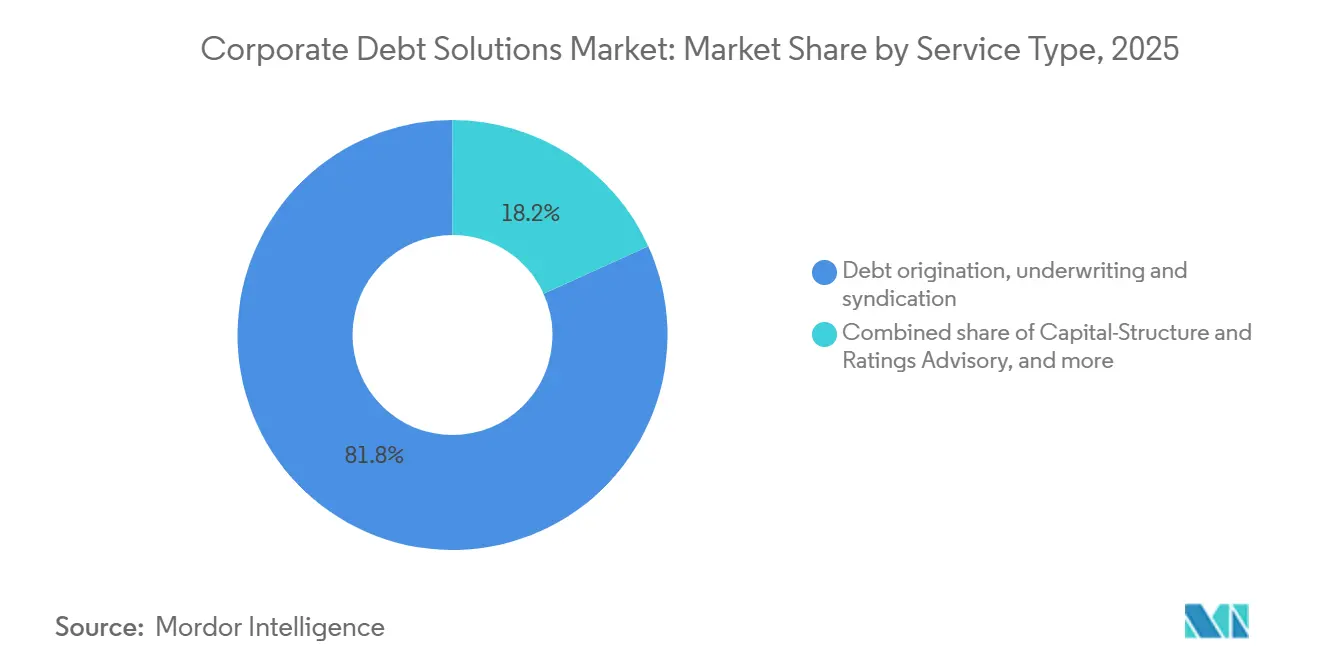
Debt origination, underwriting, and syndication held 81.8% of the corporate debt solutions market in 2025. This position reflected the volume of primary investment-grade and high-yield issuance handled by major banks. United States corporate bond gross issuance is expected to reach USD 2.46 trillion in 2026. Net issuance by investment-grade and speculative-grade non-financial companies remained positive, indicating sustained primary activity. Capital structure and ratings advisory become important when borrowers must manage ratings, investor communication, and financing tenor together. Higher refinancing costs make these choices more consequential for issuers.
Liability-management and restructuring advisory is the fastest-growing service, with a projected CAGR of 7.6% during 2026-2031. Multi-tranche covenant-lite structures issued in 2020 and 2021 are reaching decision points for borrowers and creditors. Houlihan Lokey advised on 83 global distressed debt and bankruptcy transactions in 2025. Evercore’s Liability Management and Restructuring team was named IFR Americas Restructuring Adviser of the Year for 2025. Underwriting banks may face conflicts when representing creditors, which creates a role for independent advisers. The corporate debt solutions industry therefore has different competitive models for high-volume origination and complex restructuring mandates.


By Debt Instrument: Bonds Lead Share and Growth
Corporate bonds and notes held 56.2% of the corporate debt solutions market in 2025. They also recorded the highest projected growth among debt instruments, with a CAGR of 5.7% through 2031. Outstanding corporate bonds rose to USD 36.19 trillion at the end of 2025. Net issuance by non-investment-grade non-financial companies turned positive for the first time since 2021. This broadened the bond issuer base beyond the most frequent investment-grade borrowers. United States electronic corporate-bond trading reached 50% of total trading by November 2025, while median bid-ask spreads declined to 30 basis points at year-end.
Syndicated loans remain important for leveraged buyouts and cross-border acquisition financing. They are used when borrowers need large, flexible facilities with coordinated lender participation. Large sponsor transactions continue to test the relative pricing of syndicated loans and private credit. The input identifies this competition as a source of continuing work on instrument selection and syndication strategy. Hybrid capital structures can also require lenders and advisers to balance bond, loan, and private financing alternatives. These requirements support the corporate debt solutions market because the financing instrument is linked to the borrower’s wider capital structure. The corporate debt solutions industry must therefore address both liquid bond market execution and loan-based financing for sponsor transactions.
By Credit Quality: Investment Grade Provides Stability and Leveraged Credit Adds Complexity
Investment-grade credits held 62.3% of the corporate debt solutions market in 2025. Median interest coverage for investment-grade issuers was 6.9 in 2024, compared with a historical average of 5.9. Corporate credit spreads remained close to historical lows, supported by corporate fundamentals, lower liquidity premia, and investor risk appetite. Investment-grade issuers generate steady work through recurring bond issuance, ratings maintenance, liability management, and cross-border financing. Non-financial companies completed USD 768 billion of net investment-grade bond issuance in 2025. This issuance supports stable origination and advisory revenue for the corporate debt solutions market.
Non-investment-grade and leveraged credits are projected to grow at a CAGR of 6.7% through 2031. Financial sponsor buyouts and sponsor-backed refinancings are the primary sources of this growth. Fitch Ratings stated in January 2026 that the global leveraged finance maturity profile remained well laddered for higher-quality high-yield issuers. The mix is weighted toward BB-rated borrowers, which supports refinancing flexibility ahead of the 2029 maturity peak. Leveraged transactions often require coordinated work on covenants, debt pricing, and ongoing monitoring. Basel III and Basel IV also influence banks’ willingness to hold leveraged loans on balance sheet, supporting non-bank financing structures and specialist advisers.
By Client Type: Corporate Issuers Lead Volume and Financial Sponsors Grow Fastest
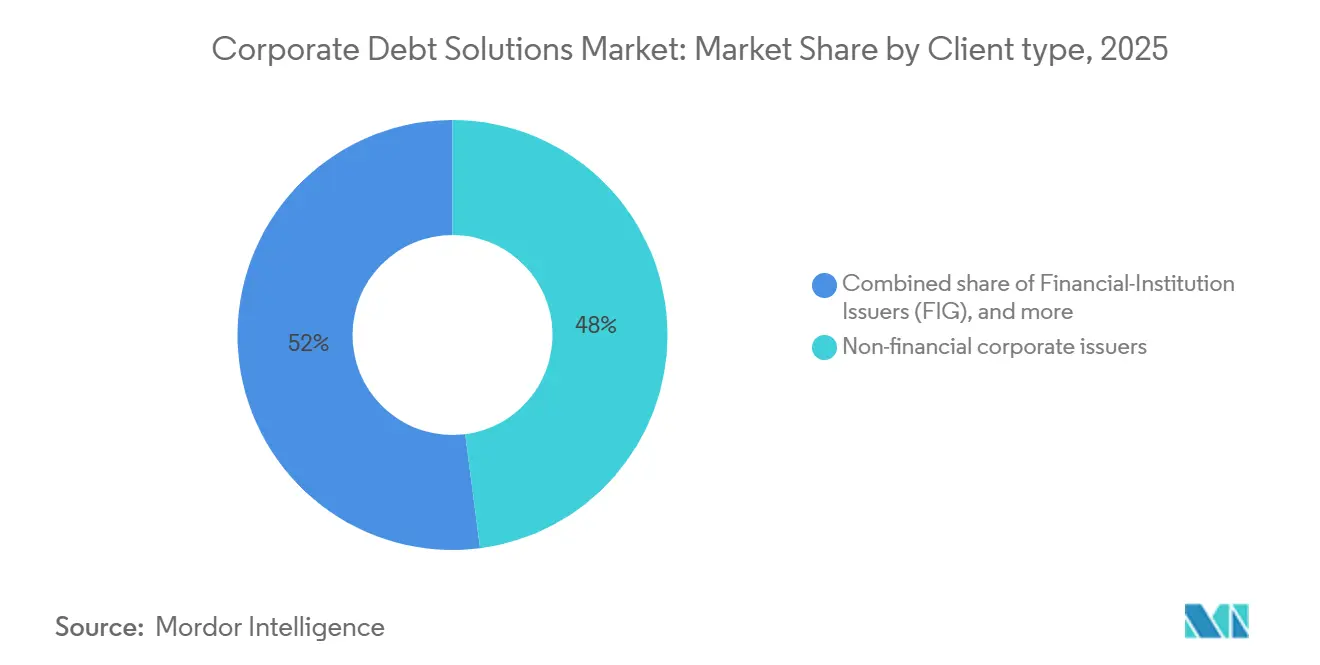
Non-financial corporate issuers retained 48% of the corporate debt solutions market in 2025. Their demand is supported by recurring bond issuance and facility refinancing. During 2026-2028, 65% of maturing investment-grade debt carries a coupon of 4% or less. This exposes many creditworthy borrowers to higher market rates at refinancing. Financial institution issuers have separate needs related to prudential rules, hybrid capital, and covered bonds. Corporate issuers and financial institutions, therefore, maintain a broad base of work for the corporate debt solutions industry.
Financial sponsors are the fastest-growing client type, with a projected CAGR of 7% for 2026-2031. The net value of unsold private equity assets at the end of their theoretical 12-year life could nearly double to USD 903 billion by 2029. This condition supports financing for continuation vehicles, portfolio restructurings, and other hybrid capital solutions. Sponsor mandates often involve several lenders, a large debt package, and a defined acquisition schedule. These assignments require coordination across term loans, revolving facilities, and co-arranger roles within the corporate debt solutions market.
By Industry Vertical: BFSI Has the Largest Share and Technology Has the Highest Growth
BFSI held 36.1% of the corporate debt solutions market in 2025. Financial companies represent 58% of outstanding corporate bonds in Asia-Pacific. The sector is both a major issuer and a central intermediary in debt markets. Advisory demand includes capital-structure work, Additional Tier 1 and Tier 2 issuance, and regulatory capital management. Covered bonds, subordinated debt, and senior unsecured structures also create recurring assignments. This combination keeps BFSI central to the corporate debt solutions market.
Technology, software, and digital infrastructure are the fastest-growing verticals, with a CAGR of 8.4% through 2031. Technology accounted for 9.6% of global non-financial corporate bond issuance in 2025, an increase of 3.9 percentage points from 2024. Artificial intelligence capital programs are increasing the scale and complexity of financing decisions. Manufacturing and industrials need funding for cross-border mergers and acquisitions. Energy, utilities, and natural resources require project finance and transition debt structures, while real estate and construction face refinancing needs under higher capitalization rates. Healthcare, consumer, retail, and transportation create steady demand through private equity ownership changes, mergers and acquisitions, and working-capital-related debt structures.
Geography Analysis
North America held 41.8% of the corporate debt solutions market in 2025. The region benefits from the depth of the United States corporate bond markets and the concentration of debt capital markets activity at large banks. United States corporate bond gross issuance is expected to reach USD 2.46 trillion in 2026. Artificial intelligence hyperscaler borrowing is identified as the key additional source of issuance demand. Canada supports cross-border advisory activity, while Mexico faces more constrained conditions because of concerns over its sovereign fiscal path. In South America, Brazil supports international issuance by selected investment-grade companies, and Azul S.A. emerged from Chapter 11 in February 2026 after restructuring more than USD 1.3 billion of funded debt.
Europe supports the corporate debt solutions market through mature regulation and sustainable finance frameworks. The European Union Green Bond Standard supported an expansion of sustainable bond advisory work during 2025 and 2026. European leveraged finance reached new highs in the second half of 2025 as sponsors and companies refinanced, repriced, and extended their debt. Refinancing remained the main issuance theme as borrowers sought to secure pricing. The United Kingdom supports liability management and leveraged buyout work. Germany supports large industrial refinancings, while France and Italy support complex transactions that combine syndicated loans and bond market execution.
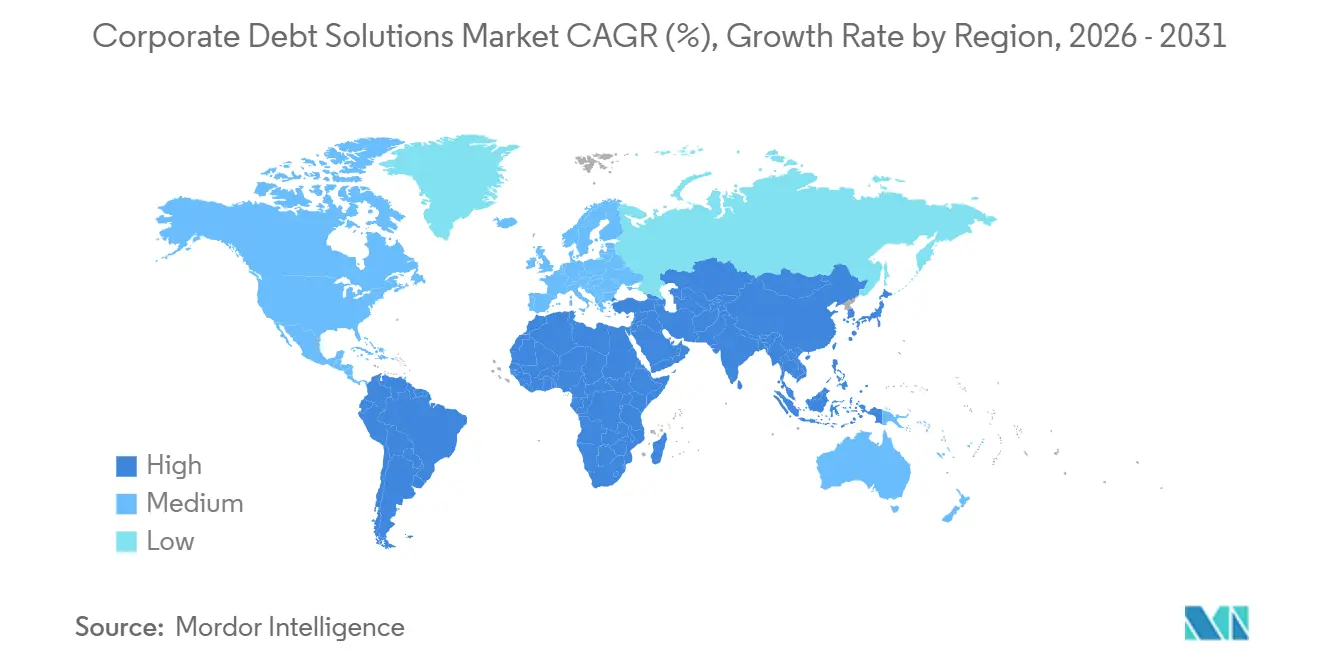
Asia-Pacific is the fastest-growing regional market, with a projected CAGR of 7.1% from 2026 to 2031. Asian corporate bond issuance reached USD 2.77 trillion in 2025, a 20% real-terms increase from the 2022-2024 average, and outstanding corporate bonds rose 3% to USD 10.8 trillion. International issuance in Asia reached USD 527 billion in 2025, led by Japan, China, and the Association of Southeast Asian Nations. India’s corporate bond market reached INR 59 lakh crore, equivalent to USD 704 billion, and recorded a CAGR of 10.4% over the prior 5 fiscal years. Corporate bonds represented 17% of India’s gross domestic product, leaving room for market development. The Middle East and Africa also support conventional bond, sukuk, and transition-finance issuance, led by Saudi Arabia and the United Arab Emirates.

Competitive Landscape
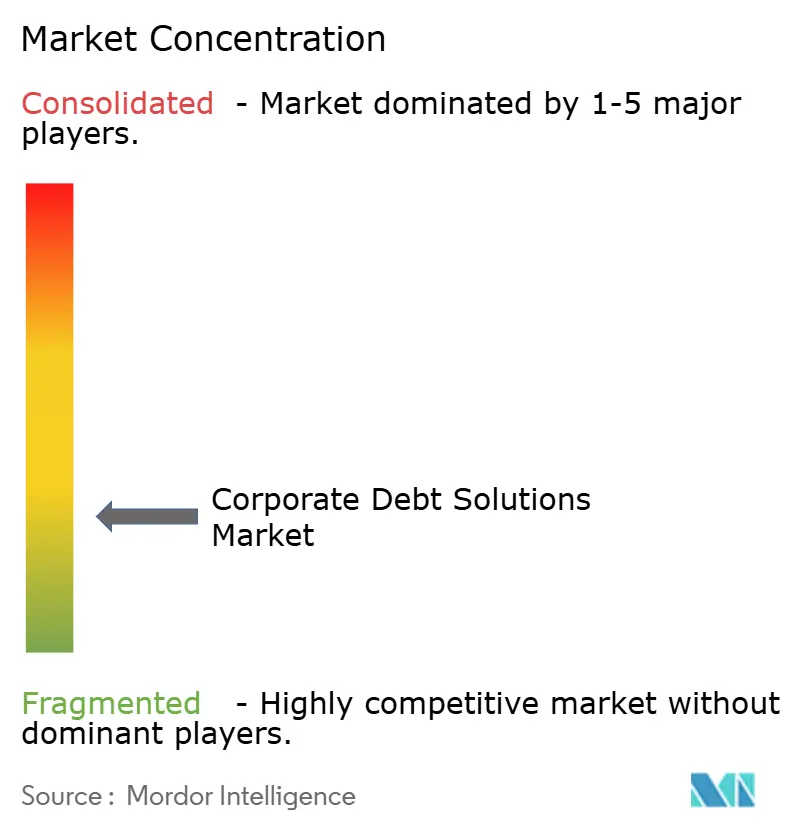
The corporate debt solutions market is fragmented. The 5 largest banks, JPMorgan, Bank of America, Citi, Morgan Stanley, and Goldman Sachs, held 35% of global investment banking fee wallet share in the first 5 months of 2026. Goldman Sachs reported USD 9.34 billion in investment banking fees for 2025, including USD 2.82 billion in debt underwriting. JPMorgan reported USD 2.88 billion in investment banking fees in the first quarter of 2026. Primary-market scale favors large universal banks, while independent advisers remain prominent in restructuring. Houlihan Lokey advised on 83 global distressed debt and bankruptcy transactions in 2025.
Technology adoption is becoming a major competitive consideration in the corporate debt solutions market. Deutsche Bank partnered with Google Cloud in August 2026 to deploy Gemini Enterprise for Financial Services across its Corporate Bank division. The deployment supports credit risk assessments, portfolio monitoring, and market news synthesis. DBS expanded agentic artificial intelligence tools to 1,500 employees globally during August 2026. The bank uses more than 70 specialized agents to convert raw information into credit memo drafts. These steps show how banks are seeking to reduce manual work in credit and advisory processes.
Independent advisers compete where mandates involve liability management, creditor representation, and complex restructurings. This part of the corporate debt solutions market can create conflicts for underwriting banks that have existing issuer relationships. Mid-market borrowers remain less fully served in integrated refinancing, debt monitoring, and covenant management. Debitos introduced its artificial intelligence due diligence solution in February 2026 for complex private credit transactions. Data and analytics platforms may challenge established fee positions in covenant monitoring and credit screening over time. The corporate debt solutions market consequently remains divided between scale-oriented banks and specialized advisory firms.
Recent Industry Developments
Corporate Debt Solutions Industry Leaders
J.P. Morgan Chase and Co.
Goldman Sachs Group, Inc.
Houlihan Lokey, Inc.
Rothschild and Co
PJT Partners Inc.
- *Disclaimer: Major Players sorted in no particular order

Recent Industry Developments
- August 2026: Google Cloud launched Gemini Enterprise for Financial Services with Deutsche Bank as its initial design partner, deploying artificial intelligence agents to automate credit risk assessments, portfolio monitoring, and market news synthesis across the bank’s Corporate Bank division.
- August 2026: Victory Capital Holdings entered into a definitive agreement to acquire First Eagle Investments for total consideration of USD 7 billion, financed through a new USD 3.5 billion term loan B, USD 950 million of new secured notes, and an upsized USD 200 million revolver.
- February 2026: Debitos launched artificial intelligence due diligence, an integrated solution intended to accelerate due diligence for complex private credit transactions.
- February 2026: Azul S.A. emerged from Chapter 11 bankruptcy after reducing funded debt by more than USD 1.3 billion, issuing USD 1.375 billion in first-lien exit notes, and securing up to USD 950 million in equity commitments.


Global Corporate Debt Solutions Market Report Scope
| Debt Origination, Underwriting and Syndication |
| Capital-Structure and Ratings Advisory |
| Liability-Management and Restructuring Advisory |
| Corporate Bonds and Notes |
| Syndicated Loans |
| Investment Grade |
| Non-investment Grade / Leveraged |
| Non-Financial Corporate Issuers |
| Financial-Institution Issuers (FIG) |
| Financial Sponsors |
| BFSI |
| Technology, Software and Digital Infrastructure |
| Manufacturing and Industrials |
| Energy, Utilities and Natural Resources |
| Real Estate and Construction |
| Healthcare and Life Sciences |
| Consumer, Retail and Leisure |
| Transportation and Logistics |
| Other Industries |
| North America | United States |
| Canada | |
| Mexico | |
| South America | Brazil |
| Argentina | |
| Rest of South America | |
| Europe | United Kingdom |
| Germany | |
| France | |
| Italy | |
| Spain | |
| Rest of Europe | |
| Asia-Pacific | China |
| Japan | |
| India | |
| South Korea | |
| Australia | |
| Indonesia | |
| Thailand | |
| Malaysia | |
| Singapore | |
| Vietnam | |
| Rest of Asia-Pacific | |
| Middle East and Africa | Saudi Arabia |
| United Arab Emirates | |
| Turkey | |
| South Africa | |
| Egypt | |
| Rest of Middle East and Africa |
| By Service Type | Debt Origination, Underwriting and Syndication | |
| Capital-Structure and Ratings Advisory | ||
| Liability-Management and Restructuring Advisory | ||
| By Debt Instrument | Corporate Bonds and Notes | |
| Syndicated Loans | ||
| By Credit Quality | Investment Grade | |
| Non-investment Grade / Leveraged | ||
| By Client Type | Non-Financial Corporate Issuers | |
| Financial-Institution Issuers (FIG) | ||
| Financial Sponsors | ||
| By Industry Vertical | BFSI | |
| Technology, Software and Digital Infrastructure | ||
| Manufacturing and Industrials | ||
| Energy, Utilities and Natural Resources | ||
| Real Estate and Construction | ||
| Healthcare and Life Sciences | ||
| Consumer, Retail and Leisure | ||
| Transportation and Logistics | ||
| Other Industries | ||
| By Geography | North America | United States |
| Canada | ||
| Mexico | ||
| South America | Brazil | |
| Argentina | ||
| Rest of South America | ||
| Europe | United Kingdom | |
| Germany | ||
| France | ||
| Italy | ||
| Spain | ||
| Rest of Europe | ||
| Asia-Pacific | China | |
| Japan | ||
| India | ||
| South Korea | ||
| Australia | ||
| Indonesia | ||
| Thailand | ||
| Malaysia | ||
| Singapore | ||
| Vietnam | ||
| Rest of Asia-Pacific | ||
| Middle East and Africa | Saudi Arabia | |
| United Arab Emirates | ||
| Turkey | ||
| South Africa | ||
| Egypt | ||
| Rest of Middle East and Africa | ||


Key Questions Answered in the Report
What is driving corporate debt solutions demand through 2031?
Refinancing needs, artificial intelligence capital expenditure, private credit expansion, and sustainable finance requirements are supporting activity through 2031.
How large is the corporate debt solutions sector in 2026?
The sector is valued at USD 66 billion in 2026 and is projected to reach USD 85 billion by 2031 at a 5.2% CAGR.
Which corporate debt solution service is growing fastest?
Liability-management and restructuring advisory is forecast to grow at a 7.6% CAGR through 2031.
Which debt instrument has the largest role in financing activity?
Corporate bonds and notes held 56.2% in 2025 and are forecast to grow at a 5.7% CAGR through 2031.
Which region is expanding fastest for corporate debt advisory?
Asia-Pacific is projected to grow at a 7.1% CAGR through 2031, supported by record Asian corporate bond issuance in 2025.
How concentrated is the corporate debt solutions sector?
The corporate debt solutions market receives a concentration score of 3 out of 10 because the top 5 banks held 35% of global investment banking fee wallet share in the first 5 months of 2026, while restructuring advisory remains fragmented.
Page last updated on:





