
Corporate Debt Market Size and Share
Market Overview
| Study Period | 2020 - 2031 |
|---|---|
| Market Size (2026) | USD 61.29 Billion |
| Market Size (2031) | USD 74.56 Billion |
| Growth Rate (2026 - 2031) | 4.00 % |
| Fastest Growing Market | Asia-Pacific |
| Largest Market | North America |
| Market Concentration | Low |
Major Players *Disclaimer: Major Players sorted in no particular order Image © Mordor Intelligence. Reuse requires attribution under CC BY 4.0. | |
Corporate Debt Market Analysis by Mordor Intelligence
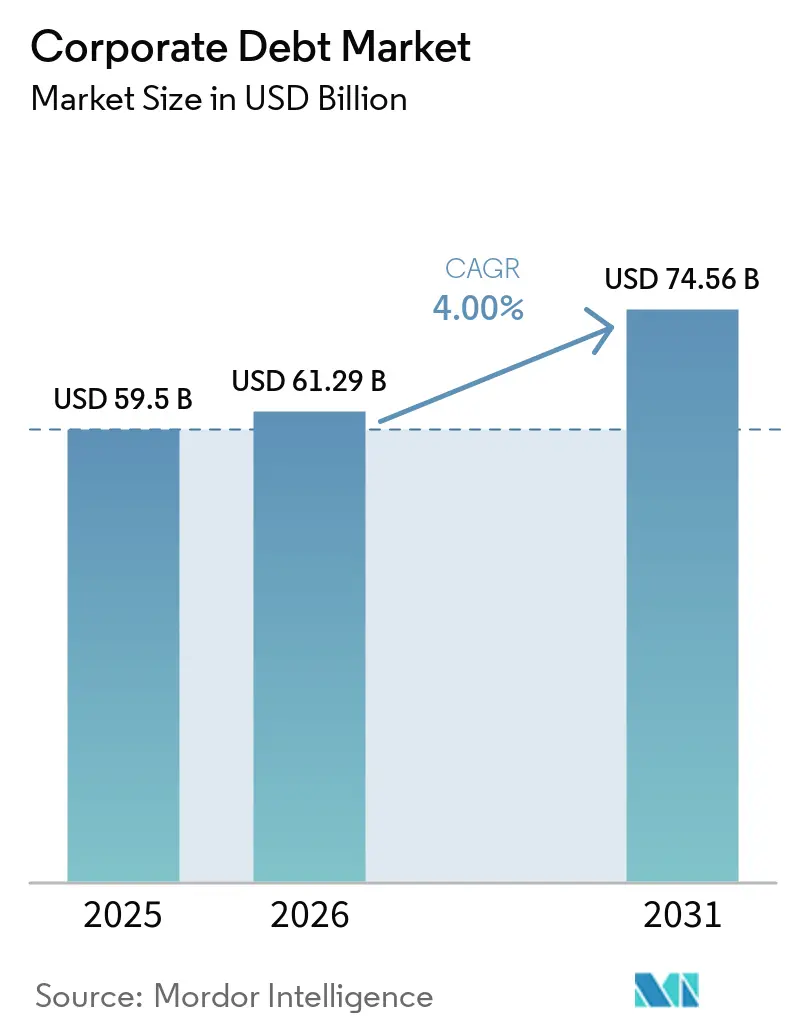
The Corporate Debt Market size is projected to be USD 59.5 billion in 2025, USD 61.29 billion in 2026, and reach USD 74.56 billion by 2031, growing at a CAGR of 4% from 2026 to 2031.
Corporate borrowing reached USD 13.7 trillion in 2025, including USD 6.8 trillion in corporate bonds and USD 7 trillion in syndicated loans, showing continued demand for external funding despite higher refinancing costs. Refinancing is expected to remain a central source of issuance because 24% of outstanding investment-grade debt and 31% of non-investment-grade debt were due within 3 years of the end of 2025. The corporate debt market is being shaped by large capital needs in technology, energy, and manufacturing, along with broader use of private credit. Higher rates create pressure for weaker borrowers, while established issuers can use public and private channels to manage maturities. This difference is likely to widen the gap in funding access and borrowing costs across credit profiles.
Key Report Takeaways
- By debt instrument, corporate bonds captured 61.22% of the corporate debt market share in 2025 and are projected to grow at a 4.34% CAGR through 2031.
- By credit quality, investment grade held 66.89% of the corporate debt market share in 2025, while unrated debt is projected to grow at a 5.42% CAGR through 2031.
- By issuer type, non-financial corporations captured 57.76% of overall corporate debt financing in 2025 and are projected to grow at a 4.73% CAGR through 2031.
- By industry sector, other sectors accounted for 47.68% of overall corporate debt financing in 2025, while technology, media, and telecommunications is projected to grow at a 6.81% CAGR through 2031.
- By geography, North America accounted for 39.92% of overall corporate debt financing in 2025, while Asia-Pacific is projected to grow at a 5.23% CAGR through 2031.
Note: Market size and forecast figures in this report are generated using Mordor Intelligence’s proprietary estimation framework, updated with the latest available data and insights as of January 2026.
Global Corporate Debt Market Trends and Insights
Drivers Impact Analysis*
| Driver | (~) % Impact on CAGR Forecast | Geographic Relevance | Impact Timeline |
|---|---|---|---|
| AI Infrastructure and Data-Center Financing Demand | +1.2% | Global, concentrated in North America with spillover to Asia-Pacific and Europe | Short term (≤ 2 years) |
| Corporate Refinancing and Debt Maturity Requirements | +0.8% | Global, most acute in North America and Western Europe | Short term (≤ 2 years) |
| External Debt Financing for Corporate Capital Expenditure | +0.6% | Global, led by North America and Asia-Pacific | Medium term (2-4 years) |
| Private Credit and Alternative Corporate Debt Channels | +0.5% | North America and Europe core, Asia-Pacific gaining | Medium term (2-4 years) |
| Increased Investor Risk Appetite and Corporate Credit Demand | +0.4% | Global | Short term (≤ 2 years) |
| Emerging-Market Corporate Debt Development | +0.5% | Asia-Pacific, Middle East and Africa, and South America | Long term (≥ 4 years) |
| Source: Mordor Intelligence | |||
AI Infrastructure and Data-Center Financing Is Reshaping the Bond Market's Sector Composition
AI infrastructure investment is a major source of additional corporate bond supply in the corporate debt market. The 5 largest hyperscalers issued USD 121 billion in United States corporate bonds during 2025, more than 4 times their USD 28 billion annual average in 2020 through 2024[1]https://www.reuters.com/business/retail-consumer/analysts-revise-ai-hyperscaler-debt-forecasts-after-amazon-bond-sale-2026-03-17/. Six major tech issuers had collectively issued approximately USD 244 billion in bonds by mid-2026, increasing the role of a small group of issuers in investment-grade credit markets. AI-related bonds represented 14% of the United States investment-grade market and exceeded banks as the largest sector in the JPMorgan United States Liquid Index. Hyperscalers had net leverage of 0.4–0.7x, compared with just under 3x for the rest of the investment-grade universe, though Morgan Stanley data show this leverage ratio rising sharply to approximately 1.8x by mid-2026 as issuance accelerated. A slowdown in AI spending could still affect index funds and pension portfolios with passive exposure.
Corporate Refinancing and the Maturity Wall Generate Structural Deal Flow
Rated global corporate debt maturing between 2025 and 2029 totals USD 12.4 trillion across bonds, loans, and revolving facilities[2]https://investorfactbook.spglobal.com/sp-global-ratings/global-corporate-debt-maturities-through-2029/. The United States component totals USD 5.9 trillion and is expected to peak at USD 1.461 trillion in 2028. In the United States alone, speculative-grade non-financial maturities are projected to rise from USD 254 billion in 2026 to USD 682 billion in 2028. Many issuers will refinance debt that was raised when policy rates were near zero, which can lift costs by 150 to 400 basis points over earlier coupons. Investment-grade companies are generally better positioned to absorb these costs than mid-market and B-rated borrowers. The resulting demand for amend-and-extend transactions and private credit restructurings supports deal flow even when broadly syndicated loan spreads tighten.
Growth of Private Credit and Alternative Corporate Debt Channels Challenges Public Market Primacy
Private credit assets under management surpassed USD 2 trillion in 2026 and could reach USD 3.4 trillion to USD 4 trillion by 2030[3]https://www.pwc.com/gx/en/industries/private-equity/private-credit-survey.html. Direct lending is comparable in scale with the broadly syndicated loan market at USD 1.5 trillion to USD 2 trillion. Apollo and Blackstone completed a USD 35 billion capital solution for Broadcom's AI XPV Platform in June 2026, which Apollo described as the largest private credit transaction on record. The transaction shows that private credit can serve counterparties that also have access to public bond markets. This expands the set of financing choices within the corporate debt market. Private credit could provide USD 800 billion for AI infrastructure financing over the following 4 years. Basel III capital requirements continue to limit some bank balance-sheet activities and expand the addressable lending base for non-bank providers.
Emerging-Market Corporate Debt Development Diversifies the Issuer Base
The hard-currency emerging-market corporate universe stands at USD 2.6 trillion, which is 1.4 times the size of the emerging-market sovereign bond universe[4]https://assets.im.natixis.com/en-au/insights/fixed-income/2026/meaningful-distinctions-emerging-market-corporate-bonds-versus-emerging-market-sovereigns?utm_source=chatgpt.com. The hard-currency emerging-market corporate universe stands at USD 2.6 trillion, which is 1.4 times the size of the emerging-market sovereign bond universe. Gross emerging-market corporate supply outside China reached a record USD 398 billion in 2025, with a 2026 supply forecast at USD 460 billion. Growing trade among emerging economies has reduced dependence on developed-market demand cycles for corporate credit. China's non-financial enterprise bond issuance reached CNY 13.94 trillion (USD 1.93 trillion) in 2025, and the outstanding stock reached CNY 31.29 trillion (USD 4.33 trillion). These developments broaden the issuer base within the corporate debt market.
Restraints Impact Analysis*
| Restraint | (~) % Impact on CAGR Forecast | Geographic Relevance | Impact Timeline |
|---|---|---|---|
| Higher Interest Costs and Refinancing Expenses | -0.8% | Global, most acute in North America and Western Europe | Short term (≤ 2 years) |
| Rising Corporate Leverage and Debt-Service Burdens | -0.5% | Global, concentrated in high-yield and non-investment-grade segments | Medium term (2-4 years) |
| Investor Absorption Constraints and Concentration Risk | -0.3% | North America and Europe | Short term (≤ 2 years) |
| Secondary-Market Liquidity and Market-Shock Vulnerability | -0.3% | Global, most acute in private credit and emerging-market segments | Medium term (2-4 years) |
| Source: Mordor Intelligence | |||
Higher Interest Costs and Refinancing Expenses Compress Margins for Weaker Borrowers
Refinancing at current rates is constraining issuance appetite among lower-rated borrowers in the corporate debt market. At the end of 2025, 15% of non-investment-grade debt carried an interest cost of 8% or more, compared with 9% in 2022. The proportion of debt priced at 2% or below fell from nearly 25% in 2021 to 14% in 2025. Software companies account for 16% of the leveraged loan market and face both AI-related revenue disruption and refinancing needs. United States investment-grade upgrades ran at a 3:1 ratio to downgrades in Q2 2026, though that broad result conceals pressure among weaker borrowers. United States dollar strength can further increase debt-service costs for emerging-market issuers with hard-currency obligations and local-currency revenue.
Rising Corporate Leverage and Debt-Service Burdens Signal Structural Fragility in Speculative-Grade Segment
Median net leverage for investment-grade borrowers has averaged 1.7x since 2021, but lower-quality debt and loan segments face greater stress in the corporate debt market. Of non-investment-grade debt maturing in 2026 through 2028, 67% was originally issued with coupons of 6% or less. B- and lower-rated companies have faced their maturity peak earlier than the broad market. Telecom issuers have USD 15.6 billion of B-rated or lower debt due within 24 months. Ares Management and Oaktree Capital have identified higher restructuring activity in parts of their private credit portfolios. The difference between resilient investment-grade balance sheets and stressed speculative-grade borrowers is therefore becoming more pronounced.
*Our forecasts treat driver/restraint impacts as directional, not additive. The impact forecasts reflect baseline growth, mix effects, and variable interactions.
Segment Analysis
By Debt Instrument: Corporate Bonds Anchor Issuance as Hybrid Structures Multiply
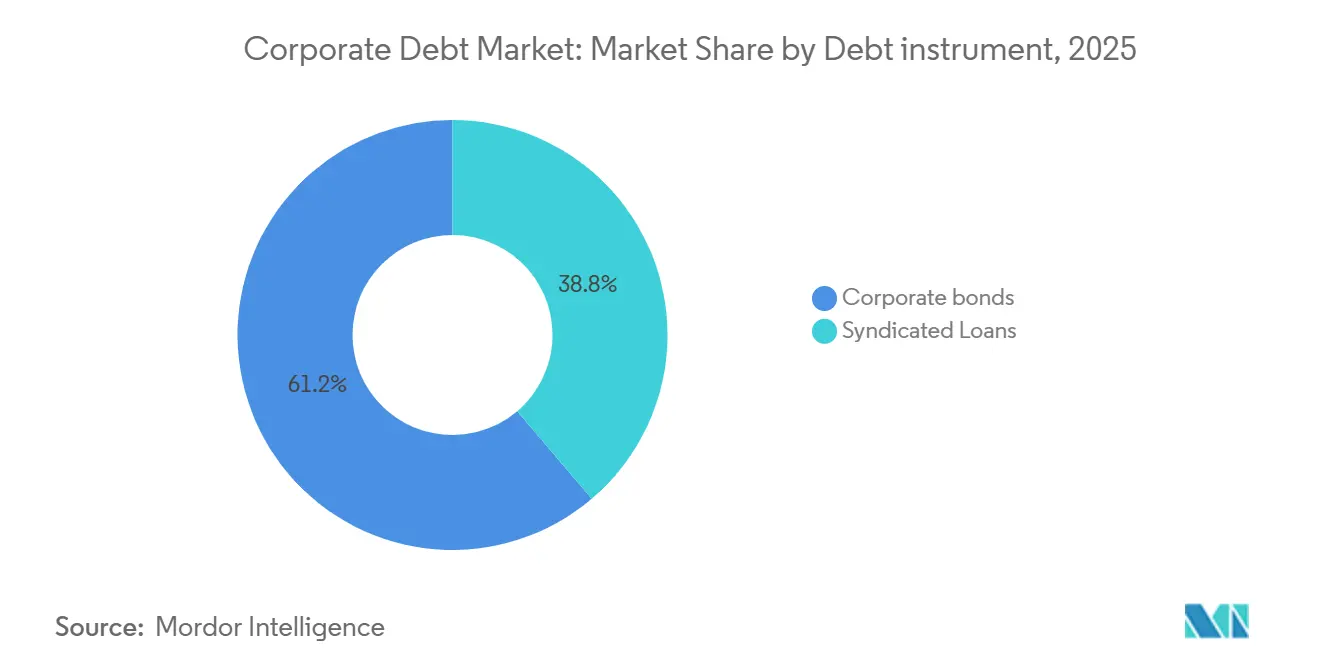
Corporate bonds held 61.22% of the corporate debt market size in 2025, while syndicated loans accounted for the remaining 38.78%. Corporate bonds are projected to grow at a 4.34% CAGR from 2026 to 2031, which makes the largest instrument segment the fastest-growing one. The share of United States investment-grade bonds that did not trade weekly fell to 10% in 2025. Public bond markets can efficiently support large transactions requiring substantial scale. These conditions have made public bond execution more competitive for large transactions.
United States corporate bond issuance reached USD 1.681 trillion through July 2026, up 26.9% year over year. Average daily trading volume increased 14.4% to USD 68.1 billion during the same period. Seven United States investment-grade deals of USD 25 billion or more had priced in 2026, equal to the total recorded in the preceding 7 years. Private credit assets under management reached USD 1.8 trillion in June 2025 and were on course to reach USD 2 trillion in 2026. AI-related private credit transactions totaled USD 59 billion in 2025, and their share of private credit deal value rose from 9% to 34%.


By Credit Quality: Investment Grade Anchors Volumes While Unrated Segment Captures Fastest Growth
Investment-grade held 66.89% of overall corporate debt financing in 2025, supported by demand from pension funds, insurers, and sovereign wealth funds. Unrated debt is forecast to grow at a 5.42% CAGR through 2031, the highest rate within the credit quality segmentation. Investment-grade companies generated USD 768 billion in net issuance during 2025. Financial and non-financial companies each accounted for a broadly equal share of that investment-grade issuance. Investment-grade volumes continued to provide the core of high-quality corporate debt issuance.
Unrated debt is expanding as first-time emerging-market issuers and smaller mid-market companies access capital without the cost and delay of a public rating. The 3:1 ratio of United States investment-grade upgrades to downgrades in Q2 2026 supported investment-grade issuance despite elevated absolute yields. AI-tagged bonds represented 15% of the United States investment-grade market in 2025, raising sector and duration concentration in a segment typically valued for diversification. Joint-venture-backed 144A bonds for AI data-center campuses add exposure that may not be fully visible on issuer balance sheets. Enhanced SEC disclosure rules and the EU prospectus regulation are improving disclosure for new unrated issuers.
By Issuer Type: Non-Financial Corporations Drive Market Expansion Across Capital Expenditure Cycles
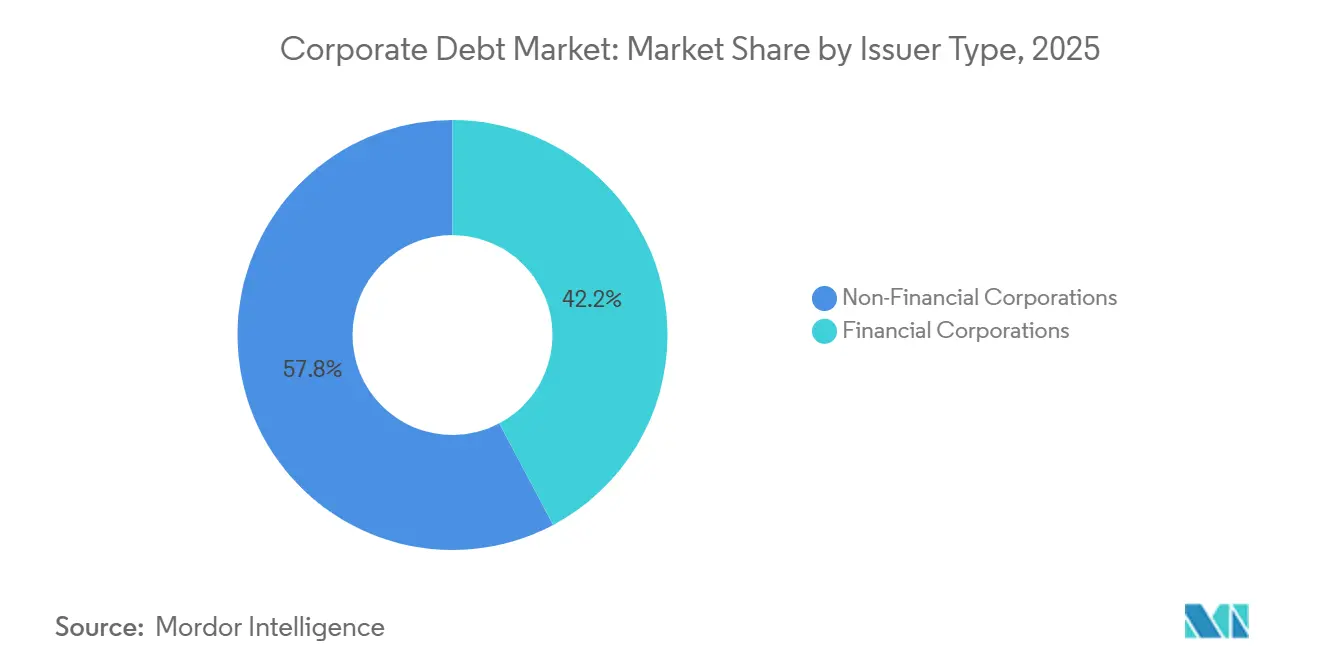
Non-financial corporations captured 57.76% of overall corporate debt financing in 2025 and are forecast to grow at a 4.73% CAGR through 2031. Financial corporations held the remaining 42.24% of the corporate debt market in 2025. United States investment-grade non-financial issuance reached USD 726 billion in the first half of 2026. This total represented 70% of the aggregate United States investment-grade supply. Technology companies contributed USD 210 billion of this issuance.
Oracle expects to raise USD 45 billion to USD 50 billion through debt and equity in 2026 to build cloud infrastructure. Amazon also issued USD 25 billion in bonds, showing the financing needs created by non-financial corporate capital expenditure. Banks, insurers, and asset managers are adjusting balance-sheet approaches in response to capital rules and competition from private credit. Ares Management has expanded structured bank partnerships and asset-based finance, which it identifies as a USD 28 trillion addressable opportunity. These arrangements maintain origination volumes while transferring more risk from regulated balance sheets to alternative asset managers.
By Industry Sector: Technology, Media, and Telecommunications Leads While Diversified Sectors Provide Scale
Technology, media, and telecommunications are forecast to grow at a 6.81% CAGR through 2031, making it the fastest-growing corporate debt industry segment. Other sectors held 47.68% of overall corporate debt financing in 2025 and included energy and utilities, industrials and manufacturing, healthcare and life sciences, consumer products and services, and real estate. Hyperscaler investment and a broader base of data-center, semiconductor, and telecom tower issuers are driving TMT financing requirements. TMT companies could raise USD 400 billion in United States high-grade debt during 2026. Technology could contribute USD 252 billion, media and entertainment USD 85 billion, and telecom USD 56 billion of this financing.
Energy and utilities represent 16% of total non-financial outstanding bond stock. United States investment-grade utility issuance reached USD 135 billion in 2025 and is projected at USD 145 billion in 2026 as data-center demand requires grid and generation expansion. Industrials and manufacturing account for 29% of non-financial outstanding debt and benefit from reshoring incentives in North America and Europe. Healthcare and life sciences issuance is supported by merger financing and biopharma licensing transactions, while real estate is recovering outside the distressed office subsector as REIT balance sheets stabilize. China's technology innovation bonds, introduced in May 2025, supported industrial bond issuance as total non-financial enterprise issuance reached CNY 13.94 trillion, equivalent to USD 1.93 trillion, in 2025.
Geography Analysis
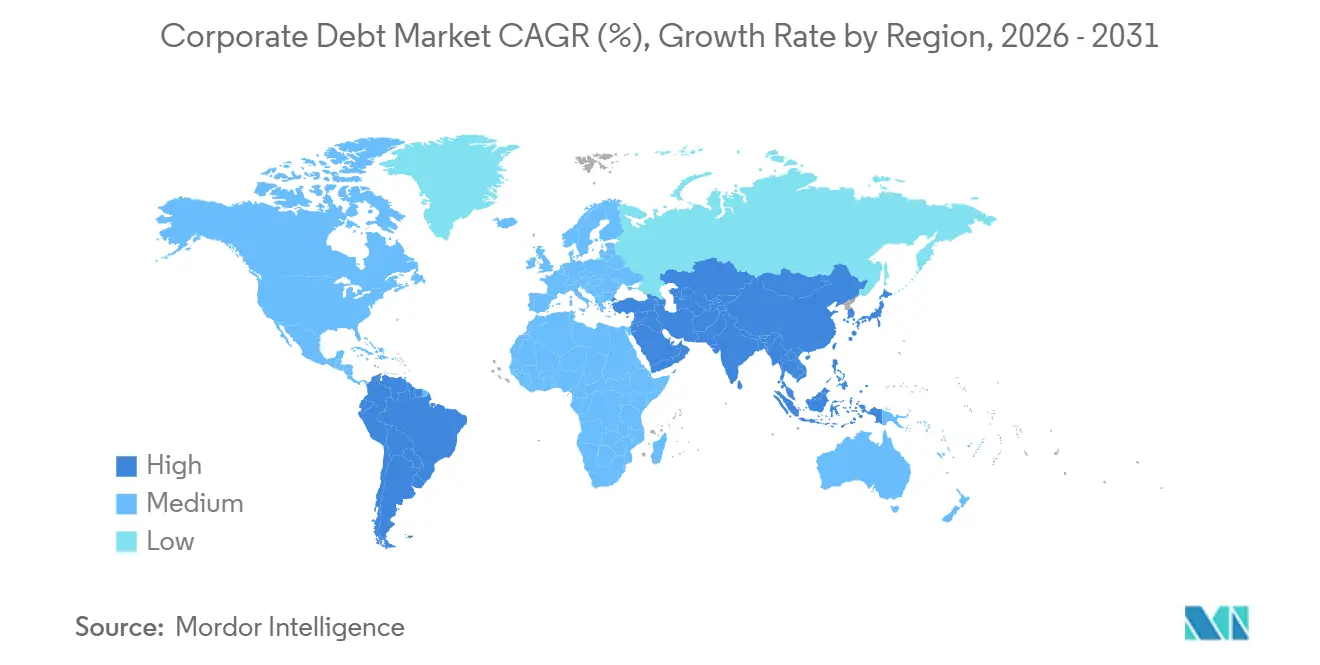
North America held 39.92% of overall corporate debt financing in 2025, supported by the depth of the United States investment-grade and high-yield bond markets. United States investment-grade outstanding bonds totaled USD 11.7 trillion in Q1 2026. United States investment-grade issuance is tracking toward USD 1.81 trillion in 2026 as AI capital spending and merger activity lift supply. The United States corporate debt due from 2025 through 2029 totals USD 5.9 trillion and is expected to peak at USD 1.461 trillion in 2028. Electronic trading accounted for 50% of United States corporate bond trading in November 2025 and has reduced execution costs while broadening retail participation.
Europe remains a significant source of corporate debt market activity, with issuance centered in the United Kingdom, Germany, France, Italy, and Spain. Euro-denominated foreign-currency credit grew at an 11% annual rate in 2025, bringing outstanding amounts to EUR 4.9 trillion. European disclosure requirements, including the Corporate Sustainability Reporting Directive and the European Green Bond Standard, are shaping issuer practices in sustainable debt. Brazil raised USD 5.9 billion in sovereign bonds in April 2026, while non-financial emerging-market corporate issuance outside China rose 66% year over year in that month. Emerging-market growth is projected at 4.1% in 2026, which is 2.6 percentage points higher than developed-market growth.
Asia-Pacific is projected to grow at a 5.23% CAGR through 2031, the highest regional rate in the corporate debt market. Asian international bond issuance increased 14% in 2025 to USD 527 billion, while ASEAN issuance recovered 31% above the 2022 through 2024 average. China accounts for most Asian corporate bond issuance, while India, Japan, South Korea, and Singapore are expanding domestic and international debt markets. The Middle East and Africa are seeing higher issuance tied to sovereign infrastructure programs, with Saudi Arabia, the UAE, and South Africa leading activity in the corporate debt market. Digital bond activity is also increasing the region's connection with global capital-market infrastructure.

Competitive Landscape
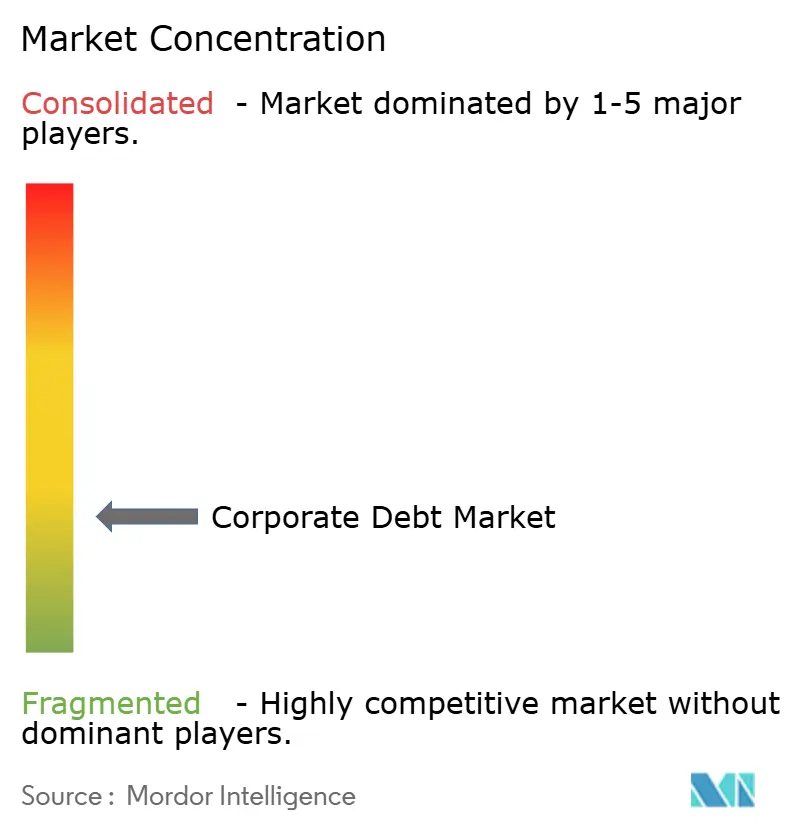
The corporate debt market is fragmented. Bulge-bracket banks lead primary bond underwriting and syndicated loan origination. Alternative asset managers are expanding their direct lending operations and increasingly compete with and partner with these banks. JPMorgan, Goldman Sachs, Bank of America, Citigroup, Morgan Stanley, Barclays, BNP Paribas, Deutsche Bank, HSBC, and Wells Fargo remain active across investment-grade and leveraged underwriting. Apollo, Ares, Blackstone, KKR, Blue Owl, BlackRock, HPS Investment Partners, Oaktree, Carlyle Group, and Golub Capital operate direct lending platforms that match the broadly syndicated loan market in scale.
JPMorgan and Goldman Sachs formed a partnership with Apollo in May 2025 to syndicate and trade investment-grade private credit. Apollo's June 2026 USD 35 billion Broadcom transaction included Goldman Sachs, Wells Fargo, BNP Paribas, Citigroup, Bank of America, and Morgan Stanley as co-arrangers or placement agents. These arrangements demonstrate how banks and alternative managers can combine distribution, underwriting, and balance-sheet capacity. Mid-market lending remains relevant where financing needs exceed the capacity of a single lender but do not fit public bond issuance. Specialized financing for energy transition and AI infrastructure is also becoming a more important area of competition in the corporate debt market.
AI-enabled underwriting, real-time credit surveillance, and digital bond issuance are becoming operational differentiators in the corporate debt market. The SEC's private-placement disclosure framework, the EU DLT Pilot Regime, and SEBI's tokenized bond pilot are shaping compliance requirements for market participants. Firms with legal, technology, and distribution capabilities are better placed to meet these requirements at scale. Blackstone, Apollo, and KKR have disclosed investments in proprietary AI risk-assessment systems. The largest institutions retain advantages in execution, investor access, and the ability to support complex financings.
Corporate Debt Industry Leaders
JPMorgan Chase & Co.
Citigroup Inc.
Bank of America Corporation
Goldman Sachs Group, Inc.
Morgan Stanley
- *Disclaimer: Major Players sorted in no particular order

Recent Industry Developments
- August 2026: Bank of America agreed to invest approximately USD 1.9 billion for up to a 49.9% stake in Jio Credit, Jio Financial Services’ lending subsidiary, expanding its presence in India’s growing digital-credit market.
- August 2026: Goldman Sachs agreed to acquire NEOS Investments, adding approximately USD 30 billion across 19 options-based income ETFs and expanding its active ETF platform.
- June 2026: Apollo Global Management and Blackstone complete a USD 35 billion capital solution for Broadcom's AI XPV Platform, the largest private credit deal on record. Goldman Sachs, Wells Fargo, BNP Paribas, Citi, Bank of America, and Morgan Stanley served as co-arrangers or placement agents, with USD 15 billion of the paper expected to become tradeable by early 2027.
- June 2026: VEON closes a USD 1.4 billion dual-tranche senior unsecured notes offering through VEON Midco B.V., refinancing substantially all 2027 maturities ahead of schedule. The deal attracted demand exceeding the tender threshold and reflects the telecom sector's proactive maturity management ahead of the 2028 speculative-grade debt peak.


Global Corporate Debt Market Report Scope
| Corporate Bonds |
| Syndicated Loans |
| Investment Grade |
| Non-Investment Grade |
| Unrated |
| Financial Corporations |
| Non-Financial Corporations |
| Energy and Utilities |
| Industrials and Manufacturing |
| Technology, Media and Telecommunications |
| Healthcare and Life Sciences |
| Consumer Products and Services |
| Real Estate |
| Other Sectors |
| North America | United States |
| Canada | |
| Mexico | |
| South America | Brazil |
| Argentina | |
| Rest of South America | |
| Europe | United Kingdom |
| Germany | |
| France | |
| Italy | |
| Spain | |
| Rest of Europe | |
| Asia-Pacific | China |
| Japan | |
| India | |
| South Korea | |
| Australia | |
| Indonesia | |
| Thailand | |
| Malaysia | |
| Singapore | |
| Vietnam | |
| Rest of Asia-Pacific | |
| Middle East and Africa | Saudi Arabia |
| United Arab Emirates | |
| Turkey | |
| South Africa | |
| Egypt | |
| Rest of Middle East and Africa |
| By Debt Instrument | Corporate Bonds | |
| Syndicated Loans | ||
| By Credit Quality | Investment Grade | |
| Non-Investment Grade | ||
| Unrated | ||
| By Issuer Type | Financial Corporations | |
| Non-Financial Corporations | ||
| By Industry Sector | Energy and Utilities | |
| Industrials and Manufacturing | ||
| Technology, Media and Telecommunications | ||
| Healthcare and Life Sciences | ||
| Consumer Products and Services | ||
| Real Estate | ||
| Other Sectors | ||
| By Geography | North America | United States |
| Canada | ||
| Mexico | ||
| South America | Brazil | |
| Argentina | ||
| Rest of South America | ||
| Europe | United Kingdom | |
| Germany | ||
| France | ||
| Italy | ||
| Spain | ||
| Rest of Europe | ||
| Asia-Pacific | China | |
| Japan | ||
| India | ||
| South Korea | ||
| Australia | ||
| Indonesia | ||
| Thailand | ||
| Malaysia | ||
| Singapore | ||
| Vietnam | ||
| Rest of Asia-Pacific | ||
| Middle East and Africa | Saudi Arabia | |
| United Arab Emirates | ||
| Turkey | ||
| South Africa | ||
| Egypt | ||
| Rest of Middle East and Africa | ||


Key Questions Answered in the Report
What is driving growth in corporate debt?
AI infrastructure spending, refinancing demand, corporate capital expenditure, and wider use of private credit support expansion through 2031.
How large is corporate debt in 2026?
The sector is estimated at USD 61.3 trillion in 2026 and is forecast to reach USD 74.6 trillion by 2031.
Which debt instrument leads corporate financing?
Corporate bonds held 61.22% in 2025 and are forecast to grow at a 4.34% CAGR through 2031.
Which credit quality segment is growing fastest?
Unrated debt is forecast to expand at a 5.42% CAGR through 2031 as more first-time issuers access debt capital.
Which region is expanding fastest for corporate debt issuance?
Asia-Pacific is forecast to grow at a 5.23% CAGR through 2031, supported by expanding debt markets across China, India, Japan, South Korea, and Singapore.
What is the main risk facing corporate borrowers?
Higher refinancing costs are most challenging for lower-rated issuers that need to replace low-coupon debt at current interest rates.
Page last updated on:





