
Contraband Detector Market Size and Share
Market Overview
| Study Period | 2021 - 2031 |
|---|---|
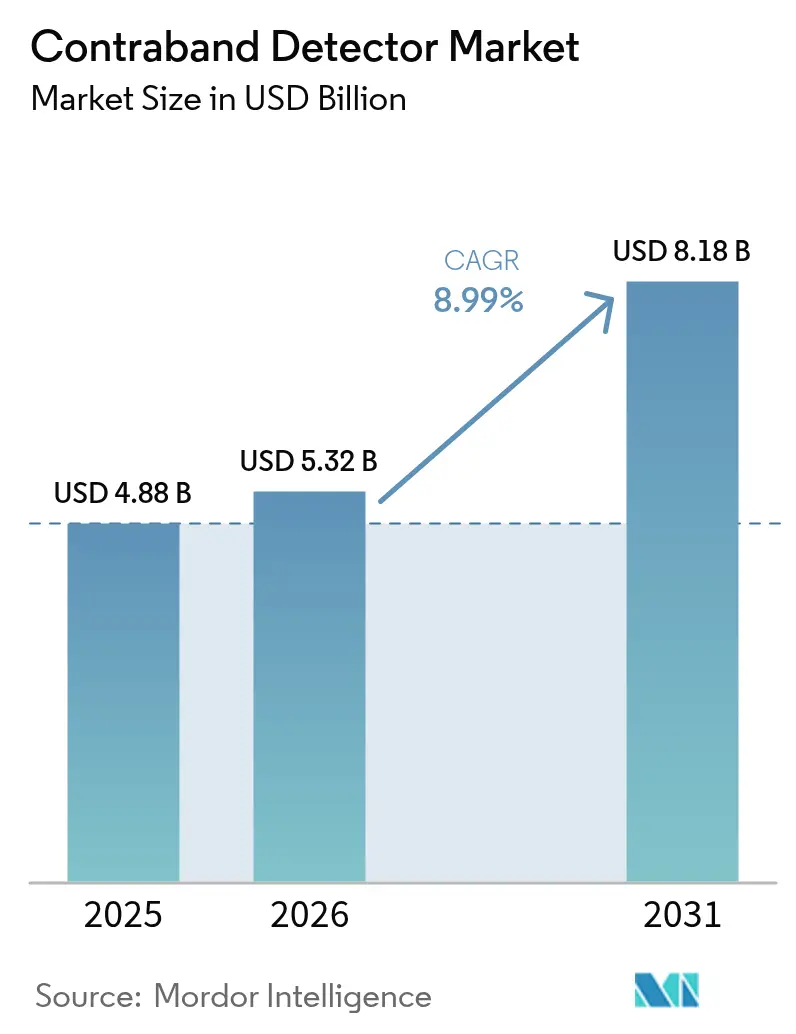
| Market Size (2026) | USD 5.32 Billion |
| Market Size (2031) | USD 8.18 Billion |
| Growth Rate (2026 - 2031) | 8.99 % |
| Fastest Growing Market | Asia Pacific |
| Largest Market | North America |
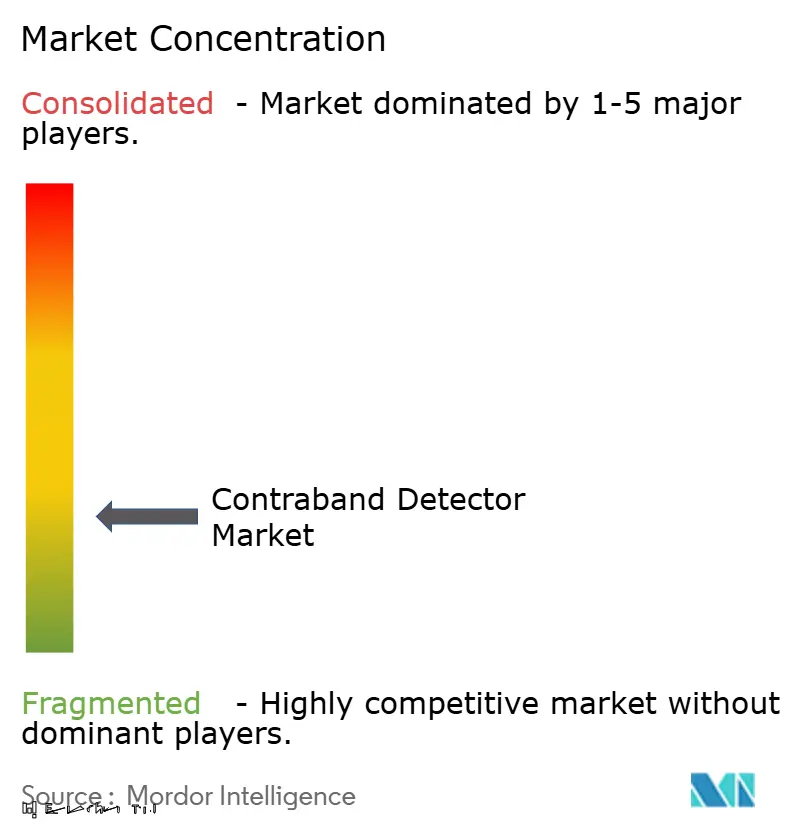
| Market Concentration | Low |
Major Players *Disclaimer: Major Players sorted in no particular order Image © Mordor Intelligence. Reuse requires attribution under CC BY 4.0. | |
Contraband Detector Market Analysis by Mordor Intelligence
The Contraband Detector Market size is expected to grow from USD 4.88 billion in 2025 to USD 5.32 billion in 2026 and is forecast to reach USD 8.18 billion by 2031 at 8.99% CAGR over 2026-2031. Equipment upgrades are propelled by regulatory deadlines for air-cargo screening, the surge in synthetic opioid trafficking, and national infrastructure programs that modernize airports, seaports, and land borders. Budgeted investments including the Transportation Security Administration’s USD 89.6 million for new checkpoint property screening systems and USD 9.3 million for credential-authentication units demonstrate institutional commitment to next-generation capabilities.[1]Transportation Security Administration, “Fiscal Year 2025 President’s Budget Request for the Transportation Security Administration,” tsa.gov Suppliers capture predictable demand by offering modular platforms that integrate AI-enabled analytics, lower false-alarm rates, and support interoperability with existing command-and-control frameworks. At the same time, supply-chain friction in semiconductors and rising component costs compress margins, encouraging vendors to emphasize software, services, and threat-library subscriptions to defend profitability.
Key Report Takeaways
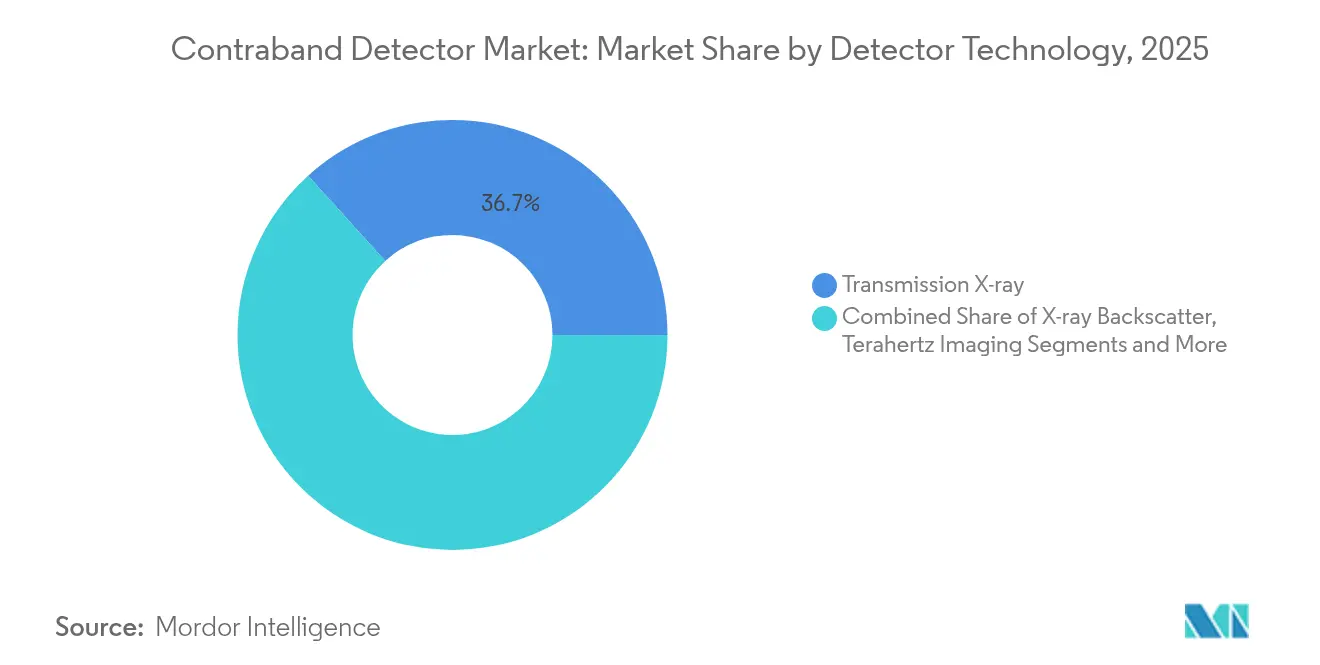
- By detector technology, transmission X-ray held 36.72% of contraband detector market share in 2025, while terahertz imaging is poised to post the fastest 9.96% CAGR through 2031.
- By mobility, fixed installations contributed 67.35% revenue in 2025; portable systems are projected to expand at a 9.55% CAGR to 2031.
- By screening target, drugs and narcotics retained a 41.62% share of the contraband detector market size in 2025, whereas currency detection is set to grow at 9.18% CAGR.
- By end-user, airports led with 50.55% revenue in 2025; seaports and land borders are expected to register an 8.45% CAGR through 2031.
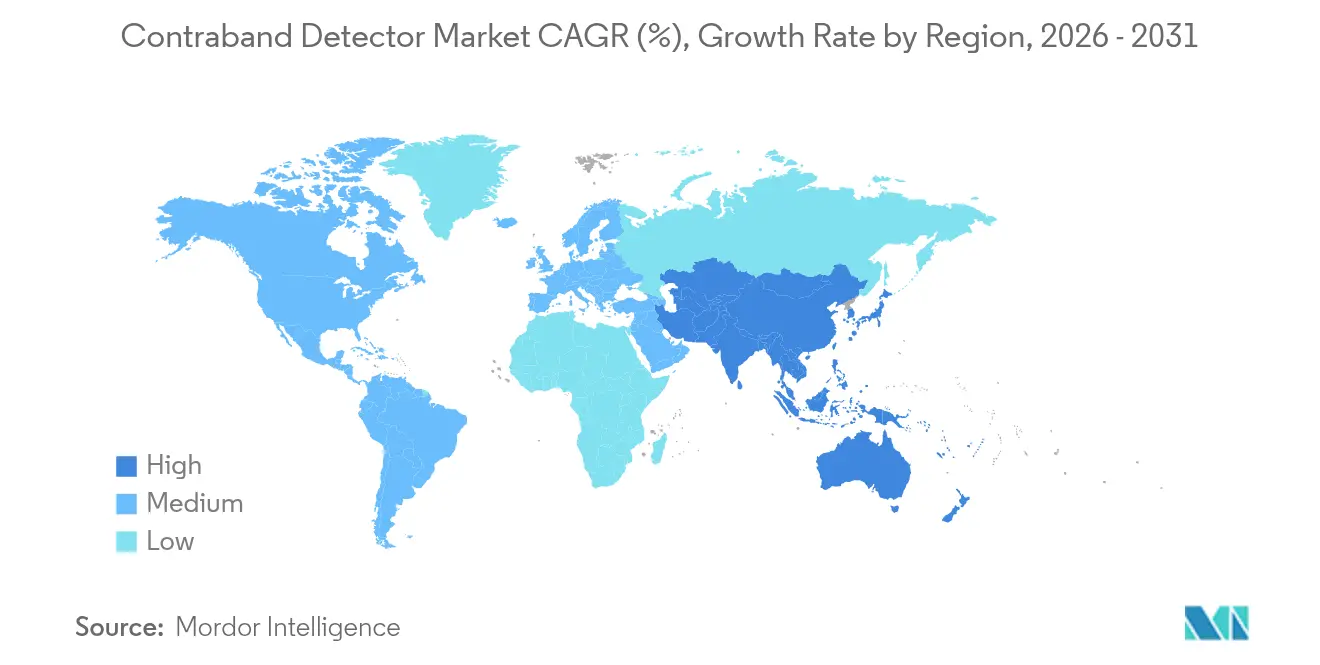
- By geography, North America accounted for 37.58% of global revenue in 2025, while Asia-Pacific is on track for a 9.94% CAGR.
Note: Market size and forecast figures in this report are generated using Mordor Intelligence’s proprietary estimation framework, updated with the latest available data and insights as of 2026.
Market Trends and Insights
Drivers Impact Analysis of Contraband Detector Market*
| Driver | ( ~) % Impact on CAGR Forecast | Geographic Relevance | Impact Timeline |
|---|---|---|---|
| Mandated air-cargo screening deadlines | +1.8% | North America & EU | Medium term (2-4 years) |
| Synthetic opioid trafficking surge | +2.1% | Global, concentrated in North America | Short term (≤ 2 years) |
| Land-border modernization programs | +1.5% | North America, Asia-Pacific | Long term (≥ 4 years) |
| 3PL security gaps from e-commerce returns | +1.2% | Global, led by North America & Asia | Medium term (2-4 years) |
| AI-enabled image analytics adoption | +1.7% | Global | Short term (≤ 2 years) |
| Cash-handling needs from legal cannabis | +0.9% | North America, selective EU | Medium term (2-4 years) |
| Source: Mordor Intelligence | |||
Mandated Air-Cargo Screening Deadlines Drive Technology Upgrades
Regulatory compliance deadlines in the United States and European Union compel airport operators to refresh detection fleets ahead of standard replacement cycles. The European Commission’s reinstatement of liquid-carry limitations for C3 scanners in September 2024 forced hubs to operate dual screening lanes, increasing demand for high-speed computed-tomography (CT) lanes that preserve throughput without sacrificing detection depth. Munich Airport’s CT rollout in Terminal 2 exceeded USD 150,000 per unit and showcases the capital intensity airports are willing to absorb to ensure compliance.[2]RAND Corporation, “Supply Chain Uncertainty: Building Resilience in the Face of Impending Threats,” rand.org Airports Council International Europe criticized frequent regulatory reversals, arguing that uncertainty depresses ROI on early technology adoption, yet major hubs such as Frankfurt are pressing forward with AI-powered scanners that sustain passenger throughput while meeting evolving standards.
Synthetic Opioid Trafficking Intensifies Detection Technology Demands
International parcel networks remain the preferred channel for fentanyl traffickers, pressuring customs agencies to procure molecular-level detection capabilities. Customs and Border Protection’s recent USD 16.86 million contract for AI-enhanced X-ray algorithms targets fentanyl identification inside unopened parcels. DHS’s Rapid Technologies for Drug Interdiction program pursues non-intrusive techniques to analyze chemical signatures without opening packages, alleviating throughput constraints. Industry suppliers such as Smiths Detection responded with the SDX 10060 XDi X-ray diffraction system, which analyzes molecular lattices to improve narcotics accuracy. Together, these actions shift procurement preferences toward detectors capable of real-time chemical analysis integrated with AI analytics.
Infrastructure Modernization Programs Accelerate Border Technology Adoption
Government stimulus targeting ports and land crossings generates multi-year procurement pipelines for mobile and fixed high-energy systems. OSI Systems booked a USD 32 million order for Eagle M60 mobile inspection units supporting these initiatives. The U.S. Government Accountability Office notes automation is now embedded in all 10 largest domestic container ports, streamlining cargo flows and embedding security screening at each automation touchpoint.[3]Asian Development Bank, “Asia-Pacific Trade Facilitation Report 2024,” adb.org In Asia-Pacific, digital trade-facilitation projects cut costs by 11% while mandating interoperable detection technologies across customs operations, expanding the install base for advanced scanners.
E-commerce Growth Exposes 3PL Security Vulnerabilities
Reverse-logistics volumes rose sharply with e-commerce returns, placing contraband risk inside third-party logistics (3PL) facilities designed for speed, not security. Cargo theft incidents in the United States and Canada topped 24,000 in 2024, a 16% year-over-year jump. Logistics operators are installing AI video analytics and automated container-data capture to seal vulnerabilities and satisfy shippers’ insurance requirements. Detector vendors leverage this pressure by offering scalable, portable scanners that integrate directly into warehouse management systems and provide API access for security-operations-center dashboards.
Restraints Impact Analysis of Contraband Detector Market*
| Restraint | ( ~) % Impact on CAGR Forecast | Geographic Relevance | Impact Timeline |
|---|---|---|---|
| High total cost of CT & neutron systems | -1.4% | Asia-Pacific, Middle East, Africa | Long term (≥ 4 years) |
| Privacy & radiation concerns in EU rail | -0.8% | Europe | Medium term (2-4 years) |
| Government budget freezes | -1.1% | Global | Short term (≤ 2 years) |
| Shortage of skilled operators | -0.7% | Global, acute in developing markets | Medium term (2-4 years) |
| Source: Mordor Intelligence | |||
High Total Cost of Ownership Constrains Advanced System Adoption
CT and neutron-activation platforms require specialized shielding and ongoing operator certification, pushing life-cycle costs beyond the reach of smaller ports. RAND analysis shows supply-chain uncertainty and tariffs inflate semiconductor costs, delaying production runs and pushing acquisition budgets above initial estimates. Airports Council International Europe cites cases where airports paid substantial premiums for advanced scanners, only to face new usage restrictions that obscure payback periods. Consequently, developing markets often defer upgrades, limiting global penetration of neutron-based solutions despite their superior performance against shielded nuclear materials.
Government Budget Constraints Create Procurement Volatility
Public-sector buyers dominate the contraband detector market, yet fiscal cycles remain unpredictable. Although DHS received USD 836.1 million R&D funding for FY 2025, continuing-resolution scenarios can stall deployments for an entire fiscal year. The GAO’s evaluation of unauthorized-drone counter-measures at airports underscores how legislation lags technology readiness, freezing procurement even where solutions exist. Vendors hedge this volatility by diversifying into service contracts, leasing models, and outcome-based financing to stabilize revenue streams when large tenders slip.
*Our forecasts treat driver/restraint impacts as directional, not additive. The impact forecasts reflect baseline growth, mix effects, and variable interactions.
Contraband Detector Market Segment Analysis
By Detector Technology:
AI Integration Accelerates Advanced Imaging AdoptionTransmission X-ray technology retained 36.72% revenue in 2025, anchoring the contraband detector market through its installed base and cost-efficient upgrades. In contrast, terahertz imaging is set for a 9.96% CAGR, bolstered by passive systems that detect metallic and non-metallic threats without ionizing radiation. The European Space Agency reports its THz cameras now operate in 18 countries, spotting concealed weapons up to 10 meters away. Computed-tomography lanes continue to replace legacy 2-D scanners at airports, driving service revenue from algorithm updates. Neutron activation remains niche, constrained by shielding costs, but remains irreplaceable for shielded nuclear-material detection.
Terahertz’s momentum stems from academia-to-industry spinouts. For instance, Cambridge Terahertz commercialized MIT research into radar-style THz imaging that produces 3-D point clouds, expanding opportunities in high-footfall venues. AI overlay drives adoption of millimeter-wave personnel scanners in corrections and event venues, minimizing privacy concerns through automatic anomaly visualization rather than raw body images. Trace detection based on ion-mobility spectrometry persists in parcel-screening operations, merging with AI classification to prioritize manual swabs. Vendors thus position multitechnology suites under a single UI, reinforcing replacement-cycle lock-in.



By Mobility:
Portable Systems Gain Ground Through Operational FlexibilityFixed portals and gantry units anchored 67.35% of 2025 revenue, but portable devices are outperforming with a 9.55% CAGR as agencies seek rapid deployment for pop-up checkpoints and ad hoc border missions. Missouri’s Department of Corrections deployed Tek 84 Intercept full-body scanners costing roughly USD 150,000 each to curb contraband flow in prisons. DHS is piloting handheld millimeter-wave wands to reduce pat-downs at stadium entrances, exploiting AI to highlight anomalies directly on device displays. Interoperability guidelines from U.S. Customs and Border Protection require that portable units feed event logs to central security information management platforms, driving software-defined architectures.
AI-enabled pattern recognition further tilts cost-benefit calculations toward portable gear by reducing operator training hours. Field agents can upload threat images to shared cloud libraries, ensuring consistent detection across dispersed sites. As a result, manufacturers bundle ruggedized tablets, cellular connectivity, and software-as-a-service licenses into multiyear agreements that smooth revenue beyond initial hardware sales.
By Screening Target:
Currency Detection Emerges as Fastest-Growing ApplicationDrugs and narcotics retained 41.62% of 2025 revenue, reflecting persistent synthetic-opioid interdiction priorities, yet currency detection is advancing at 9.18% CAGR through 2031. Cannabis seizures at UK airports tripled to 15 tonnes in 2024, spotlighting cash-intensive smuggling linked to legal-market arbitrage. Transportation Security Administration policy mandates that screeners summon law enforcement when large cash quantities surface without explanation, prompting airports to adopt dual-energy X-ray image-analytics models that isolate currency stacks. Explosives detection remains compulsory for aviation compliance, while weapons screening is expanding in K-12 schools and universities deploying walk-through imaging portals with AI weapons-classification algorithms.
Currency-focused deployments typically piggyback on existing lanes, yet require algorithmic retraining to discriminate between legitimate and suspicious holdings. Vendors monetize this retraining under subscription models tied to contraband detector market size for services, reinforcing the aftermarket growth narrative.
By End-User:
Seaports Drive Growth Through Infrastructure ModernizationAirports maintained a 50.55% revenue share in 2025, benefitting from regulatory-driven CT rollouts and AI vision upgrades, yet seaports and land borders will generate the fastest 8.45% CAGR by 2031. OSI Systems secured a USD 76 million aviation order for RTT 110 CT hold-baggage units and Itemiser 5X trace detectors, underscoring resilient airport demand. On the maritime front, the Port of Virginia is piloting autonomous drones for hazardous-material inspection and search-and-rescue, integrating scan data with fixed high-energy portals to create layered security.
Correctional facilities and law-enforcement agencies are scaling body-scanner adoption to mitigate contraband inflows, while public-transport hubs deploy non-ionizing millimeter-wave units to maintain passenger throughput. Retail and government campuses represent emerging verticals for small-footprint portals with cloud-based threat-analytics engines, extending the contraband detector market’s total addressable base.

By Sales Channel:
Aftermarket Services Gain Importance Through Technology ComplexityNew-equipment sales still produced 73.25% of 2025 revenue, but aftermarket and services are compounding at 8.78% by 2031 as AI-driven detection requires ongoing algorithm updates, cyber-hardening, and certifications. Smiths Detection invests roughly 4% of revenue in R&D to sustain threat-library refreshes and performance validation.
Leidos markets enterprise software overlays that fuse scanner outputs with open-source intelligence to deliver risk-scoring dashboards for port operators. These offerings embed vendors deeper into customer operations, shifting competitive dynamics from hardware price to lifecycle-value propositions.
Geography Analysis
North America Contraband Detector Market
North America generated 37.58% of global revenue in 2025, benefitting from structured procurement and well-funded federal mandates. TSA installed 2,000 credential-authentication units and 267 CT lanes across domestic checkpoints, solidifying its status as lead adopter and reference customer. Yet supply-chain constraints and budget-resolution delays occasionally stall rollouts, prompting program offices to favor modular upgrades that extend existing assets.
Europe Contraband Detector Market
Europe follows close behind on the strength of harmonized aviation security codes and the Common Evaluation Process framework for equipment approval. Nevertheless, abrupt regulatory reversals such as the 2024 decision to reinstate liquid restrictions erode operator confidence and may slow adoption of costly scanners. Frontex seizures at EU external borders underline the need for advanced cargo solutions, while privacy concerns in rail networks drive demand for non-ionizing modalities.
APAC Contraband Detector Market
Asia-Pacific constitutes the fastest-growing region at a 9.94% CAGR. Trade-facilitation corridors and cross-border e-commerce volumes motivate customs agencies to digitize risk management. China’s Smart Customs program feeds 260 billion data records into AI engines that guide real-time inspections, shrinking clearance times and boosting detection yields. Singapore’s homeland-security agency recently trialed hyperspectral imaging to elevate threat discrimination at checkpoints. Varying standards across the region encourage suppliers to package configurable software layers that tailor workflows to national doctrines without costly hardware redesigns.

Regulatory Landscape
Aviation and border-screening procurement is shaped by formal qualification, evaluation, and implementing measures that determine which contraband detectors can be deployed and how quickly fleets can be refreshed. In the European Union, Commission Implementing Regulation (EU) 2026/449 (adopted February 2026) updated detailed aviation security measures, while Regulation (EU) 2025/920 introduced mandatory validation requirements tied to cargo and mail screening. Together, these updates reinforce the role of ECACs Common Evaluation Process (CEP) in equipment testing and acceptance across member states.
In the United States, TSA maintains Qualified Products Lists and acceptable capability lists for screening technologies, and it advances Open Architecture interoperability guidance (including DICOS-aligned data exchange) that feeds into system integration requirements in tenders. At land ports of entry, CBP scanning policy and related legislative direction push toward higher non-intrusive inspection coverage, with operational targets through FY 2026 and a broader mandate trajectory toward full vehicle scanning by 2027. This shifts compliance emphasis toward AI-ready software, data logging, and integration with government platforms, not only hardware performance.
Competitive Landscape
The contraband detector market is moderately concentrated, with leading five vendors controlling an estimated 55-60% of revenue. OSI Systems recorded USD 344 million in Q1 FY25 sales, a 23% year-over-year rise, and maintains a USD 1.8 billion backlog that signals sustained pipeline visibility. Smiths Detection delivered 11.1% FY 2024 growth, fueled by aviation demand and AI partnerships such as its integration of SeeTrue software on the HI-SCAN 6040 CTiX platform. L3Harris is diversifying into counter-drone and landmine-detection solutions partnering with MatrixSpace to cross-sell sensor fusion and AI analytics.
Emerging challengers such as ScanTech AI Systems, newly listed on Nasdaq, leverage AI-native architectures to automate threat-material recognition and undercut legacy providers’ refresh cycles. Quantum-sensor research remains early but could reset competitive hierarchies by enabling detection of shielded threats with lower radiation doses.
Contraband Detector Industry Leaders
Smiths Group plc (Smiths Detection)
L3Harris Technologies Inc. (Security and Detection)
ChemImage Corporation
Godrej Security Solutions
OSI Systems Inc. (Rapiscan and ASandE)
- *Disclaimer: Major Players sorted in no particular order
Contraband Detector Market Companies Covered in this Report
- Smiths Group plc (Smiths Detection)
- OSI Systems Inc. (Rapiscan and ASandE)
- L3Harris Technologies Inc. (Security and Detection)
- Nuctech Company Ltd.
- CEIA SpA
- Metrasens Inc.
- ChemImage Corporation
- Adani Systems Inc.
- Berkeley Varitronics Systems Inc.
- Godrej Security Solutions
- Magal Security Systems Ltd.
- Teledyne IAC
- Leidos Holdings Inc.
- Westminster Group plc
- Astrophysics Inc.
- Novatec Metrix
- Viken Detection
- Gilardoni S.p.A.
- Shenzhen Safeway Inspection System Ltd.
- Securetec AG

Market Opportunities and Future Outlook
Scale-up of land-border non-intrusive inspection creates whitespace for vendors that can lift throughput without proportional increases in staffing. Physical footprint limits can also restrict conventional lane expansion in many locations. CBP reported 405 large-scale NII systems deployed across air, sea, and land ports of entry as of December 2, 2025, and its FY 2026 scanning targets at Southwest Border land ports raise demand for solutions that combine imaging hardware with automated anomaly detection and workflow orchestration. In April 2026, CBP issued a sources sought notice for AI and machine-learning tools to integrate with existing data platforms for automated anomaly detection in X-ray images, pointing to near-term demand for software layers, model lifecycle management, and integration services that retrofit into installed bases.
In aviation, EU regulatory updates and CEP testing dynamics are shifting opportunity toward upgradeable algorithm pathways and validation support rather than one-time equipment swaps. Regulation 2026/449 postponed the deadline for upgrading explosive trace detection (ETD) algorithms by 12 months from October 2025 due to ongoing CEP testing. This tends to favor suppliers offering modular ETD/CT roadmaps, rapid requalification packages, and service contracts that keep deployed systems compliant as performance baselines change. Across both aviation and borders, procurement language increasingly rewards open-architecture interoperability, supporting a lane for vendors that productize standards-based data exchange, cybersecurity hardening, and multi-sensor fusion across fixed and portable deployments.
Recent Industry Developments in Contraband Detector Market
- June 2026: L3Harris Technologies was selected by the U.S. Army to deliver VAMPIRE counter-unmanned systems in a deal valued up to USD 106 million. While centered on counter-UAS, the contract reinforces defense-led demand for sensor-driven detection and rapid fieldable security systems, supporting adjacent investments in ruggedized screening and analytics capabilities that overlap with contraband-detection end users.
- May 2026: OSI Systems received a USD 15 million task order from a U.S. government customer for cargo and vehicle inspection technology. The award extends deployed inspection fleets and sustains demand for maintenance, upgrades, and integration work tied to high-energy screening at ports and land borders.
- March 2025: OSI Systems secured a USD 76 million order for RTT 110 CT hold-baggage systems and Itemiser 5X trace detectors. The order highlights continued airport checkpoint and baggage-screening modernization, and it supports bundled platform strategies that link CT imaging with trace detection under unified operating and service models.


Contraband Detector Market Report Scope and Research Methodology
Market Definition and Coverage
For this study, the contraband detector market covers equipment used to detect prohibited or restricted items on people, baggage, cargo, and vehicles across security-controlled environments. It includes fixed and portable screening systems that public agencies and private operators buy and deploy.
Scope exclusions: This sizing does not include general surveillance cameras, standard access-control hardware, or broader cybersecurity tools that do not carry out contraband screening.
Segments Covered in This Report
- By Detector Technology
- X-ray Backscatter
- Transmission X-ray
- Computed Tomography (CT) Scanners
- Terahertz Imaging
- Millimeter-Wave Systems
- Trace Detection (IMS, MS)
- Neutron Activation Analysis
- By Mobility
- Fixed
- Portable / Handheld
- By Screening Target
- Drugs / Narcotics
- Explosives
- Weapons and Ammunition
- Currency
- Other Contraband
- By End-user
- Airports
- Seaports and Land Border Crossings
- Law Enforcement and Prisons
- Public Transportation Hubs (Train, Metro, Bus)
- Retail and Commercial Facilities (Logistics, Warehousing)
- Government and Critical Infrastructure Sites
- Others
- By Sales Channel
- New Equipment Sales
- Aftermarket and Service
- By Geography
- North America
- United States
- Canada
- Mexico
- South America
- Brazil
- Argentina
- Rest of South America
- Europe
- United Kingdom
- Germany
- France
- Italy
- Spain
- Nordics
- Rest of Europe
- Asia Pacific
- China
- Japan
- India
- South Korea
- Southeast Asia
- Australia
- New Zealand
- Rest of Asia Pacific
- Middle East and Africa
- Middle East
- GCC
- Turkey
- Israel
- Rest of Middle East
- Africa
- South Africa
- Nigeria
- Rest of Africa
- Middle East
- North America
Data Sources, Market Sizing, and Validation
Desk Research
Desk research helped set the market context, define the demand pools, and anchor assumptions that can be checked independently. We referred to public and official sources such as Transportation Security Administration (TSA) checkpoints and screening references, US Customs and Border Protection (CBP) enforcement updates, International Civil Aviation Organization (ICAO) aviation security guidance, World Customs Organization (WCO) border management publications, International Air Transport Association (IATA) traffic statistics, and airport or port authority procurement notices.
To avoid relying on a single data stream, we also reviewed company annual reports, investor presentations, product catalogs, certification notes where available, and reputable press coverage of security modernization programs. For cross-checking supplier footprints and technology direction, paid subscriptions supporting company financials and intelligence were used selectively, and patent databases were reviewed to understand where R and D activity is moving. The sources listed here are illustrative and not exhaustive, and other public documents and datasets were also used for collection, validation, and clarification.
Primary Interviews and Surveys
Primary work focused on validating which detector categories are actually budgeted and deployed across airports, seaports, land borders, and corrections, and how replacement cycles and compliance needs translate into annual demand. We spoke with a mix of manufacturers, channel partners, system integrators, and end users across APAC, EMEA, and the Americas. We then used their inputs to stress-test pricing bands, order timing, and adoption patterns before finalizing the model.
Distribution of primary research fieldwork respondents
| Company type | Respondent position | Region |
|---|---|---|
| Top tier: 29% | CXOs: 17% | APAC: 41% |
| Mid tier: 52% | Functional/Unit leaders: 23% | EMEA: 34% |
| Smaller Players: 19% | Managers: 60% | Americas: 25% |
Market-Sizing & Forecasting
Market sizing was built using top-down and bottom-up logic. The main model started from screening touchpoints and infrastructure activity, then converted that into annual equipment demand using penetration and replacement assumptions. Results were corroborated with selective bottom-up approximations, including sampled ASP bands by detector type, channel feedback on typical order sizes, and a reasonableness check of deployments across major facility types.
Key inputs used in the model included passenger and air-cargo screening activity trends, border and port inspection intensity, procurement and modernization cycle timing, typical service life and replacement rates for screening systems, and ASP progression linked to feature mix (for example, automation content and integrated detection libraries). Forecasting used scenario analysis around public security budgets and infrastructure rollout schedules, and it was refined through expert consensus on how quickly newer screening practices are adopted. When smaller-market signals were thin, gaps were handled by applying adoption ratios from comparable geographies and then rechecked through follow-up channel validation.
Data Validation & Update Cycle
Outputs were checked through multiple passes that look for inconsistencies across demand indicators, pricing logic, and implied unit volumes, then reviewed internally before sign-off. If a regional or end-use total looked unusually high or low, we traced the drivers back to the specific assumption creating the variance, and respondents were re-contacted when the variance could not be explained through desk evidence.
Reports are refreshed annually, and interim updates are made when material events shift demand, such as regulation changes, major procurement programs, or supply-side constraints. Before delivery, analysts run a fresh pass of key public releases and market signals so clients receive the latest updated view.
Mordor Intelligence's Contraband Detector Market Size Compared Against Other Published Estimates
Published market sizes for contraband detectors often differ even when the topic name looks similar, because coverage and timing are not consistent across sources. Gaps also come from how pricing is treated (one blended ASP versus type-level ASPs), whether procurement cycles are reflected in shipment timing, and how often the model is refreshed.
Some sources expand the total by including adjacent security equipment like general access-control systems and broad surveillance hardware. For Mordor Intelligence, the value is limited to contraband screening equipment used for people, baggage, cargo, and vehicles, and totals are cross-checked against screening activity signals and realistic replacement timing.
Benchmark comparison
| Source | Market Size | Gaps in Research Methodology |
|---|---|---|
| Mordor Intelligence | USD 5.32 B (2026) | |
| Industry Research Publisher A | USD 4.71 B (2024) | Uses an earlier base year and a different forecast window, and it can apply a broader technology and application basket that mixes security categories beyond contraband screening equipment. |
| Global Consultancy B | USD 5.04 B (2024) | Anchors on a 2023 base and a 2024 estimate, and differences can come from blended ASP progression and limited normalization for replacement cycles across airports, borders, and corrections. |
The spread is mainly explained by year alignment and what gets counted inside the equipment basket, followed by differences in ASP treatment and refresh cadence. A model tied back to screening throughput signals and replacement assumptions stays easier to reproduce and to adjust when procurement programs accelerate or get delayed.


Key Questions Answered in the Report
What is the current size of the contraband detector market?
The contraband detector market reached USD 5.32 billion in 2026 and is projected to rise to USD 8.18 billion by 2031.
Which detection technology is growing the fastest?
Terahertz imaging leads growth with a forecast 9.96% CAGR due to its ability to find both metallic and non-metallic threats without ionizing radiation.
Why are aftermarket services becoming important?
AI-enabled detectors need constant algorithm updates, software patches, and threat-library expansions, turning service and subscription contracts into a key revenue engine.
Which region offers the strongest growth outlook?
Asia-Pacific is expected to achieve a 9.94% CAGR through 2031, driven by trade-facilitation programs and digital customs modernization.
How are airports balancing security and passenger experience?
Airports invest in computed-tomography lanes and AI-powered analytics that cut false alarms, letting travelers keep electronics and liquids in carry-ons while maintaining detection accuracy.
What factors could restrain adoption of advanced systems?
High ownership costs, budget freezes, privacy concerns, and operator shortages can delay procurement of CT and neutron-activation platforms, especially in developing markets.
Page last updated on:


 Your data is secure and never sold or shared.


