
Continuous Authentication Market Size and Share
Market Overview
| Study Period | 2020 - 2031 |
|---|---|
| Market Size (2026) | USD 2.53 Billion |
| Market Size (2031) | USD 6.33 Billion |
| Growth Rate (2026 - 2031) | 20.13 % |
| Fastest Growing Market | Asia-Pacific |
| Largest Market | North America |
| Market Concentration | Medium |
Major Players *Disclaimer: Major Players sorted in no particular order Image © Mordor Intelligence. Reuse requires attribution under CC BY 4.0. | |
Continuous Authentication Market Analysis by Mordor Intelligence
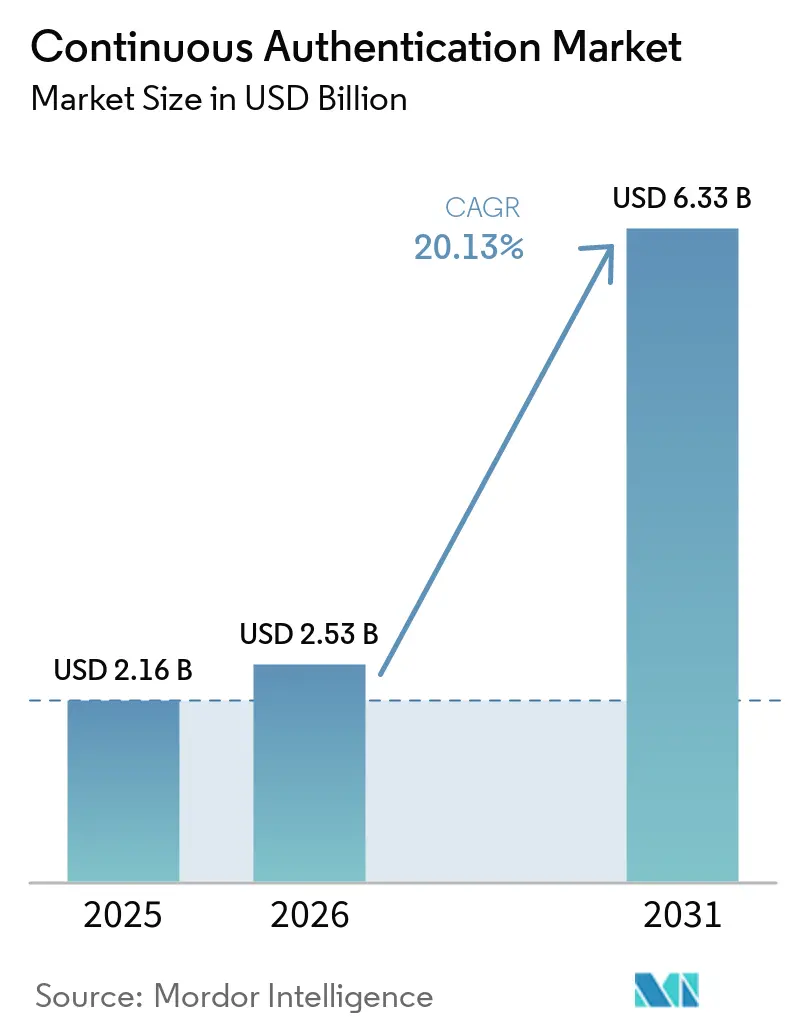
The continuous authentication market size was valued at USD 2.16 billion in 2025 and estimated to grow from USD 2.53 billion in 2026 to reach USD 6.33 billion by 2031, at a CAGR of 20.13% during the forecast period 2026-2031. The continuous authentication market is benefiting from a shift away from security models that rely only on a login event. Account takeover and session hijacking have increased the need to evaluate identity after access has been granted. Buyers are placing greater weight on tools that align with zero-trust programs, digital banking workflows, and risk-based authentication requirements. Cloud platforms and application programming interfaces are widening access for organizations that cannot support large identity engineering teams. Vendors are responding through device intelligence, behavioral signals, regulatory integrations, and partnerships with payment and banking platforms.
Key Report Takeaways
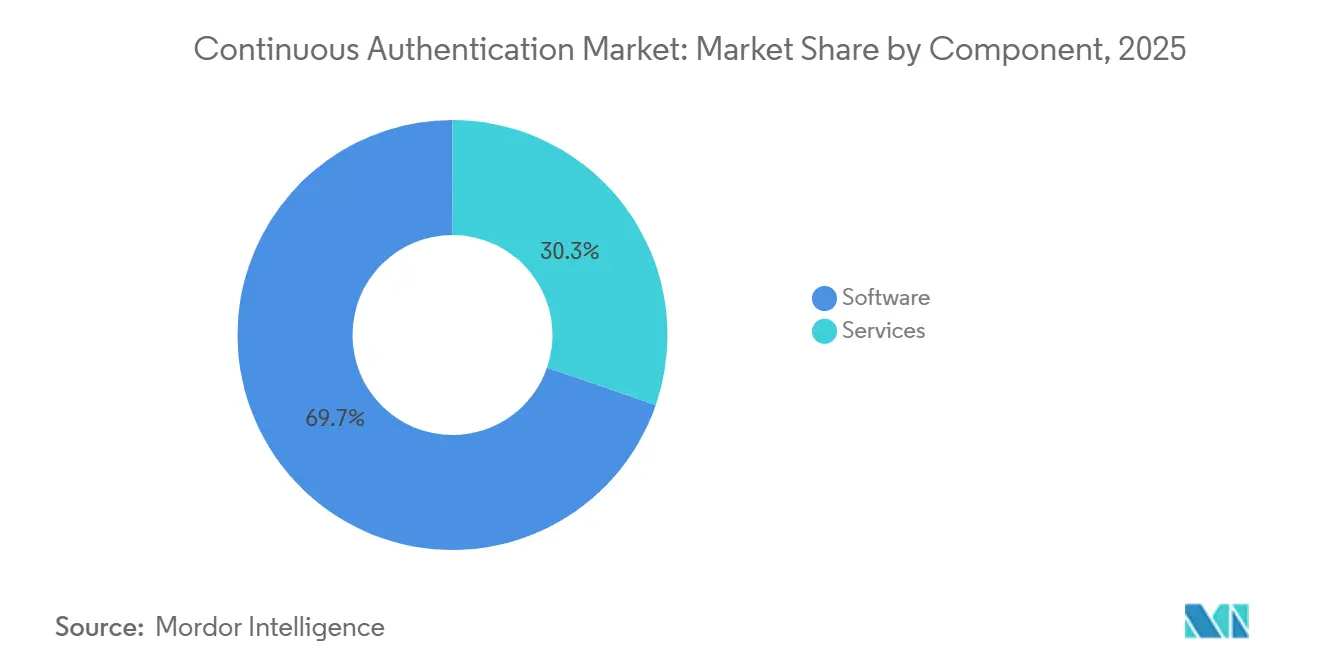
- By component, software held 69.73% of the continuous authentication market share in 2025, while services are projected to expand at a CAGR of 26.38% through 2031.
- By deployment mode, cloud held 61.74% of the continuous authentication market share in 2025 and is projected to expand at a CAGR of 25.89% through 2031.
- By authentication method, behavioral biometrics held 58.32% of revenue in 2025, while multisignal continuous authentication is projected to expand at a CAGR of 27.37% through 2031.
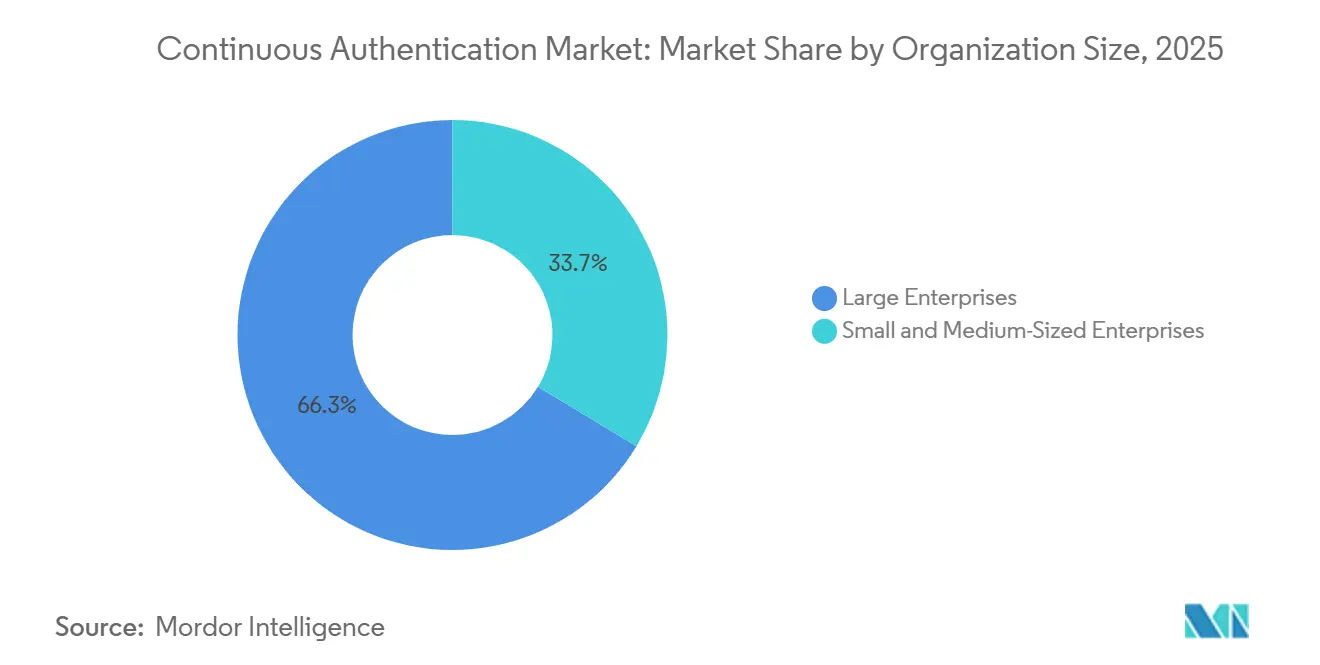
- By organization size, large enterprises held 66.34% of the continuous authentication market revenue in 2025, while SMEs are projected to expand at a CAGR of 24.82% through 2031.
- By industry vertical, BFSI held 28.62% of revenue in 2025, while healthcare and life sciences are projected to expand at a CAGR of 26.91% through 2031.
- By geography, North America held 36.43% of revenue in the continuous authentication market in 2025, while Asia-Pacific is projected to expand at a CAGR of 26.71% through 2031.
Note: Market size and forecast figures in this report are generated using Mordor Intelligence’s proprietary estimation framework, updated with the latest available data and insights as of January 2026.
Global Continuous Authentication Market Trends and Insights
Drivers Impact Analysis*
| DRIVER | (~) % IMPACT ON CAGR FORECAST | GEOGRAPHIC RELEVANCE | IMPACT TIMELINE |
|---|---|---|---|
| Account Takeover and Session Hijacking | +4.8% | Global | Short term (≤ 2 years) |
| Zero-Trust Security Architecture Expansion | +4.2% | North America and Europe, spill-over to APAC | Medium term (2-4 years) |
| Digital Banking and High-Risk Online Transactions | +3.5% | APAC, North America, and South America | Medium term (2-4 years) |
| Risk-Based Authentication Regulation | +2.8% | EU and North America, expanding to MEA | Medium term (2-4 years) |
| Remote-Access and Session-Handoff Detection | +1.9% | North America and Europe | Short term (≤ 2 years) |
| Privacy-Preserving On-Device Behavioral Models | +1.4% | Global, early gains in EU and APAC | Long term (≥ 4 years) |
| Source: Mordor Intelligence | |||
Escalation of Account Takeover and Session Hijacking
Account takeover has become easier to scale through automated credential attacks. LexisNexis Risk Solutions recorded a 1.2% overall account takeover attack rate in 2025, up 89% from the prior year. Its data also showed that e-commerce login attack rates rose from 3.4% to 10.8% in 2025.[1]LexisNexis Risk Solutions, “Cybercrime Report 2026,” LexisNexis Risk Solutions, risk.lexisnexis.com Proofpoint found that 59% of accounts affected by successful takeover had multifactor authentication enabled at the time of compromise. This gap directs security spending toward controls that assess behavior during an active session. The continuous authentication market, therefore, has a clear role where a login check alone cannot identify a change in user behavior. The same issue applies to token replay and remote session handoffs, because the session may appear valid even after credentials are compromised. Enterprises can use behavioral deviations during transactions, changes in mouse movement, unusual typing cadence, or shifts in device context to determine whether a session should continue. This expands the practical value of a control from preventing unauthorized entry to detecting misuse after entry.
Expansion of Zero-Trust Security Architectures
Zero-trust architecture requires organizations to verify users and devices throughout access activity. NIST SP 1800-35 identifies continuous verification of user identity as part of a zero-trust implementation approach.[2]National Institute of Standards and Technology, “Implementing a Zero Trust Architecture,” National Institute of Standards and Technology, nvlpubs.nist.gov This approach moves continuous authentication from an optional feature to a component of identity architecture. It also provides security teams with a framework for connecting behavior-based checks to network segmentation and access policies. Federal contractors and critical infrastructure operators have a further reason to align their security programs with recognized government guidance. The continuous authentication market can benefit as more organizations move from initial multifactor authentication deployments toward mature zero-trust environments. Continuous identity checks can be integrated into access requests, network segments, and policy decisions rather than running as a separate security process. This matters to organizations that need to protect sensitive applications without requiring every user to complete a disruptive challenge. It also supports a more consistent security model across remote employees, contractors, and third-party users.
Growth of Digital Banking and High-Risk Online Transactions
Digital banking creates frequent identity decisions across account access and payment activity. The European Banking Authority stated that behavioral data can satisfy the inherence element of strong customer authentication when it is implemented with appropriate controls. That position supports less disruptive authentication for low-risk activity while allowing additional checks when behavior changes. Digital banking platforms are also linking onboarding, account access, risk-based verification, and step-up authentication into a connected identity process. These requirements support demand in the continuous authentication market because real-time payment environments leave limited time for manual fraud review. Payment providers can reserve step-up checks for behavior that appears inconsistent with the enrolled user, while normal low-risk activity continues with less interruption. This is relevant for retail and corporate banking because both customer groups increasingly manage accounts through digital channels. It also places behavioral verification closer to fraud prevention workflows than conventional login security controls.
Regulatory Demand for Risk-Based Authentication
Regulation is making strong authentication a formal control requirement for financial entities. The Digital Operational Resilience Act became applicable on January 17, 2025, and Article 9 requires financial entities to use strong authentication mechanisms based on relevant standards. This underscores the importance of security tools that can support evidence collection, audit trails, and ongoing risk assessment. ThreatMark joined EBA CLEARING’s Fraud Pattern and Anomaly Detection Solution Provider Program in March 2026. The program connected its behavioral intelligence capabilities with SEPA payment infrastructure. The continuous authentication market is supported when regulatory participation becomes both a compliance requirement and a route to banking customers. Overlapping obligations can make a single behavioral intelligence deployment relevant to strong customer authentication, operational resilience, and transaction monitoring activities. Procurement teams can therefore evaluate regulatory integrations alongside detection performance and ease of deployment. Such requirements also raise the value of documented controls that can be reviewed by compliance, risk, and security teams.
Restraints Impact Analysis*
| RESTRAINT | (~) % IMPACT ON CAGR FORECAST | GEOGRAPHIC RELEVANCE | IMPACT TIMELINE |
|---|---|---|---|
| Privacy, Consent, and Biometric Data Governance | -2.8% | EU, California, expanding globally | Short term (≤ 2 years) |
| Legacy Authentication Stack Integration Complexity | -2.1% | Global, most acute in BFSI and government | Medium term (2-4 years) |
| Behavioral Drift and False-Positive Exposure | -1.5% | Global | Medium term (2-4 years) |
| Generative AI and Deepfake Behavioral Spoofing Detection Limits | -1.2% | Global | Long term (≥ 4 years) |
| Source: Mordor Intelligence | |||
Privacy, Consent, and Biometric Data Governance
Behavioral biometric deployments must account for privacy and consent obligations across jurisdictions. The European Commission describes biometric data processed to uniquely identify a person as a special category of personal data under Article 9 of the General Data Protection Regulation.[3]European Commission, “Data Protection in the EU,” European Commission, commission.europa.eu Data minimization and purpose limitation can affect what signals a platform collects and where it processes them. Different rules in Europe and the United States make a single consent process difficult for multinational deployments. A 2025 Scientific Reports paper described a federated biometric authentication approach using differential privacy and homomorphic encryption. The continuous authentication market must balance stronger detection models with designs that reduce exposure of sensitive behavioral information. Cloud-based services can face added scrutiny when behavioral information is processed across borders or combined across institutions. On-device and federated approaches can limit raw data movement, although they may reduce access to the broad signal pools that support model performance. Providers must also explain how consent is obtained, how long information is kept, and how a user can exercise applicable privacy rights.
Integration Complexity Across Legacy Authentication Stacks
Many organizations use identity systems that were not designed to produce continuous behavioral signals. Older virtual private network, directory, federation, and core banking systems often require connectors, application programming interfaces, and telemetry agents to support these tools. Each customer channel can also require separate model calibration because interaction patterns differ across mobile apps, websites, and call centers. This lengthens deployment schedules and can increase service requirements. ThreatMark launched ScamFlag in May 2025 via a software development kit for integration into digital banking applications. Minimal-footprint integration options can reduce barriers for smaller institutions, but legacy complexity remains a constraint on adoption. Financial institutions may operate separate interfaces for core banking, mobile banking, websites, contact centers, and payment applications. Each interface can produce distinct interaction patterns, making it harder to establish a common risk score. The burden can be particularly high in government, healthcare, and large banks, where procurement, data governance, and application ownership are spread across several teams.
*Our forecasts treat driver/restraint impacts as directional, not additive. The impact forecasts reflect baseline growth, mix effects, and variable interactions.
Segment Analysis
By Component: Software Holds the Largest Revenue Position
Software held 69.73% of revenue in 2025, making it the largest component of the continuous authentication market. Software platforms can be delivered through cloud services without a dedicated hardware installation. Financial institutions use these tools to assess behavioral signals across a growing number of customer sessions. Broader enrollment can improve the value of a platform’s historical behavior patterns. This creates switching costs where models are connected to several applications and operational workflows. The segment also supports frequent model updates as fraud tactics and digital channels change, while shared operating data can help providers refine detection methods across different banking and commerce environments. Buyers also value centralized administration because policies, reporting rules, and risk thresholds can be changed without replacing a physical authentication system.
Services are projected to grow at a CAGR of 26.38% through 2031. Service work includes integration, model calibration, managed operations, and support for security documentation. Larger deployments often need testing against the customer’s specific applications before a multiyear software agreement is signed. BioCatch introduced Connect 2.0 in 2025 with the Align SDK and BioCatch Link integration tool. The company reported 60% annual recurring revenue growth in its midmarket partner channel during 2025 and added more than 70 community banks and credit unions through a single platform.[4]BioCatch, “BioCatch Unveils DeviceIQ,” BioCatch, biocatch.com The difference between tailored enterprise work and automated onboarding will shape how component providers serve smaller buyers.


By Deployment Mode: Cloud Leads Adoption and Growth
Cloud held 61.74% of the continuous authentication market share in 2025. It provides the capacity to process large volumes of session telemetry across multiple customer channels. Cloud deployment also fits identity orchestration models used in zero-trust programs. The continuous authentication market size for cloud deployments is projected to grow at a CAGR of 25.89% through 2031. This combination of the largest share and fastest growth reflects continued adoption across an undeployed enterprise base. Cloud systems can also simplify access to centralized updates and threat intelligence.
On-premises installations remain relevant in government and critical infrastructure settings. Data sovereignty requirements and isolated networks can limit the use of externally hosted behavioral processing. NIST SP 1800-35 includes architectures that accommodate on-premises analytics within hybrid identity environments. Hybrid deployments can allow banks to process latency-sensitive signals locally and use cloud systems for broader fraud analysis. A 2025 Sensors study demonstrated continuous authentication on resource-constrained devices through biometric and environmental signal fusion. These approaches show why deployment choices will remain linked to privacy, connectivity, and operational requirements. Edge and device-based processing can be useful where a customer needs rapid decisions or cannot send sensitive data to a central environment. They may also add governance work because security teams must manage policies across a wider set of endpoints.
By Authentication Method: Behavioral Biometrics Leads While Multisignal Gains
Behavioral biometrics accounted for 58.32% of authentication method revenue in 2025. It can observe typing cadence, mouse activity, touch pressure, and other interaction patterns without requiring a user action. This gives organizations a way to monitor sessions after an initial login. Physiological biometrics are used in high-assurance settings where facial or voice checks can supplement passive observation. Device, session, and environmental intelligence add context from devices, networks, and sensors. Together, these options allow organizations to apply controls where direct behavioral interaction is limited.
Multisignal continuous authentication is projected to grow at a CAGR of 27.37% through 2031. It combines behavioral, physiological, device, and environmental information into a single risk score. The approach reduces dependence on any one signal that might be manipulated or unavailable. Proofpoint’s 2025 findings on compromised accounts with multifactor authentication show why security teams are seeking layered checks.[5]Proofpoint, “2025 State of the Phish Report,” Proofpoint, proofpoint.com BioCatch launched DeviceIQ in March 2026 to add device intelligence to behavioral analysis for financial institutions. The company stated that, during an initial deployment, devices classified as bad were nearly 13 times more likely to have bypassed earlier device-focused controls. Multisignal tools also require careful governance because risk teams need to understand how signals are weighted and when a decision should trigger a customer challenge. The method’s value depends on a reliable view of normal activity across each channel.
By Organization Size: Large Enterprises Lead While SMEs Expand
Large enterprises accounted for 66.34% of revenue in 2025. They have significant exposure to credential attacks and often have internal identity teams that can manage complex integrations. Financial services, government, and technology organizations also operate environments where alerts can be reviewed by dedicated security operations teams. Their security programs are shaped by zero-trust plans, disclosure obligations, and operational resilience rules. Enrollment periods can last 90-120 days when models need to learn established user patterns across several systems. These factors help explain the leading position of large organizations in the continuous authentication market.
SMEs are projected to grow at a CAGR of 24.82% through 2031. Consumption-priced application programming interfaces reduce the upfront cost that has limited smaller deployments. LexisNexis Risk Solutions reported sharp growth in e-commerce login attacks in 2025, which increases the relevance of these controls for smaller online businesses. Pretrained models and lightweight integrations can help smaller organizations begin with less internal engineering capacity. Their adoption still depends on whether vendors can tune behavior models to the transaction patterns of each business. Smaller firms often need preconfigured models because they cannot wait through extended enrollment periods or dedicate staff to identity analytics. Providers that combine onboarding support with consumption-based pricing can address this practical limit without requiring a full enterprise program.
By Industry Vertical: BFSI Holds Share While Healthcare Expands
BFSI held 28.62% of revenue in 2025 and led the vertical mix. Banks and insurers face exposure to account takeover, authorized push payment fraud, and high-value digital transactions. Instant payment systems reduce the time available to investigate suspicious activity before funds clear. This makes ongoing identity assessment useful before a payment is completed. Nasdaq Verafin and BioCatch formed a partnership in September 2025 to combine fraud detection and consortium data with behavioral and device intelligence. The partnership served a network of 2,600 financial institutions, supporting pretransaction behavioral checks at a wider scale.
The healthcare and life sciences industry is projected to grow at a CAGR of 26.91% through 2031. Telehealth access and clinical workflows create a need to confirm identities without adding unnecessary friction. Ransomware and credential misuse can also affect patient care and hospital operations. Government guidance on zero-trust architecture supports continuous verification beyond the initial authentication event. Ping Identity and OLOID partnered in May 2026 to provide passwordless verified-trust authentication for the United States clinical workforce. The deployment linked mobile and badge-tap credentials with the clinical access management process. It used Apple Wallet and Google Wallet credential presentation for Tap-and-Login access, extending biometric-based continuous verification into a clinical workforce setting. Other verticals, including retail, transportation, telecommunications, industrial manufacturing, energy, utilities, and oil and gas, face distinct identity risks across access to customers, workforce, and operational technology. Their use cases extend the addressable demand beyond consumer-facing financial services.
Geography Analysis
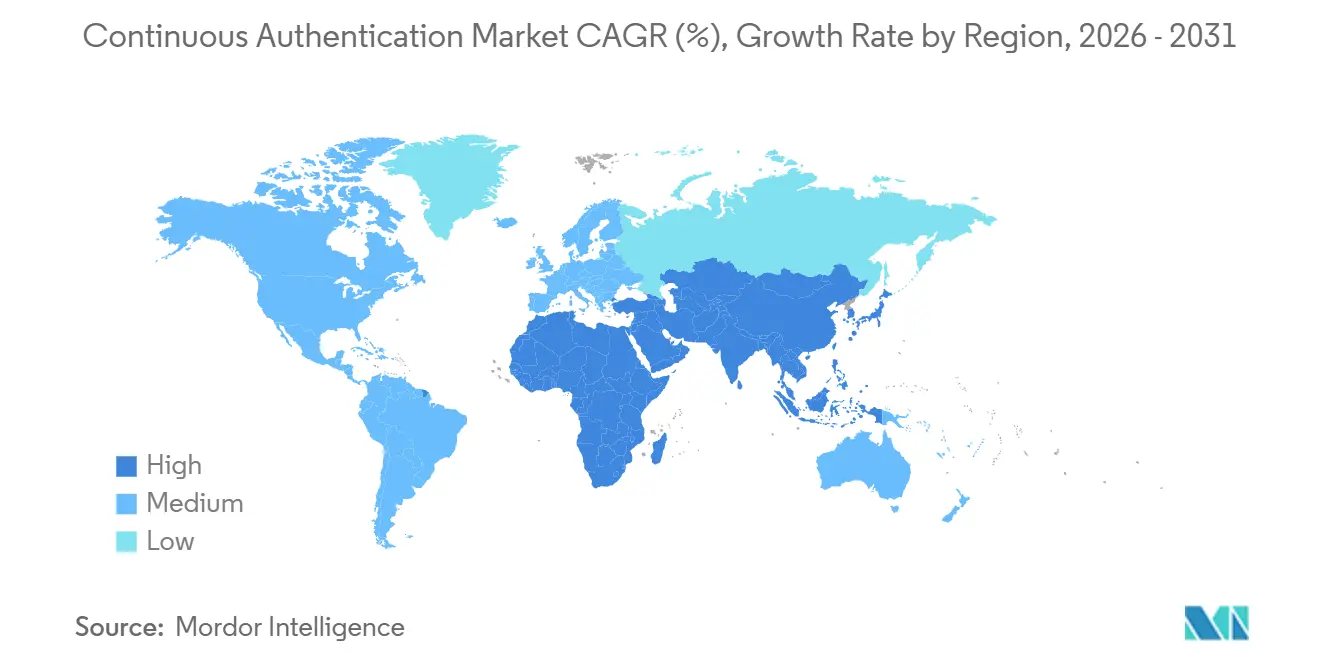
North America held 36.43% of the continuous authentication market share in 2025. The region has early-adopter financial institutions, a large digital banking base, and strong demand for enterprise cybersecurity. Federal Financial Institutions Examination Council guidance has supported layered approaches to authentication in online banking. The United States accounts for much of the region’s demand because its organizations process high volumes of digital transactions. A multiyear deployment of device intelligence and real-time risk scoring across retail, commercial, and wealth operations also reflected growing interest among Canadian banks in these capabilities. Mexico offers a developing opportunity as mobile banking and fintech services expand.
Europe remained the second-largest regional market. Its financial institutions operate within a detailed framework for strong customer authentication and operational resilience. The European Banking Authority’s position on behavioral data for strong customer authentication provides a regulatory basis for these implementations. DORA has been applied since January 2025 and requires strong authentication mechanisms as part of information and communication technology risk management. The United Kingdom, Germany, France, and the Netherlands host many European enterprise deployments. Privacy-by-design approaches also matter in the region because data minimization shapes behavioral data architectures.
Asia-Pacific is projected to grow at a CAGR of 26.71% in the continuous authentication market through 2031. Expansion in digital financial services and smartphone use is increasing the number of high-frequency identity interactions. Government digital identity programs in India, South Korea, and Singapore provide a broader foundation for secure online services. NEC developed biometric digital signature technology in February 2025 that enabled facial authentication without storing or transmitting facial information.[6]NEC Corporation, “NEC Develops Biometric Digital Signature Technology,” NEC Corporation, jpn.nec.com South America is led by Brazil, where instant payment activity has increased the need for real-time fraud controls. BioCatch launched BioCatch Trust Argentina in 2025 as an interbank behavior and device-based fraud intelligence-sharing network. The Middle East and Africa have early demand in the UAE and Saudi Arabia, while telecom distribution provides an entry route in the Gulf Cooperation Council countries.

Competitive Landscape
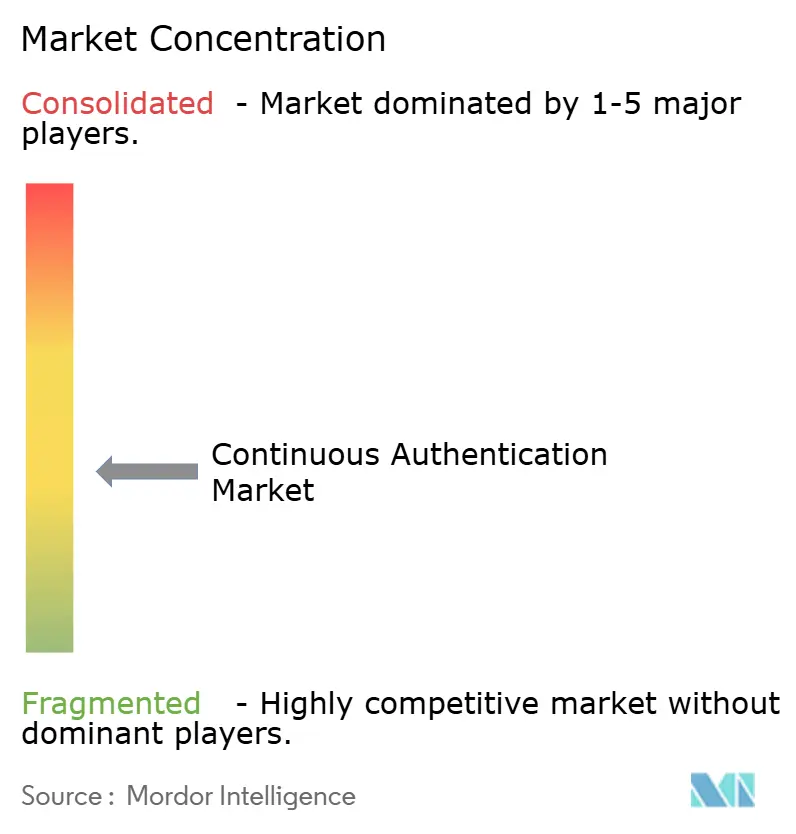
The continuous authentication market is moderately fragmented. Dedicated behavioral intelligence vendors operate alongside identity platform providers and newer specialists. BioCatch, ThreatMark, and Callsign have historically been among the dedicated providers. Visa acquired Featurespace in 2024 and announced its planned acquisition of BioCatch for USD 2.4 billion in August 2026. The planned transaction was expected to close in Q2 2027, subject to regulatory approval. BioCatch stated that it analyzes more than 17 billion user sessions each month across more than 340 financial institutions.
One group of vendors embeds behavioral intelligence in existing identity and fraud management systems. Another group provides an integrated stack from signal collection to risk decisions. Platform approaches can suit SME and midmarket users who prefer application programming interfaces over proprietary software agents. Full-stack providers can retain an advantage with Tier 1 banks that require customized models and multiyear operating arrangements. ThreatMark’s participation in EBA CLEARING’s program exemplifies a strategy focused on integrating banking infrastructure. Sardine received EMVCo 3DS 2.x certification in June 2026 for frictionless, challenge, and decoupled authentication flows.
Privacy-preserving and on-device processing are becoming another point of competition. These designs may be relevant where organizations seek to reduce the central collection of biometric data. NEC’s February 2025 biometric digital signature technology used facial authentication without storing or transmitting facial information. BioCatch’s March 2026 DeviceIQ launch shows a separate focus on combining device signals with behavioral intelligence. Competition is therefore shaped by the depth of integration, regulatory readiness, privacy design, and the ability to detect synthetic or compromised sessions. No combined market share for leading providers was included, so the evidence does not support a numerical market concentration score.
Continuous Authentication Industry Leaders
BioCatch Ltd.
ThreatMark s.r.o.
Callsign Inc.
TypingDNA Inc.
Zighra Inc.
- *Disclaimer: Major Players sorted in no particular order

Recent Industry Developments
- September 2026: NEC, SB Payment Service, and SB C&S launched facial recognition payment integration on the PayCAS multi-payment platform, enabling customers to make contactless purchases using NEC’s Bio-IDiom facial recognition technology, the latest deployment of NEC’s continuous biometric verification infrastructure across retail and financial services channels in Japan.
- August 2026: Visa announced the acquisition of BioCatch for USD 2.4 billion in cash, pending regulatory approval with close expected in Q2 2027. BioCatch analyzes more than 17 billion user sessions monthly across more than 340 financial institutions, protecting more than 660 million people globally. The transaction represented the largest acquisition in the behavioral biometrics sector’s history and signaled payment network-level conviction in continuous behavioral intelligence as fraud-prevention infrastructure. The proposed acquisition followed Visa’s 2024 acquisition of Featurespace and would bring two established behavioral analytics businesses under one payment network, subject to the planned close.
- June 2026: ebankIT integrated Daon’s Identity Continuity infrastructure into its digital banking platform, linking onboarding, account access, risk-based reverification, and step-up authentication in a persistent chain of identity assurance across every customer interaction.
- May 2026: Sardine raised USD 25 million in a Series C extension led by National Bank of Canada, bringing total funding to USD 170 million. The bank signed a multiyear partnership to deploy Sardine’s device intelligence and real-time risk scoring across its retail, commercial, and wealth operations. The deployment followed a live platform evaluation that cited fraud detection improvement and lower false positives, linking the funding event with use of the technology across several banking lines.


Global Continuous Authentication Market Report Scope
Continuous authentication market consists of security solutions that continuously verify user identity throughout an entire session or interaction rather than relying solely on one-time authentication at initial login, using behavioral biometrics (typing patterns, mouse movements, touchscreen gestures, gait analysis), contextual signals (location, device fingerprint, network characteristics), and passive biometric monitoring (face recognition, voice patterns) to detect account takeover, session hijacking, and insider threats in real-time. These platforms provide risk-based adaptive authentication that dynamically adjusts access privileges or triggers re-authentication when anomalous behavior is detected, enabling organizations to maintain zero-trust security postures, reduce friction for legitimate users, and protect sensitive applications and data from unauthorized access throughout the entire user session across enterprise, financial services, healthcare, and government deployments.
The Continuous Authentication Market Report is Segmented by Component (Software, and Services), Deployment Mode (Cloud, On-Premises, and Hybrid), Authentication Method (Behavioral Biometrics, Physiological Biometrics, Device, Session, and Environmental Intelligence, and Multisignal Continuous Authentication), Organization Size (Large Enterprises, and Small and Medium-Sized Enterprises), Industry Vertical (Government and Public Administration, Industrial Manufacturing, Retail and E-Commerce, Transportation and Logistics, Energy and Utilities, Oil and Gas, IT and Telecommunication, Media and Entertainment, Education and Research Institutions, Healthcare and Life Sciences, Banking, Financial Services, and Insurance (BFSI), and Other Industry Verticals), and Geography (North America, South America, Europe, Asia-Pacific, and Middle East and Africa). The Market Forecasts are Provided in Terms of Value (USD).
| Software |
| Services |
| Cloud |
| On-Premises |
| Hybrid |
| Behavioral Biometrics |
| Physiological Biometrics |
| Device, Session, and Environmental Intelligence |
| Multisignal Continuous Authentication |
| Large Enterprises |
| Small and Medium-Sized Enterprises |
| Government and Public Administration |
| Retail and E-Commerce |
| Transportation and Logistics |
| Energy and Utilities |
| IT and Telecommunication |
| Media and Entertainment |
| Banking, Financial Services, and Insurance (BFSI) |
| Healthcare and Life Sciences |
| Other Industry Verticals |
| North America | United States | |
| Canada | ||
| Mexico | ||
| South America | Brazil | |
| Argentina | ||
| Rest of South America | ||
| Europe | Germany | |
| United Kingdom | ||
| France | ||
| Italy | ||
| BENELUX | ||
| Rest of Europe | ||
| Asia-Pacific | China | |
| Japan | ||
| India | ||
| South Korea | ||
| Australia | ||
| Rest of Asia-Pacific | ||
| Middle East and Africa | Middle East | United Arab Emirates |
| Saudi Arabia | ||
| Rest of Middle East | ||
| Africa | South Africa | |
| Nigeria | ||
| Egypt | ||
| Rest of Africa | ||
| By Component | Software | ||
| Services | |||
| By Deployment Mode | Cloud | ||
| On-Premises | |||
| Hybrid | |||
| By Authentication Method | Behavioral Biometrics | ||
| Physiological Biometrics | |||
| Device, Session, and Environmental Intelligence | |||
| Multisignal Continuous Authentication | |||
| By Organization Size | Large Enterprises | ||
| Small and Medium-Sized Enterprises | |||
| By Industry Vertical | Government and Public Administration | ||
| Retail and E-Commerce | |||
| Transportation and Logistics | |||
| Energy and Utilities | |||
| IT and Telecommunication | |||
| Media and Entertainment | |||
| Banking, Financial Services, and Insurance (BFSI) | |||
| Healthcare and Life Sciences | |||
| Other Industry Verticals | |||
| By Geography | North America | United States | |
| Canada | |||
| Mexico | |||
| South America | Brazil | ||
| Argentina | |||
| Rest of South America | |||
| Europe | Germany | ||
| United Kingdom | |||
| France | |||
| Italy | |||
| BENELUX | |||
| Rest of Europe | |||
| Asia-Pacific | China | ||
| Japan | |||
| India | |||
| South Korea | |||
| Australia | |||
| Rest of Asia-Pacific | |||
| Middle East and Africa | Middle East | United Arab Emirates | |
| Saudi Arabia | |||
| Rest of Middle East | |||
| Africa | South Africa | ||
| Nigeria | |||
| Egypt | |||
| Rest of Africa | |||


Key Questions Answered in the Report
What is the continuous authentication market size?
The continuous authentication market size was valued at USD 2.16 billion in 2025 and estimated to grow from USD 2.53 billion in 2026 to reach USD 6.33 billion by 2031, at a CAGR of 20.13% during the forecast period 2026-2031.
What is driving demand for continuous authentication?
Rising account takeover activity, zero-trust adoption, high-risk digital transactions, and stronger authentication rules are supporting demand. These pressures increase the need to validate identity during an active session rather than only when a user signs in.
Which deployment model leads adoption?
Cloud led with 61.74% of revenue in 2025 and is projected to expand at a CAGR of 25.89% through 2031. It supports centralized processing of session information and fits cloud-based identity orchestration programs. On-premises and hybrid models remain relevant where data sovereignty, isolated networks, or latency requirements shape the deployment decision.
Which customer group is expanding fastest?
SMEs are projected to grow at a CAGR of 24.82% through 2031 as consumption-priced application programming interfaces reduce adoption barriers. Pretrained models and lighter integrations can further reduce the need for specialized internal teams. Adoption still requires models to reflect each organization’s users, applications, and transaction patterns.
Which vertical has the largest share?
BFSI led with 28.62% of revenue in 2025 because financial institutions require fraud controls for digital access and real-time payments. Ongoing identity checks can help flag behavioral changes before payment activity is completed. This is particularly relevant where instant payment systems reduce the time available for investigation or recovery.
Which region is expected to grow fastest?
Asia-Pacific is projected to expand at a CAGR of 26.71% through 2031, supported by digital financial services and identity programs. Growth is tied to high levels of smartphone use and more frequent online financial interactions. Digital identity programs in major countries also provide a foundation for broader secure online service delivery.
Page last updated on:


 Your data is secure and never sold or shared.


