
Connected TV Advertising Services Market Size and Share
Market Overview
| Study Period | 2020 - 2031 |
|---|---|
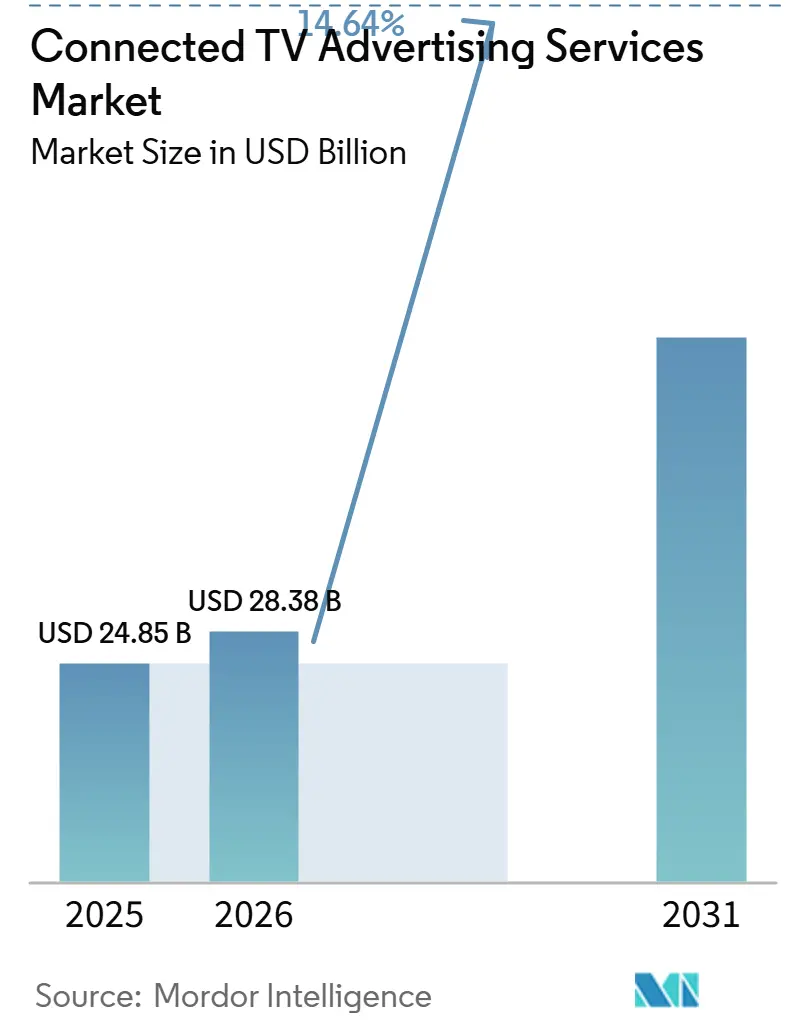
| Market Size (2026) | USD 28.38 Billion |
| Market Size (2031) | USD 56.19 Billion |
| Growth Rate (2026 - 2031) | 14.64 % |
| Fastest Growing Market | Asia-Pacific |
| Largest Market | North America |
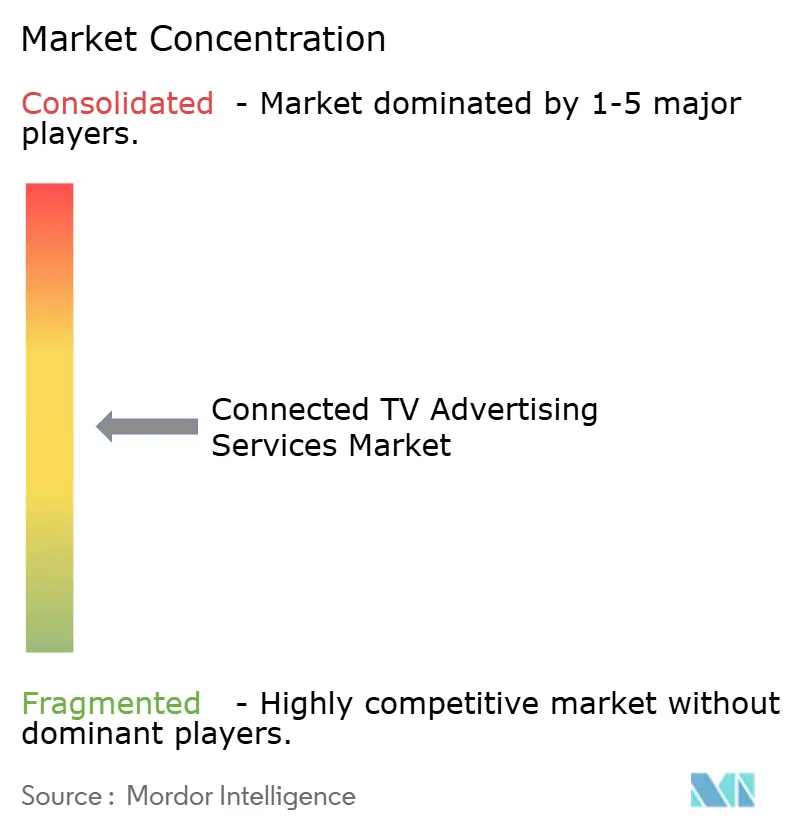
| Market Concentration | Medium |
Major Players *Disclaimer: Major Players sorted in no particular order Image © Mordor Intelligence. Reuse requires attribution under CC BY 4.0. | |
Connected TV Advertising Services Market Analysis by Mordor Intelligence
The connected TV advertising services market size is expected to increase from USD 24.85 billion in 2025 to USD 28.38 billion in 2026 and reach USD 56.19 billion by 2031, growing at a CAGR of 14.64% over 2026-2031. The connected TV advertising services market is benefiting from a lasting shift in television budgets toward streaming inventory, rather than a temporary change in campaign activity. In 2026, U.S. connected TV upfront spending reached USD 17.73 billion, exceeding USD 16.98 billion for primetime linear TV upfront spending for the first time. Household targeting, automated buying, and premium long-form programming are bringing mid-sized and local advertisers into the channel. Self-service platforms are reducing historic minimum-spend barriers and expanding the potential buyer base. Platform strategies increasingly combine authenticated audience data, commerce signals, buying tools, and measurement capabilities in a single offering.
Key Report Takeaways
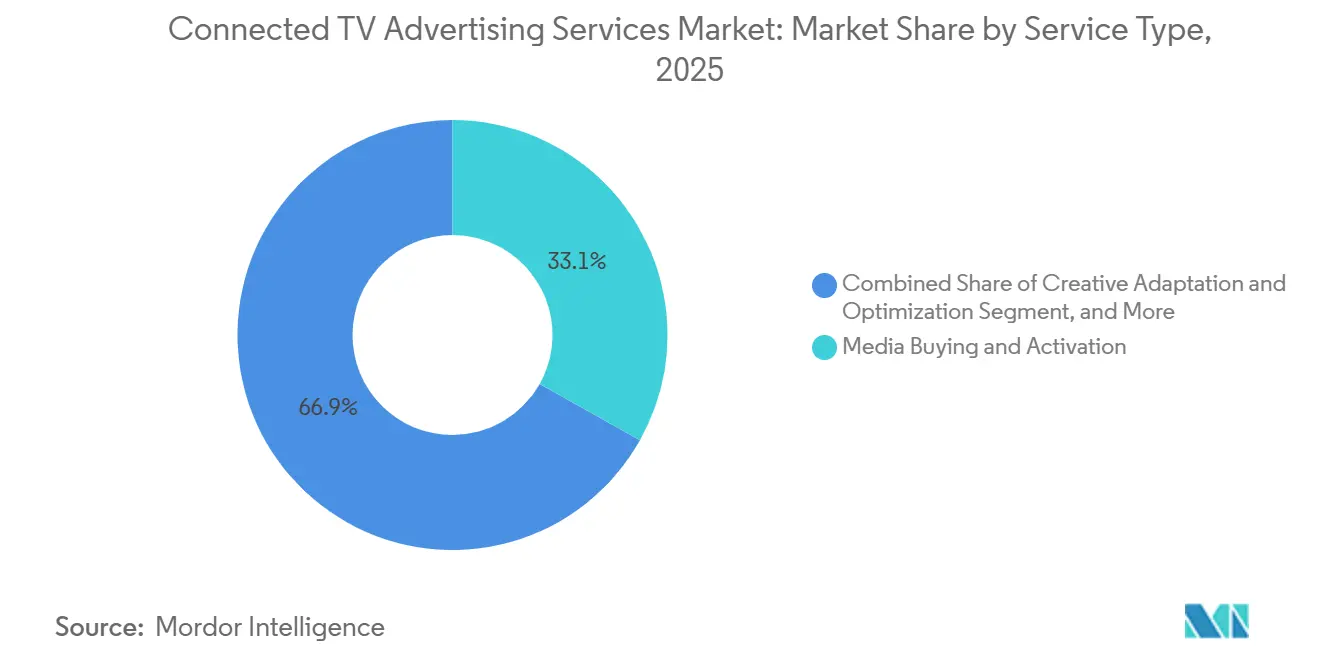
- By service type, Media Buying and Activation held 33.14% revenue share of the connected TV advertising services market in 2025, while Audience and Data Services are projected to expand at a 15.12% CAGR through 2031.
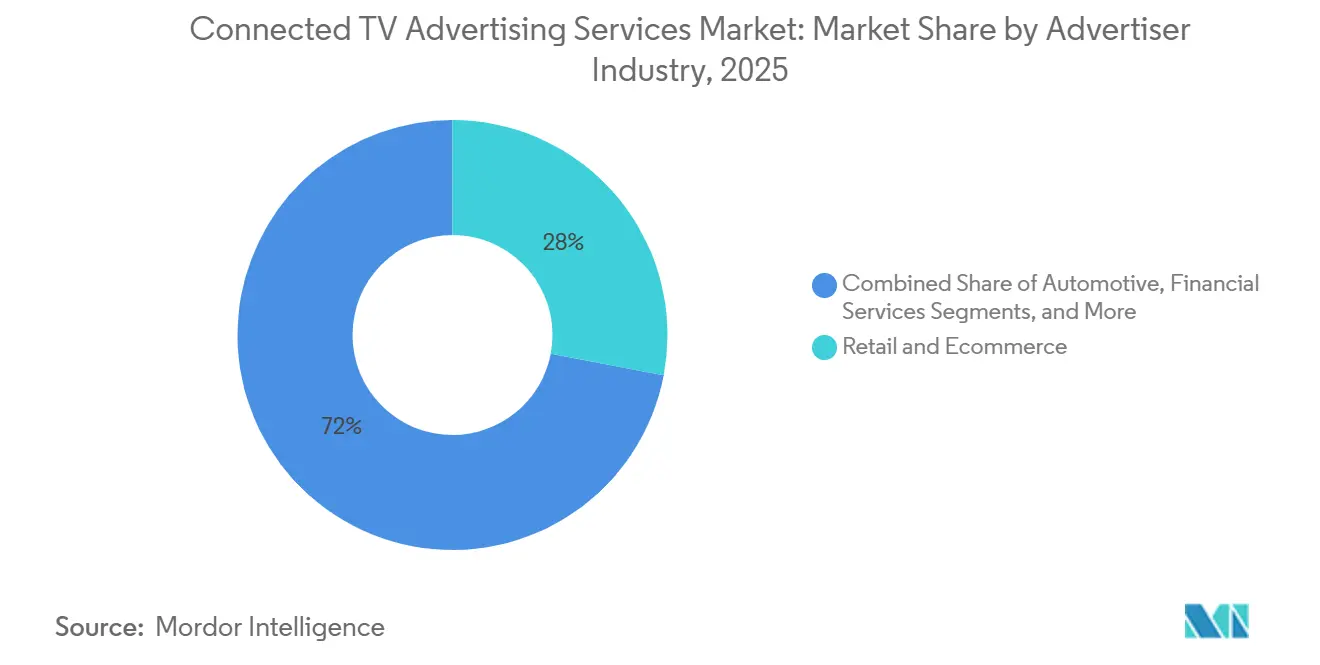
- By advertiser industry, Retail and Ecommerce accounted for 28% of the connected TV advertising services market size in 2025, while Media and Entertainment is projected to record a 15.06% CAGR through 2031.
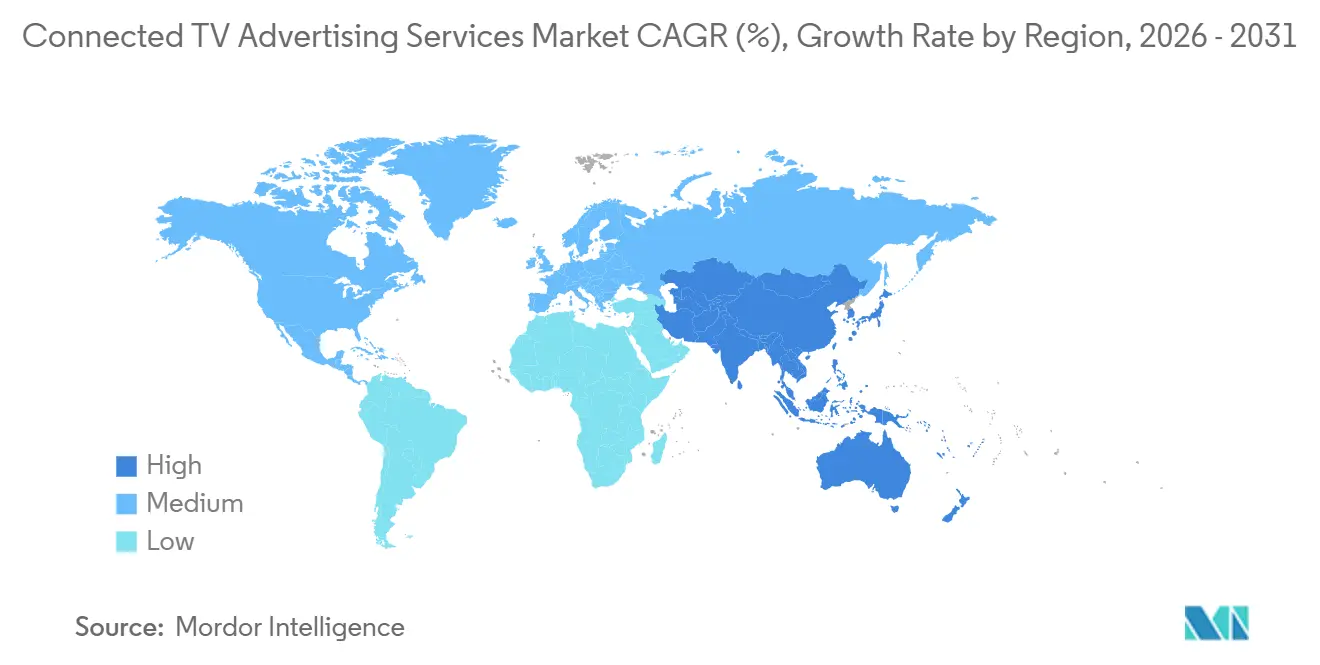
- By geography, North America held 45.71% revenue share in 2025, while Asia-Pacific is projected to grow at a 14.91% CAGR through 2031.
Note: Market size and forecast figures in this report are generated using Mordor Intelligence’s proprietary estimation framework, updated with the latest available data and insights as of January 2026.
Market Trends and Insights
Drivers Impact Analysis of Connected TV Advertising Services Market*
| Driver | (~) % Impact on CAGR Forecast | Geographic Relevance | Impact Timeline |
|---|---|---|---|
| Linear-To-Streaming Budget Reallocation | +4.8% | Global, North America and Europe core | Short term (≤ 2 years) |
| Programmatic and Self-Serve Buying Access | +2.9% | Global | Medium term (2-4 years) |
| Live Sports and Premium Event Rights Shift to Streaming | +2.3% | North America, Europe, Asia-Pacific | Short term (≤ 2 years) |
| Shoppable and Interactive CTV Formats | +1.8% | North America, Asia-Pacific | Medium term (2-4 years) |
| TV Operating Systems as Media Surfaces | +1.2% | Global | Medium term (2-4 years) |
| Clean-Room Commerce Signals for Targeting | +0.9% | North America and Europe | Long term (≥ 4 years) |
| Source: Mordor Intelligence | |||
Linear-To-Streaming Budget Reallocation Accelerates
The television budget movement toward streaming is expected to become structural by 2026. A Premion and Advertiser Perceptions survey found that most U.S. connected TV advertisers planned to increase spending in 2026, with average planned increases indicating meaningful budget expansion. Advertisers are reallocating these budgets from linear television, display, paid search, and social media, rather than funding them only through incremental spending. The survey also found that a notable share of connected TV investment came directly from linear television reallocation. Integrated or hybrid agency teams managed a majority of connected TV budgets, indicating that planning practices are changing as advertisers coordinate audience delivery, buying, and reporting across television environments. This operational shift affects campaign planning, inventory selection, frequency control, and the selection of measurement partners within the connected TV advertising services market. Platforms with authenticated first-party data and premium content rights are better positioned to retain budgets as advertisers demand clearer evidence of outcomes.[1]Advertiser Perceptions and Premion, “Survey: 70% of CTV Advertisers Plan to Boost Spending in 2026,” Premion, premion.com
Programmatic and Self-Serve Buying Broadens Advertiser Access
Programmatic infrastructure is extending access to the connected TV advertising services market beyond the managed-service model. Samsung Ads announced that Smart TV home screen inventory would become available through The Trade Desk and Google Display and Video 360 from Q3 2026. The arrangement uses Magnite’s SpringServe as the ad-serving layer and gives buyers a programmatic route to a prominent television interface. Automated access can help smaller advertisers test connected TV without the budgets traditionally required for direct deals, while allowing established buyers to apply common workflow controls across more inventory. It also gives agencies more flexibility to manage reach and frequency across publishers, devices, and campaign objectives. The expansion of self-service buying supports a broader group of advertisers while increasing the importance of transparent supply paths, seller disclosures, and reliable delivery reporting.[2]Samsung, “Samsung Launches Performance TV: Full-Funnel Performance Platform and AI-Powered Ad Products,” Samsung Newsroom, news.samsung.com
Live Sports and Premium Event Rights Shift to Streaming
Live sports rights are moving premium audiences and scarce ad inventory toward streaming services. Amazon Prime Video and Rogers Communications announced a 12-year agreement that makes Prime Video Canada’s exclusive Wednesday night NHL broadcaster from the 2026-2027 season. The agreement includes at least 26 national regular-season games each season, as well as select Stanley Cup Playoff series. Premium live programming gives brands access to audiences that may not be reached through on-demand inventory and gives publishers a high-attention setting for brand campaigns. Fragmented rights also encourage buyers to use demand-side platforms that can manage campaigns across multiple services, instead of negotiating every live event as a separate media plan. This makes platform-neutral buying infrastructure more valuable within the connected TV advertising services market.
Shoppable and Interactive CTV Formats Improve Lower-Funnel Performance
Interactive formats are making connected TV more effective for campaigns that require measurable actions after ad exposure. Amazon Ads and Publicis Media found that including QR codes significantly increased conversions. Samsung TV Plus reported that its Amazon DSP integration enabled remote-activated add-to-cart experiences, linking television viewing to a defined shopping action. The company reported 6 times higher brand searches and 5 times higher purchase rates than standard video for those experiences. These formats can connect premium video advertising with product discovery and purchase activity, which increases their relevance for retail advertisers seeking both reach and performance evidence. They can also require more tailored creative assets, clear product information, and measurement systems that capture activity after viewers leave the television screen. Healthcare adoption is likely to remain more limited because digital advertising and audience-targeting rules constrain conversion-focused execution.[3]Amazon Ads and Publicis Media, “New Interactive Video Ads Research Shows How to Engage Customers,” Amazon Ads, advertising.amazon.com
Restraints Impact Analysis of Connected TV Advertising Services Market*
| Restraint | (~) % Impact on CAGR Forecast | Geographic Relevance | Impact Timeline |
|---|---|---|---|
| Cross-Platform Measurement Fragmentation | -1.8% | Global | Short term (≤ 2 years) |
| Privacy and Identity Signal Loss | -1.4% | North America and Europe | Medium term (2-4 years) |
| Creative and Metadata Fragmentation | -0.9% | Global | Medium term (2-4 years) |
| Supply-Path Opacity and CTV Fraud | -1.1% | Global, Asia-Pacific highest risk | Short term (≤ 2 years) |
| Source: Mordor Intelligence | |||
Cross-Platform Measurement Standards Remain Fragmented
Measurement fragmentation remains a major operational constraint for buyers in the connected TV advertising services market. IAB published its Standardized Measurement Guide for Connected TV in December 2025, covering impressions, viewability, reach, frequency, and attention across direct and biddable buying paths. IAB Europe released a connected TV measurement framework and transparency principles for public comment in April 2026. The framework was developed with Amazon Ads, FreeWheel, Google, IAB UK, Magnite, Samsung Ads, and YouTube. These initiatives establish common definitions, but they do not yet deliver consistent cross-platform reach deduplication, especially where campaigns use different platforms, buying paths, and reporting systems. Buyers, therefore, continue to face difficulty comparing performance across direct publisher sales and programmatic transactions, which can delay budget decisions and make independent verification more important in the connected TV advertising services market.
Privacy and Identity Signal Loss Weakens Household Resolution
Household targeting relies on identity signals that are becoming less reliable in open advertising environments. Research from CIMM, Go Addressable, and Truthset found low IP-to-email and IP-to-postal match accuracy. The study also found that six identity vendors, given identical inputs, produced maps with very limited agreement, indicating that vendors can represent the same household differently. These findings challenge the household-resolution assumptions that support premium connected TV pricing and make campaign reach estimates harder to compare. Privacy requirements increase the value of authenticated environments with direct customer relationships, where companies can manage consent and identity signals more consistently. As a result, the connected TV advertising services market is likely to see a wider audience-quality gap between logged-in streaming services and open programmatic inventory.
*Our forecasts treat driver/restraint impacts as directional, not additive. The impact forecasts reflect baseline growth, mix effects, and variable interactions.
Connected TV Advertising Services Market Segment Analysis
By Service Type:
Programmatic Buying Leads, Data Orchestration AcceleratesMedia Buying and Activation held 33.14% of the connected TV advertising services market share in 2025. Its position reflects the role of programmatic guaranteed deals, private marketplaces, and direct publisher integrations in executing campaigns. Smart TV home screens are becoming another programmatic inventory source as device companies make those placements available to buyers. This supports service providers that can manage buying across premium publishers, TV operating systems, and streaming applications. Measurement and Attribution services are also becoming more important as standardized measurement guidance increases demand for verification and outcome reporting. IAB’s 2025 guide gives buy-side and sell-side organizations a common reference for valid signals across direct and biddable transactions.
Audience and Data Services is projected to expand at a 15.12% CAGR through 2031. Buyers are placing greater value on commerce-enriched and identity-resolved audience segments that can be activated against premium video inventory. WPP Media and Criteo launched a connected TV activation using real-time signals from more than 17,000 e-commerce sites that represented over USD 1 trillion in annual gross merchandise value. The approach uses curated deal IDs to reach high-intent shoppers across participating premium inventory. Media Planning and Strategy is also changing as agencies coordinate linear television and streaming planning through shared teams. Creative Adaptation and Optimization benefits from dynamic ad insertion and more personalized video production, especially for brands that lack internal production capacity in the connected TV advertising services market.



By Advertiser Industry:
Retail Commerce Anchors Spend, Entertainment Scales FastestRetail and Ecommerce accounted for 28% of the connected TV advertising services market size in 2025. Retailers can connect first-party purchase signals to premium video exposure and measure store or online outcomes more directly than traditional television allowed. Amazon DSP can activate Prime purchase signals, while Walmart Connect can use Vizio device data following Walmart’s Vizio acquisition. Target Roundel can also layer loyalty-card data against connected TV impressions. These capabilities make retail advertisers a strong source of demand for addressable video services. Walmart’s agreement to acquire Vibe.co further extends its connected TV offering toward small and mid-sized businesses that had been constrained by managed-service minimums.
Media and Entertainment is projected to record the highest advertiser-industry CAGR of 15.06% through 2031. Streaming services use connected TV advertising to promote programming across competing viewing environments and to support subscriber acquisition. Netflix disclosed 250 million monthly active viewers on its global ad-supported tier in May 2026. That audience makes Netflix both a significant source of inventory and an advertiser within the same connected TV ecosystem. Financial Services and Automotive also use household-level reach to address higher-income streaming audiences that are less available through linear television. Telecom, Travel and Hospitality, and Healthcare are increasing their use of the channel, although healthcare remains subject to digital advertising guidance and audience-targeting restrictions within the connected TV advertising services market.
Geography Analysis
North America Connected TV Advertising Services Market
North America held 45.71% of the connected TV advertising services market share in 2025. The region combines mature streaming adoption, retail media activity, and developed programmatic infrastructure. U.S. connected TV upfront spending reached USD 17.73 billion in 2026, surpassing USD 16.98 billion for primetime linear television upfront spending. Walmart’s Vizio and proposed Vibe.Co acquisitions strengthen its ability to connect commerce data, TV operating systems, and self-service advertising. Roku reported more than 90 million active households and achieved its first full year of GAAP profitability in 2025. The connected TV advertising services market in the region benefits from buyers who can combine retail data with established premium video reach.
APAC Connected TV Advertising Services Market
Asia-Pacific is projected to expand at a 14.91% CAGR through 2031, making it the fastest-growing regional area in the connected TV advertising services market. The region includes markets where streaming use, smart TV adoption, and programmatic buying are expanding from different starting points. Australia and South Korea have more mature digital video environments and are developing consent practices. Southeast Asia remains tied to broadband development and the growth of connected-device access. India has a large and growing connected TV audience, creating additional advertiser reach beyond linear television. Japan’s broadcaster video-on-demand expansion and wider programmatic adoption also support regional demand.
Europe, Middle East and South America Connected TV Advertising Services Market
Europe is the second-largest region and continues to gain momentum. European connected TV ad views grew 33% in the second half of 2025, compared with 11% in the United States. France recorded a 36% programmatic share of connected TV impressions in the first half of 2025. GDPR and ePrivacy requirements raise the value of first-party data and clean-room partnerships across European markets. In the Middle East, connected TV grew faster than the overall digital advertising environment, led by the UAE and Saudi Arabia. South America remains at an earlier stage, while FAST channel growth in Portuguese and Spanish can expand smart TV household reach in Brazil and Argentina.

Competitive Landscape
The connected TV advertising services market has a concentrated platform tier and a more fragmented layer of measurement, audience data, creative services, and mid-sized advertiser tools. Google, Amazon, Netflix, Roku, Samsung, and other major platforms benefit from large authenticated audiences, premium inventory, or both. Amazon’s demand-side platform can pair commerce data with video inventory, supporting a broader advertising proposition. YouTube’s scale also reinforces the role of large video platforms in connected TV buying. Large platforms can use their audience relationships to link advertising delivery with signals that support targeting and reporting. The resulting competition centers on data quality, access to premium supply, and the ability to show business outcomes.
Independent providers are responding through vertical integration and specialized measurement capabilities. Viant Technology completed its USD 40 million acquisition of TVision Insights in May 2026. The acquisition added second-by-second eyes-on-screen attention measurement across linear and connected television to Viant’s programmatic platform. This move addresses buyer demand for measurement that is independent of platform self-attribution. IAB’s standardized measurement guide also places greater focus on valid and comparable signals across buying paths. These developments leave room for providers that can improve verification, frequency management, audience quality, and transparency without owning the underlying media inventory.
Home screen inventory has become a strategic area of competition among television operating systems. Samsung opened Smart TV home screen inventory to programmatic buying through The Trade Desk and Google Display and Video 360, with a global rollout beginning in Q3 2026. Roku introduced Roku Curate in April 2026 to bring audience data and advertising inventory into a single solution. Walmart’s proposed acquisition of Vibe.co shows a separate focus on giving smaller advertisers access to connected TV through a self-service model. These moves show that platform companies are trying to control the entry point for advertisers as well as the viewing interface. The competitive landscape therefore rewards companies that combine accessible buying tools, first-party signals, trusted measurement, and premium inventory.
Connected TV Advertising Services Industry Leaders
The Walt Disney Company
Amazon.com, Inc.
Comcast Corporation
Warner Bros. Discovery, Inc.
Netflix, Inc.
- *Disclaimer: Major Players sorted in no particular order
Connected TV Advertising Services Market Companies Covered in this Report
- The Trade Desk, Inc.
- Google LLC
- Amazon.com, Inc.
- Roku, Inc.
- The Walt Disney Company
- Netflix, Inc.
- Comcast Corporation
- FreeWheel Media, Inc.
- Magnite, Inc.
- PubMatic, Inc.
- Innovid Corp.
- DoubleVerify Holdings, Inc.
- Integral Ad Science Holding Corp.
- Nexxen International Ltd.
- Samsung Electronics Co., Ltd.
- LG Electronics Inc.
- Yahoo Inc.
- Microsoft Corporation
- Viant Technology Inc.
- VideoAmp, Inc.
- iSpot.tv, Inc.
- Paramount Global
- Warner Bros. Discovery, Inc.
- Tatari, Inc.
- Simulmedia, Inc.
- OpenAP LLC.

Recent Industry Developments in Connected TV Advertising Services Market
- July 2026: Amazon Prime Video and Rogers Communications announced a 12-year sublicensing agreement for Prime Video to exclusively broadcast Wednesday night national NHL games in Canada beginning the 2026-2027 season, covering at least 26 regular-season games and select Stanley Cup Playoff series annually. The deal represents a live sports rights migration to streaming that is expected to draw performance-focused advertisers into premium sports-adjacent connected TV inventory.
- June 2026: Walmart announced an agreement to acquire Vibe.co, a self-serve connected TV platform for small and mid-sized businesses, for a reported consideration of USD 1.4 billion. The transaction builds on Walmart’s prior acquisition of Vizio and integrations with Magnite, Google DV360, and Yahoo DSP, positioning Walmart Connect as a commerce-first connected TV ecosystem competing directly with Amazon’s first-party audience graph.
- June 2026: Samsung Ads announced programmatic access to Smart TV home screen inventory via The Trade Desk and Google Display and Video 360, using Magnite’s SpringServe as the ad-server layer, with global rollout beginning Q3 2026. Samsung’s home screen is present in 67.8 million U.S. households, or 32% of all U.S. smart TV households, making this one of the largest single connected TV inventory events of 2026.
- May 2026: Viant Technology closed its acquisition of TVision Insights for USD 40 million, adding second-by-second eyes-on-screen attention measurement across linear and connected TV to Viant’s AI-powered programmatic platform and enabling independent measurement outside of walled-garden self-attribution.


Global Connected TV Advertising Services Market Report Scope
The Connected TV Advertising Services Market refers to the ecosystem of agencies, platforms, and managed services that help advertisers plan, buy, create, target, optimize, and measure ads delivered on internet-connected television screens. It includes campaign management, programmatic buying, audience segmentation, creative production, and performance analytics across smart TVs, streaming devices, and CTV apps.
The Connected TV Advertising Services Market Report is Segmented by Service Type (Media Planning and Strategy, Media Buying and Activation, Audience and Data Services, Measurement and Attribution, and Creative Adaptation and Optimization), Advertiser Industry (Retail and Ecommerce, Media and Entertainment, Automotive, Telecom, Financial Services, Healthcare, and Travel and Hospitality), and Geography (North America, South America, Europe, Asia-Pacific, Middle East, and Africa). The Market Forecasts are Provided in Terms of Value (USD).
| Media Planning and Strategy |
| Media Buying and Activation |
| Audience and Data Services |
| Measurement and Attribution |
| Creative Adaptation and Optimization |
| Retail and Ecommerce |
| Media and Entertainment |
| Automotive |
| Telecom |
| Financial Services |
| Healthcare |
| Travel and Hospitality |
| Other Advertiser Industries |
| North America | United States |
| Canada | |
| Mexico | |
| South America | Brazil |
| Argentina | |
| Chile | |
| Colombia | |
| Rest of South America | |
| Europe | United Kingdom |
| Germany | |
| France | |
| Italy | |
| Spain | |
| Netherlands | |
| Nordics | |
| Russia | |
| Rest of Europe | |
| Asia-Pacific | China |
| Japan | |
| India | |
| South Korea | |
| Australia and New Zealand | |
| Southeast Asia | |
| Rest of Asia-Pacific | |
| Middle East | Saudi Arabia |
| United Arab Emirates | |
| Turkey | |
| Rest of Middle East | |
| Africa | South Africa |
| Nigeria | |
| Egypt | |
| Rest of Africa |
| By Service Type | Media Planning and Strategy | |
| Media Buying and Activation | ||
| Audience and Data Services | ||
| Measurement and Attribution | ||
| Creative Adaptation and Optimization | ||
| By Advertiser Industry | Retail and Ecommerce | |
| Media and Entertainment | ||
| Automotive | ||
| Telecom | ||
| Financial Services | ||
| Healthcare | ||
| Travel and Hospitality | ||
| Other Advertiser Industries | ||
| By Geography | North America | United States |
| Canada | ||
| Mexico | ||
| South America | Brazil | |
| Argentina | ||
| Chile | ||
| Colombia | ||
| Rest of South America | ||
| Europe | United Kingdom | |
| Germany | ||
| France | ||
| Italy | ||
| Spain | ||
| Netherlands | ||
| Nordics | ||
| Russia | ||
| Rest of Europe | ||
| Asia-Pacific | China | |
| Japan | ||
| India | ||
| South Korea | ||
| Australia and New Zealand | ||
| Southeast Asia | ||
| Rest of Asia-Pacific | ||
| Middle East | Saudi Arabia | |
| United Arab Emirates | ||
| Turkey | ||
| Rest of Middle East | ||
| Africa | South Africa | |
| Nigeria | ||
| Egypt | ||
| Rest of Africa | ||


Key Questions Answered in the Report
What is the connected TV advertising services market size?
The connected TV advertising services market was USD 24.85 billion in 2025 and is projected to reach USD 56.19 billion by 2031, at a CAGR of 14.64% from 2026 to 2031. The forecast reflects an ongoing shift in television budgets toward streaming inventory and more measurable buying methods. Premium inventory, automated transactions, and audience data increasingly shape the channels commercial value.
What is driving demand for connected TV advertising services?
Budget movement from linear TV, programmatic access, premium live sports, and commerce-linked advertising formats are supporting demand. The connected TV advertising services market also benefits when self-service tools allow smaller advertisers to test premium video without traditional direct-buying barriers. Advertisers can also use these tools to manage campaigns across more connected television publishers.
Which service type leads connected TV advertising services?
Media Buying and Activation led with a 33.14% share in 2025, while Audience and Data Services is projected to expand at a 15.12% CAGR through 2031. The connected TV advertising services market relies on buying services to execute direct and programmatic transactions across varied publisher and operating-system inventory. Measurement, attribution, planning, and creative services support this broader delivery process.
Which advertiser category has the strongest demand?
Retail and Ecommerce held 28% in 2025 because its first-party purchase data can support closed-loop measurement across television exposure and conversion. This use of commerce signals gives the connected TV advertising services market a clearer route to outcome reporting than conventional television buying. It also materially connects retail media activity with premium long-form streaming inventory.
Which region leads connected TV advertising services?
North America held 45.71% in 2025, while Asia-Pacific is projected to record the fastest regional growth at a 14.91% CAGR through 2031. The connected TV advertising services market in North America benefits from established streaming use, retail media activity, and programmatic infrastructure.
What are the principal barriers to wider connected TV adoption?
Cross-platform measurement differences, weaker identity signals, fraud, supply-path opacity, and fragmented creative or metadata practices can reduce buying confidence. These constraints require the connected TV advertising services market to improve comparability, verification, and authenticated reach before all buyers can apply the channel consistently.
Page last updated on:





