Computational Biology Market Size and Share
Market Overview
| Study Period | 2020 - 2031 |
|---|---|
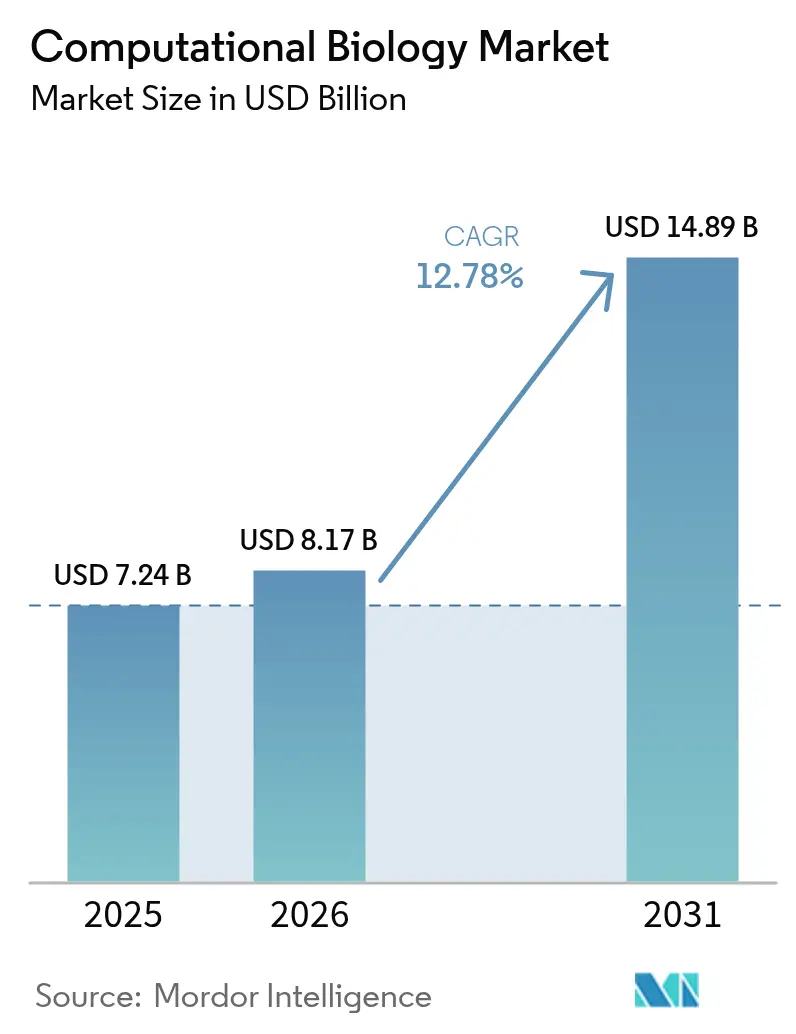
| Market Size (2026) | USD 8.17 Billion |
| Market Size (2031) | USD 14.89 Billion |
| Growth Rate (2026 - 2031) | 12.78% CAGR |
| Fastest Growing Market | Asia Pacific |
| Largest Market | North America |
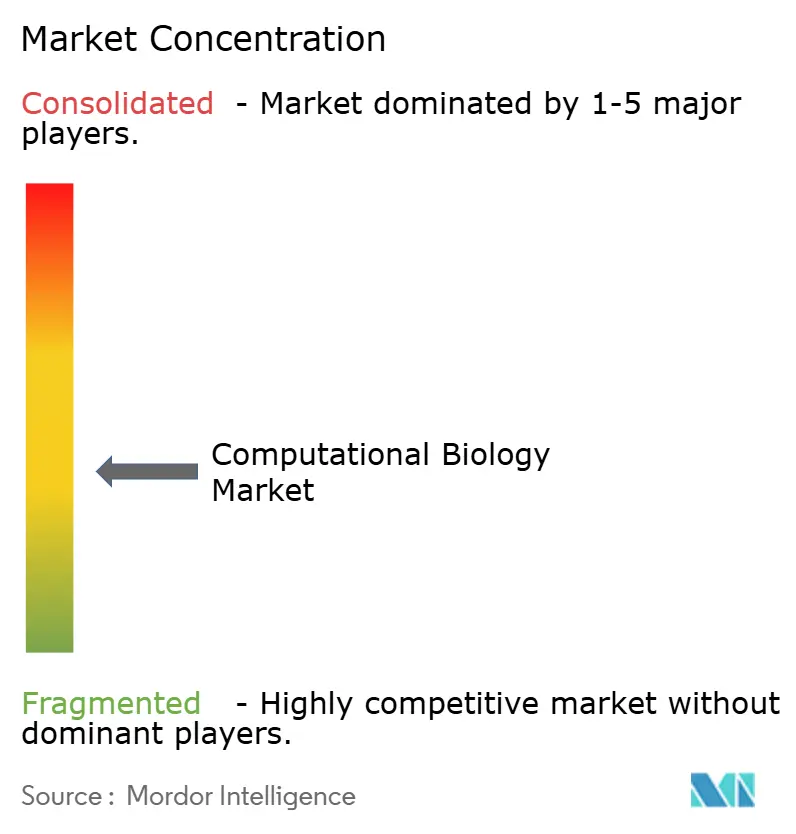
| Market Concentration | Medium |
Major Players *Disclaimer: Major Players sorted in no particular order Image © Mordor Intelligence. Reuse requires attribution under CC BY 4.0. | |
Computational Biology Market Analysis by Mordor Intelligence
Computational biology market size in 2026 is estimated at USD 8.17 billion, growing from 2025 value of USD 7.24 billion with 2031 projections showing USD 14.89 billion, growing at 12.78% CAGR over 2026-2031. This outlook signals how transformer-based genome language models, synthetic-biology digital twins, and wider AI adoption now shape every application layer of the computational biology market. A sharp rise in multi-omics datasets, ongoing shifts toward contract research services, and the need for scalable cloud infrastructure keep fueling demand. North America still anchors the computational biology market thanks to mature biotech regulation, but Asia-Pacific’s supercomputer investments and expanding pharmaceutical manufacturing base are positioning the region as the next growth engine. Meanwhile, strategic acquisitions such as Siemens’ USD 5.1 billion deal for Dotmatics reflect intensifying platform consolidation inside the computational biology market.
Key Report Takeaways
- By application, cellular and biological simulation accounted for 32.10% of the computational biology market share in 2025, while drug discovery and disease modeling are forecast to grow at a 15.33% CAGR through 2031.
- By tool, databases held the largest 35.95% share of the computational biology market size in 2025; however, analysis software and services are expected to expand at a 14.49% CAGR through 2031.
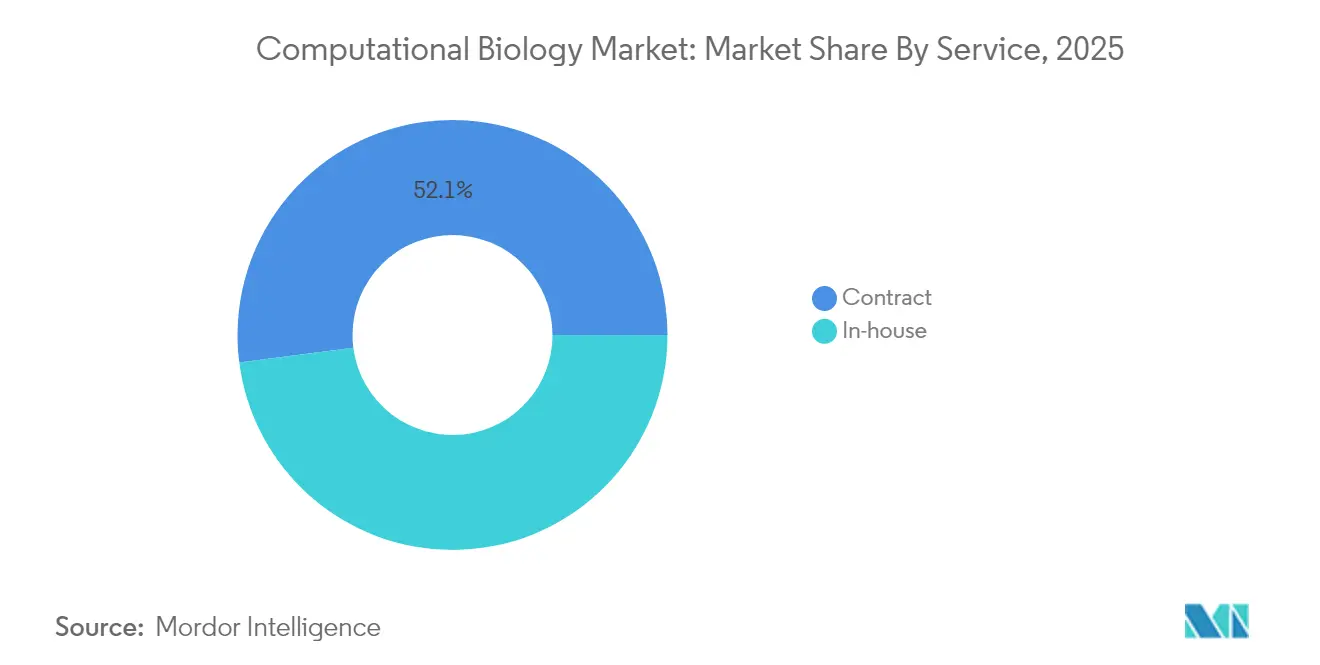
- By service model, contract arrangements accounted for 52.05% of the computational biology market share in 2025 and are projected to advance at a 15.72% CAGR through 2031.
- By end user, academia retained 44.10% revenue share in 2025, whereas industry and commercial users are projected to post a 14.27% CAGR to 2031.
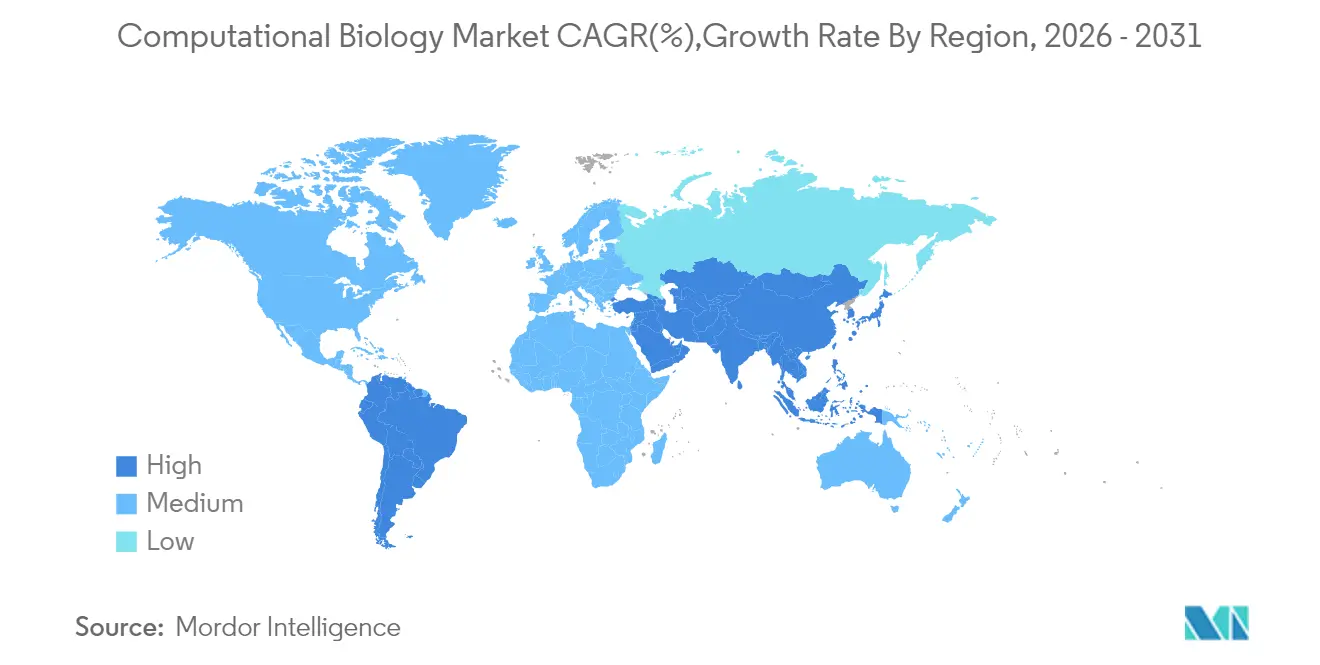
- By region, North America led with a 42.30% computational biology market share in 2025; the Asia-Pacific region shows the fastest 16.02% CAGR outlook through 2031.
Note: Market size and forecast figures in this report are generated using Mordor Intelligence’s proprietary estimation framework, updated with the latest available data and insights as of 2026.
Global Computational Biology Market Trends and Insights
Drivers Impact Analysis*
| Driver | (~) % Impact on CAGR Forecast | Geographic Relevance | Impact Timeline |
|---|---|---|---|
| Rising volume of omics data & bioinformatics research | +2.8% | Global, concentrated in North America and EU | Medium term (2–4 years) |
| Accelerated use in drug discovery & disease modeling | +3.1% | Global, led by North America, expanding to APAC | Short term (≤ 2 years) |
| Expansion of clinical pharmacogenomics & pharmacokinetics studies | +1.9% | North America and EU, emerging in APAC | Medium term (2–4 years) |
| Transformer-based genome language models enabling rapid annotation | +2.2% | Global, early adoption by research institutes | Short term (≤ 2 years) |
| Synthetic-biology digital twins for in-silico workflows | +1.7% | North America and EU, pilots in APAC | Long term (≥ 4 years) |
| Open-source single-cell lineage-tracing algorithms | +1.5% | Global, academic-led with industry uptake | Medium term (2–4 years) |
| Source: Mordor Intelligence | |||
Rising volume of omics data & bioinformatics research
Terabyte-scale single-cell RNA-sequencing, multi-omics integration, and lower sequencing costs continue to expand data flows into the computational biology market. Advances in sequencing have cut RNA-seq costs by 50-70%, widening access to precision-medicine datasets. Large language models now automate 94% of common data-element mapping, driving interoperability.[1]Rodney Alan Long, Jordan Klebanoff, and Vince D. Calhoun, “A New AI-Assisted Data Standard Accelerates Interoperability in Biomedical Research,” medRxiv, medrxiv.orgThe resulting data network effects reinforce first-mover advantages for stakeholders controlling the largest repositories. Cloud bioinformatics platforms therefore have become mandatory infrastructure for organizations lacking on-premises high-performance computing.
Accelerated use in drug discovery & disease modeling
Protein language models, such as ESM-3, simulate evolutionary processes, creating novel protein candidates at a pace that drug developers could not achieve a few years ago. Hybrid AI–quantum systems, exemplified by Model Medicines’ GALILEO, now deliver 100% hit-rate antiviral screens.[2]Model Medicines Communications Team, “The Future of Drug Discovery: 2025 as the Inflection Year for Hybrid AI and Quantum Computing,” Model Medicines, modelmedicines.comDigital twins enable researchers to run millions of virtual experiments, thereby compressing hypothesis-testing cycles and reducing wet-lab costs. A 479,000-trial machine-learning benchmark provides unprecedented training data for trial-design optimization. M&A activity, such as the USD 688 million Recursion-Exscientia merger, shows incumbents racing to internalize these AI advantages and consolidate platforms.
Expansion of clinical pharmacogenomics & pharmacokinetics studies
Preemptive pharmacogenomics testing cut psychiatric adverse drug reactions by 34.1% and hospitalizations by 41.2%.[3]Maria Skokou, Konstantinos Tziomalos, and Georgios Papazisis, “Clinical Implementation of Preemptive Pharmacogenomics in Psychiatry,” eBioMedicine, thelancet.com Real-world panels show 60.4% of patients receive at least one actionable prescription. UCLA leveraged a 342,000-person biobank to identify 156 genes that modulate statin efficacy, providing proof that genetic diversity improves dosing accuracy. AI-enhanced PK/PD models now account for population-specific variants, a requirement as the adoption of pharmacogenomics in the Asia-Pacific region rises.
Transformer-based genome language models enabling rapid annotation
Open-source protein models deliver AlphaFold-class performance while requiring only commodity GPUs. Bidirectional DNA foundation models, such as JanusDNA, process 1 million base pairs without specialized hardware. Parameter-efficient fine-tuning methods, such as LoRA, reduce training costs while maintaining or improving downstream prediction accuracy. These gains democratize advanced analytics and lower barriers to entry, extending the computational biology market well beyond traditional bioinformatics centers.
Restraints Impact Analysis*
| Restraint | (~) % Impact on CAGR Forecast | Geographic Relevance | Impact Timeline |
|---|---|---|---|
| Shortage of multidisciplinary talent | -1.8% | Global, acute in North America and EU | Short term (≤ 2 years) |
| Interoperability & data-standardization gaps | -1.2% | Global, especially cross-border collaborations | Medium term (2–4 years) |
| Escalating cloud & compute costs | -0.9% | Global, strongest effect in cost-sensitive markets | Short term (≤ 2 years) |
| Biosecurity & dual-use regulatory scrutiny | -0.7% | Mainly North America and EU, expanding worldwide | Long term (≥ 4 years) |
| Source: Mordor Intelligence | |||
Shortage of multidisciplinary talent
The demand for professionals with expertise in biology, software engineering, and statistics outstrips the supply. Life-science employers anticipate a 35% shortfall by 2030, with hiring demand projected to grow at an annual rate of 11.75%. Salary inflation and project delays follow, particularly for mid-sized biotechs that compete with tech giants entering the field. Skills-based hiring, apprenticeships, and cross-industry recruitment are interim mitigation strategies.
Interoperability & data-standardization gaps
While Matrix and Analysis Metadata Standards (MAMS) begin to align single-cell datasets, broad harmonization remains elusive. Semantic mapping tools can integrate unstructured health records; however, implementation burdens slow their adoption. Federated-learning pilots protect privacy but still confront regulatory uncertainty, leaving multinational studies reliant on manual data cleaning.
*Our forecasts treat driver/restraint impacts as directional, not additive. The impact forecasts reflect baseline growth, mix effects, and variable interactions.
Segment Analysis
By Application: Drug discovery and disease modeling power next-generation workflows
Drug discovery and disease modeling already post the fastest 15.33% CAGR, whereas cellular and biological simulation retained a 32.10% stake in the computational biology market size by 2025. AI-enhanced target identification and lead optimization enable companies like Insilico Medicine to screen millions of compounds in silico. Preclinical teams now integrate genomic, proteomic, and metabolomic data sets to raise compound-to-clinic success odds. Clinical-trial operations utilize retrieval-augmented systems that achieve 97.9% eligibility-screening accuracy, thereby reducing recruitment bottlenecks. A growing number of investigators are exploiting digital twins to conduct virtual dose-response studies, thereby shrinking wet-lab timelines. Consequently, the computational biology market experiences deeper pharmaceutical engagement at every stage of R&D.
Human-body simulation software emerges as a high-potential sub-segment. Stanford’s AI-driven “virtual cell” illustrates how integrated multi-omics and biophysical models can map pathway perturbations for individualized therapy strategies. This development expands the computational biology market to frontline precision-medicine clinicians. As digital twin fidelity increases, insurers start evaluating reimbursement models for computer-optimized treatment plans, indicating potential opportunities for downstream revenue streams.


By Tool: Analysis software accelerates AI integration
Databases still account for 35.95% of the computational biology market share, but analysis software and services chart the fastest growth at 14.49% CAGR. Protein and genome language models are prompting organizations to invest in analytical capacity rather than maintaining static archives. Vendors embed multimodal data pipelines that fuse genomic, proteomic, and clinical streams. The shift also encourages academic-industry consortia to co-develop open-source stacks; Boltz-1’s AlphaFold-comparable accuracy on standard GPUs underscores how community innovation fuels wider adoption.
On-premises high-performance computing remains important for handling sensitive datasets; however, cloud cost curves and the maturity of managed services encourage migration. Providers differentiate by auto-scaling algorithms and security certifications. Database incumbents react by building analytics layers on top of repositories to defend their install base. The net effect increases competition yet lifts overall software quality, supporting sustained growth in the computational biology market.
By Service: Contract models dominate growth
Contract research services lead both share and velocity—52.05% in 2025 and a 15.72% CAGR outlook—as pharmaceutical companies outsource complex in-silico workflows. CROs now bundle genomic analysis, AI model development, and virtual screening in unified subscriptions. In-house teams retain core, IP-intensive algorithms but partner externally for computationally intensive simulations.
Hybrid service frameworks gain traction. Enterprises maintain data-governance nodes on premises while bursting to cloud-based CRO platforms for peak workloads. Strategic alliances distribute risk: clients pay usage-based fees, while providers guarantee service-level agreements that include regulatory support. As adoption increases, the computational biology market further integrates into traditional drug development value chains.
By End User: Industry adoption accelerates
Academia controlled 44.10% of the revenue in 2025, yet industry users captured momentum with a 14.27% CAGR through 2031. Declining sequencing costs, validated AI pipelines, and urgent therapeutic timelines drive pharmaceutical uptake. Enterprise buyers seek turnkey solutions that embed audit trails and comply with GxP regulations.
Academic institutions remain knowledge engines, pioneering algorithms later licensed commercially. To counter budget limits, universities are expanding partnership models where technology vendors provide compute credits in exchange for co-authorship and early access to feedback. This symbiosis sustains innovation funnels for the computational biology industry.
Geography Analysis
North America, commanding 42.30% 2025 revenue, benefits from deep biotech venture capital, mature regulator engagement, and a dense talent pool. The FDA’s evolving AI framework provides local firms with a more straightforward commercialization path than many of their peers. Thermo Fisher’s USD 2 billion multi-year domestic investment underscores confidence in infrastructure scalability; nonetheless, workforce shortages and rising cloud costs temper acceleration.
Asia-Pacific posts the highest 16.02% CAGR. Governments bankroll exaflop supercomputers—South Korea’s plan targets launch by 2025—while China’s distributed national centers already propel multi-omics projects. Regional pharmaceutical manufacturing booms, and genetic diversity research programs tailor AI models to local populations, creating edge-case data assets that are unavailable elsewhere. Decentralized clinical-trial pilots and mRNA platform build-outs reinforce long-term demand for computational biology market capabilities.
Europe maintains steady growth, anchored by cross-border consortia and robust data privacy safeguards. Ethical AI initiatives increase compliance overhead, yet also foster trust among payers and regulators. Digital-twin pilots align with public health goals to optimize resource utilization. Meanwhile, Latin America, Africa, and the Middle East are making progress as internet infrastructure and bioinformatics curricula expand. Partnerships with multinational pharmaceutical groups compensate for local funding gaps, ensuring gradual yet persistent market penetration in computational biology.

Competitive Landscape
The computational biology market remains moderately fragmented, but it shows a clear trend of mergers and acquisitions (M&A). Siemens’ USD 5.1 billion Dotmatics acquisition integrates lab informatics with industrial digital twin offerings, reflecting buyers’ desire for end-to-end stacks. Danaher brought Genedata into its portfolio, mirroring the same logic. Illumina collaborates with NVIDIA to speed GPU-powered omics analytics, an example of tech–biotech convergence.
Start-ups leverage open-source communities to punch above their weight. EvolutionaryScale raised USD 142 million to commercialize protein-generating AI that competes directly with incumbents’ proprietary chemistries. Patent filings surrounding hybrid quantum-classical models and lineage-tracing algorithms suggest an intensification of IP battles. Competitive success will hinge on access to curated datasets, scalable compute, and integrated workflows that minimize switching costs.
Large vendors pursue ecosystem lock-in through subscription licensing and data-network effects. Mid-tier players differentiate themselves through vertical specialization—single-cell analytics, digital twin engines, or pharmacogenomics toolkits. Price competition is muted because accuracy, regulatory compliance, and turnaround speed remain decisive purchase factors.
Computational Biology Industry Leaders
Dassault Systèmes SE
Schrödinger Inc.
Certara
Simulation Plus Inc.
Illumina Inc.
- *Disclaimer: Major Players sorted in no particular order

Recent Industry Developments
- June 2025: Illumina acquired SomaLogic for up to USD 425 million to broaden proteomics and biomarker capabilities, enlarging its multi-omics portfolio.
- April 2025: Siemens closed the USD 5.1 billion takeover of Dotmatics, merging R&D informatics with industrial digital-twin frameworks.
- February 2025: Illumina released constellation-mapped reads and 5-base sequencing solutions, set for commercial roll-out in 2026.
- January 2025: Illumina partnered with NVIDIA to accelerate multi-omics data pipelines using GPUs, targeting faster therapeutic discovery.


Research Methodology Framework and Report Scope
Market Definitions and Key Coverage
Our study defines the computational biology market as all software platforms, infrastructure tools, and specialized databases that deploy mathematical modeling, data analytics, and simulation techniques to interrogate biological, chemical, and clinical datasets across drug discovery, disease modeling, genomics, and proteomics workflows. According to Mordor Intelligence, revenues are captured at the point where a vendor licenses or provisions a solution or service to an end user, regardless of hosting model or commercial tier.
Scope exclusion: Academic freeware and open-source codes distributed without monetized support are not counted.
Segmentation Overview
- By Application
- Cellular & Biological Simulation
- Computational Genomics
- Computational Proteomics
- Pharmacogenomics
- Other Simulations (Transcriptomics/Metabolomics)
- Drug Discovery & Disease Modelling
- Target Identification
- Target Validation
- Lead Discovery
- Lead Optimization
- Preclinical Drug Development
- Pharmacokinetics
- Pharmacodynamics
- Clinical Trials
- Phase I
- Phase II
- Phase III
- Human Body Simulation Software
- Cellular & Biological Simulation
- By Tool
- Databases
- Infrastructure (Hardware)
- Analysis Software & Services
- By Service
- In-house
- Contract
- By End-User
- Academics
- Industry & Commercials
- By Geography
- North America
- United States
- Canada
- Mexico
- Europe
- Germany
- United Kingdom
- France
- Italy
- Spain
- Rest of Europe
- Asia-Pacific
- China
- Japan
- India
- Australia
- South Korea
- Rest of Asia-Pacific
- Middle East and Africa
- GCC
- South Africa
- Rest of Middle East and Africa
- South America
- Brazil
- Argentina
- Rest of South America
- North America
Detailed Research Methodology and Data Validation
Primary Research
Mordor analysts subsequently interviewed software architects, CRO bioinformaticians, academic core facility directors, and procurement leads across North America, Europe, and key Asia-Pacific hubs. Discussions validated spending ranges, typical price points, adoption curves for high-performance computing clusters, and emerging AI-enabled workflows, allowing us to fine-tune model assumptions that secondary sources could not quantify.
Desk Research
We first mapped the universe of addressable spending through public sources such as United States NIH budget tables, FDA clinical trial registries, Eurostat R&D expenditure files, Chinese Ministry of Science project catalogs, and patent counts from the Questel platform. These establish how much funded research could translate into paid computational tool demand. Supplementary inputs came from company 10-Ks, investor decks, peer-reviewed journals indexed on PubMed, association portals like the International Society for Computational Biology, and curated news flows pulled via Dow Jones Factiva. The desk review built a factual spine while highlighting data voids that required direct outreach. This list is illustrative; many other references informed intermediate checks and clarifications.
Market-Sizing & Forecasting
A top-down construct anchored on publicly disclosed life science R&D outlays, next-generation sequencing run volumes, and prevailing license penetration rates establishes the initial 2025 value. Supplier roll-ups of sampled average selling prices times installed base, channel checks on cloud usage fees, and import statistics for dedicated hardware act as selective bottom-up mirrors, reconciling totals. Core variables tracked include: a) funded genomics projects, b) cost per genome trends, c) average compute hours per in silico experiment, d) biologics pipeline counts, e) public-private AI partnership announcements, and f) server GPU shipments to bio pharma clusters. Forecasts deploy multivariate regression blended with scenario analysis, with weights stress tested against expert consensus before the five-year outlook is locked. Any residual gaps in supplier data are bridged through conservative interpolation using region-specific usage coefficients.
Data Validation & Update Cycle
Outputs pass a three-layer review: variance checks versus historical series, cross-comparison with alternate data signals, and senior analyst audits. The model refreshes annually, and an interim sweep is triggered if funding shocks, major M&A, or disruptive regulatory changes occur; a final pre-publication sweep ensures clients always receive the freshest view.
Why Mordor's Computational Biology Baseline Commands Confidence
Published estimates often diverge because firms frame the market differently, convert currencies on separate base years, or embed unvetted growth premiums.
Key gap drivers include whether free academic software is counted, how hybrid cloud subscriptions are annualized, and if tools bundled inside larger bioinformatics suites are unbundled. Mordor's scope excludes non-monetized freeware, applies a transparent 2025 currency baseline, and re-benchmarks adoption rates every twelve months, preventing over or under shooting that can arise when refresh cadences stretch longer.
Benchmark comparison
| Market Size | Anonymized source | Primary gap driver |
|---|---|---|
| USD 7.24 B (2025) | Mordor Intelligence | - |
| USD 5.90 B (2024) | Global Consultancy A | Includes only software platform revenues; omits infrastructure and database layers |
| USD 7.18 B (2025) | Industry Association B | Counts some government-funded open-source projects as paid equivalents |
| USD 9.13 B (2025) | Regional Consultancy C | Aggregates adjacent bioinformatics services, inflating total value |
In summary, the disciplined scope definition, twice checked variables, and timely update cadence employed by Mordor Intelligence furnish decision makers with a balanced, traceable baseline that avoids both optimistic overcounts and conservative underruns common elsewhere.


Key Questions Answered in the Report
What is the current size of the computational biology market?
The computational biology market generates USD 8.17 billion in 2026 and is on track to hit USD 14.89 billion by 2031.
Which application area is expanding fastest?
Drug discovery and disease modeling posts the highest 15.33% CAGR through 2031, driven by AI-enabled target identification and digital-twin workflows.
Why are contract research services growing rapidly?
Pharmaceutical firms outsource data-intensive modeling to specialized CROs, giving contract services a 52.05% share and a 15.72% growth rate.
Which region will contribute most to future growth?
Asia-Pacific leads with a 16.02% CAGR thanks to government supercomputer projects and rapidly expanding pharmaceutical manufacturing.
What is hindering wider adoption of computational biology platforms?
A shortage of multidisciplinary talent, rising cloud-compute costs, and evolving biosecurity regulations are the main constraints.
Page last updated on:


