
Market Overview
| Study Period | 2020 - 2031 |
|---|---|
| Forecast Data Period | 2026 - 2031 |
| Base Year Market Size (2025) | USD 39.01 Billion |
| Market Size (2026) | USD 40.65 Billion |
| Market Size (2031) | USD 49.94 Billion |
| Growth Rate (2026 - 2031) | 4.21 % |
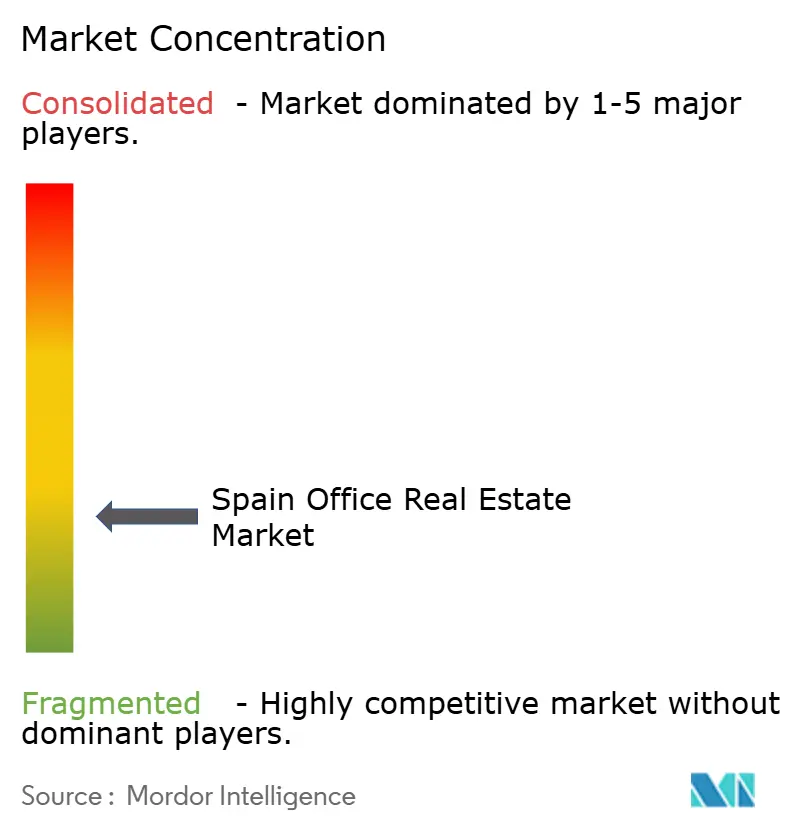
| Market Concentration | Low |
Major Players *Disclaimer: Major Players sorted in no particular order Image © Mordor Intelligence. Reuse requires attribution under CC BY 4.0. | |
Spain Office Real Estate Market Analysis by Mordor Intelligence
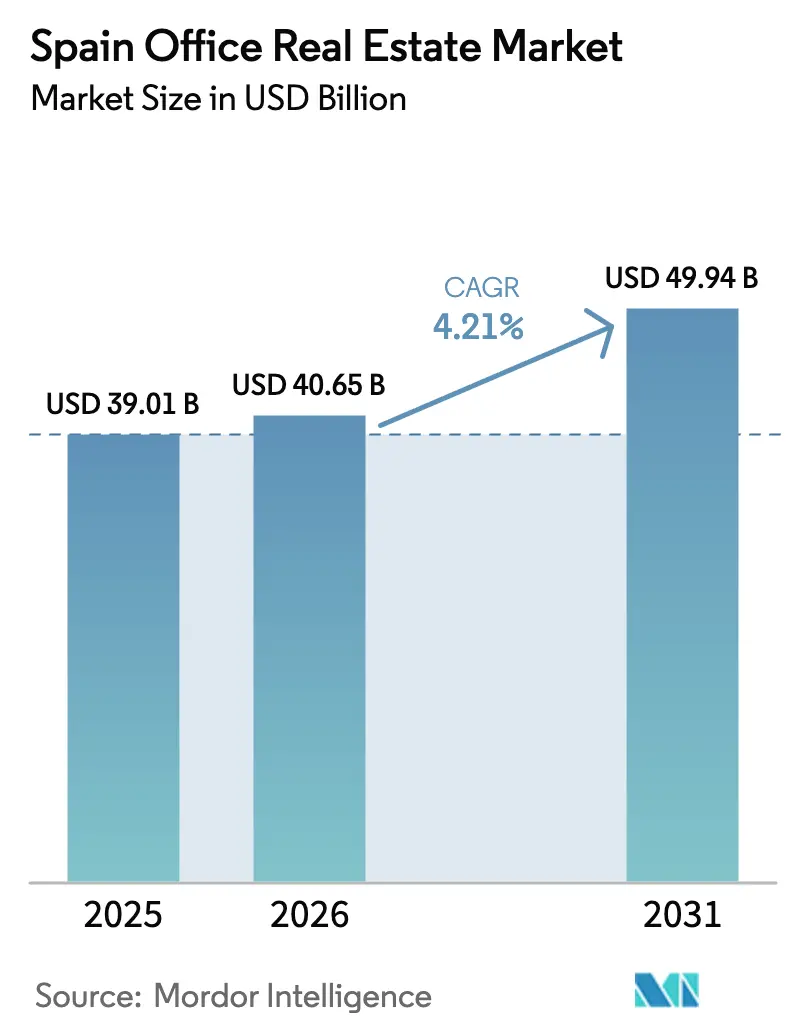
The Spain office real estate market size is expected to grow from USD 39.01 billion in 2025 to USD 40.65 billion in 2026 and is forecast to reach USD 49.94 billion by 2031 at 4.21% CAGR over 2026-2031. Political stability, competitive operating costs, and the positioning of Madrid and Barcelona as prime European hubs for technology and financial services support growth. Grade A buildings attract the bulk of leasing demand because their modern specifications match hybrid-work requirements and rising ESG standards. Flexible leases remain the preferred route for occupiers, with rental transactions accounting for the lion’s share of activity. Foreign direct investment momentum is intact as evidenced by the jump in financial-services projects and by institutional appetite for certified green assets that offer dependable cash flows.[1]
Key Report Takeaways
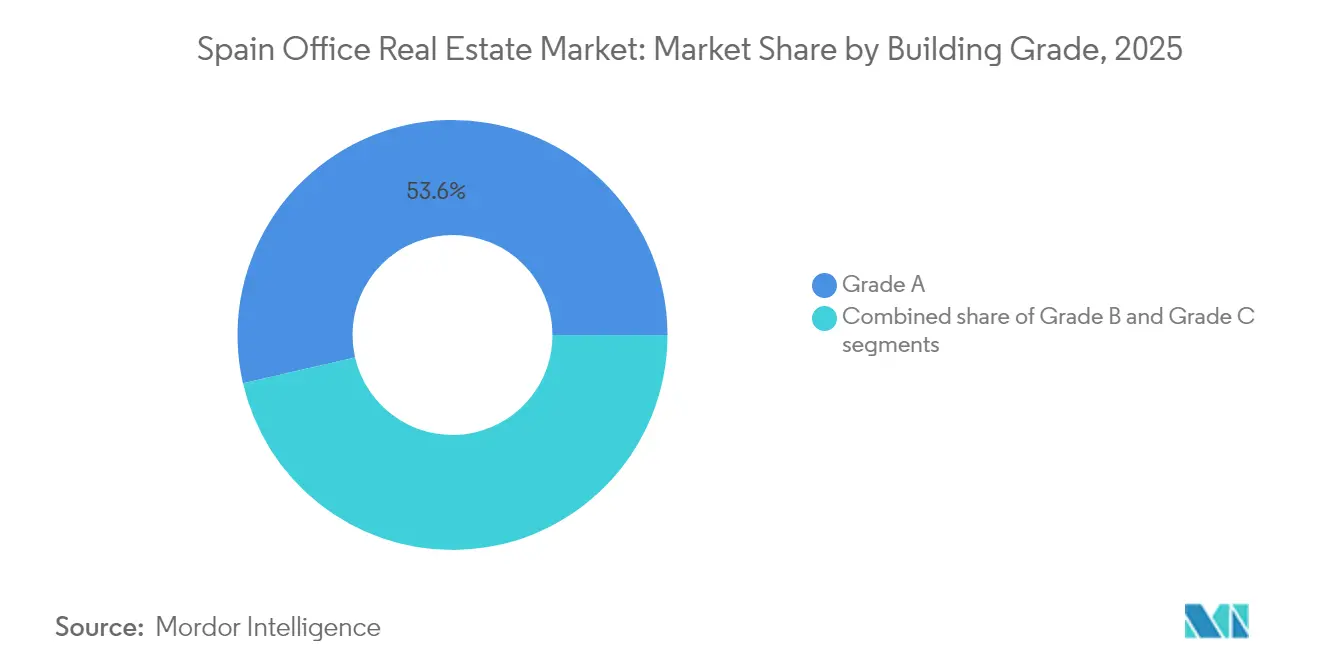
- By building grade, Grade A assets held 53.60% of the Spain office real estate market share in 2025, while Grade B stock is projected to post the fastest 4.58% CAGR to 2031.
- By transaction type, the rental segment dominated with 78.30% of revenue in 2025; sales transactions are expected to grow at a 4.73% CAGR through 2031.
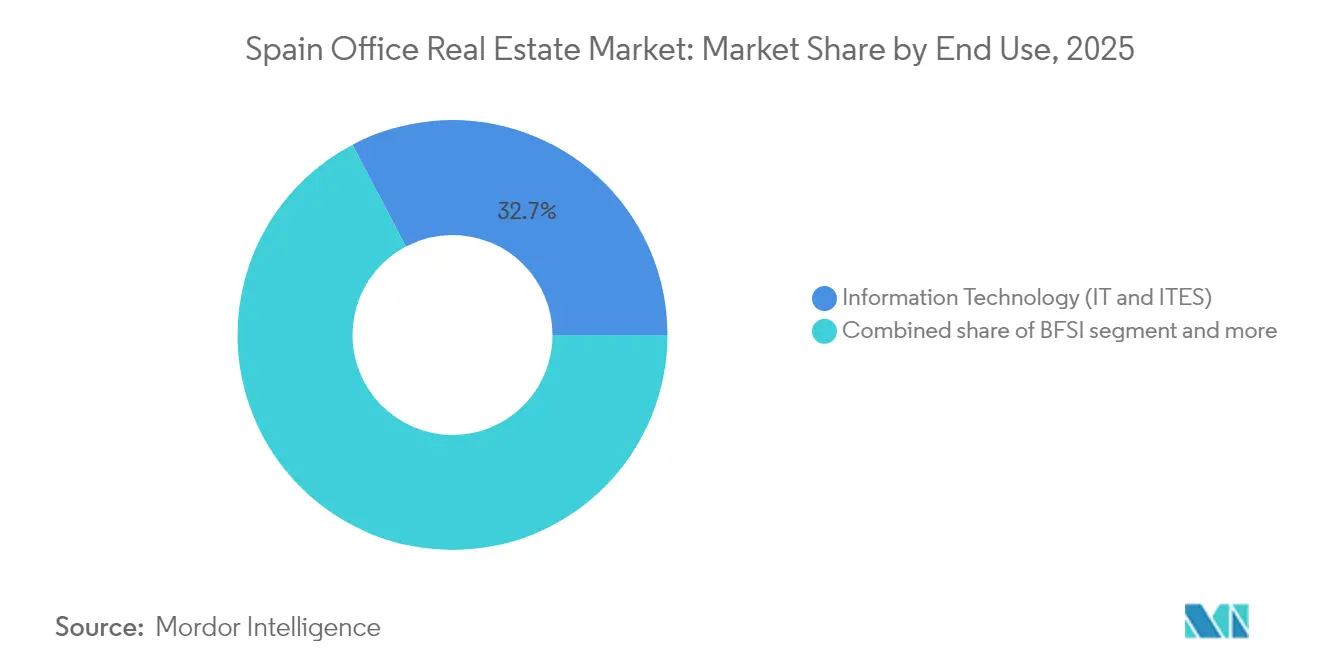
- By end use, information technology and IT-enabled services captured 32.70% of demand in 2025, and this segment is set to expand at a 4.92% CAGR to 2031.
- By city, Madrid commanded 41.40% of total activity in 2025, whereas Valencia is forecast to witness the highest 5.12% CAGR to 2031.
Note: Market size and forecast figures in this report are generated using Mordor Intelligence’s proprietary estimation framework, updated with the latest available data and insights as of 2026.
Spain Office Real Estate Market Trends and Insights
Drivers Impact Analysis*
| Driver | (~) % Impact on CAGR Forecast | Geographic Relevance | Impact Timeline |
|---|---|---|---|
| Expansion of tech and startup ecosystems | +1.2% | Madrid, Barcelona, spillover to Valencia | Medium term (2-4 years) |
| Nearshoring of IT and shared service centers | +0.8% | Madrid, Barcelona, Valencia | Long term (≥ 4 years) |
| Surge in demand for flexible workspaces | +0.9% | National, major urban centers | Short term (≤ 2 years) |
| Institutional investor focus on ESG-compliant assets | +0.7% | Madrid, Barcelona prime zones | Medium term (2-4 years) |
| Government incentives for energy-efficient retrofits | +0.6% | National, emphasis on large cities | Long term (≥ 4 years) |
| Source: Mordor Intelligence | |||
Expansion of Tech and Startup Ecosystems in Madrid and Barcelona
Spain’s technology economy generated more than USD 129.6 billion in 2024 and employed 764,000 people, cementing Madrid and Barcelona as magnets for high-growth digital firms. Venture capital inflows surpassed USD 3.24 billion in 2024, encouraged by the 2022 Startup Law’s tax incentives and a network of 300-plus incubators. Barcelona’s 22 district alone accounted for 32% of annual leasing, proof that tech clustering drives rental premiums. Demand skews toward Grade A space larger than 1,000 m², enabling firms to embed sophisticated IT infrastructure. As startups mature into scale-ups, their need for long leases in top-spec buildings intensifies, ensuring steady absorption of the Spain office real estate market.
Nearshoring of IT and Shared Service Centers from Northern and Western Europe
Latin American corporates invested USD 72.2 billion in Spain between 2020 and 2024, launching 360 greenfield projects that often anchor back-office and software operations in Madrid or Barcelona. Although detailed Northern European nearshoring metrics are scarce, cost-competitive Spanish hubs serve as strategic gateways into both the EU and Latin America. Eight Advisory’s 2025 establishment of a Madrid base illustrates the draw of Spain’s 93% high-capacity network coverage and favorable labor costs. These factors underpin a long-duration uplift in the Spain office real estate market as corporates consolidate service-center footprints.
Surge in Demand for Flexible Workspaces and Hybrid Office Models
Hybrid work policies now cover 55% of Spanish employees, re-shaping space planning to favor collaboration-rich environments. CBRE acquired full ownership of Industrious, which reflects the growing institutional recognition of flexible workspace demand, while companies increasingly prioritize collaboration-focused designs over traditional density models. Valencia mirrors this pivot: requests for units above 1,000 m² rose sharply in 2024, led by technology occupiers seeking plug-and-play layouts. Although hybrid models marginally trim aggregate footprints, they boost demand for premium, experience-oriented buildings, lifting effective rents within the Spain office real estate market.
Institutional Investor Interest in Prime, ESG-Compliant Office Assets
European real estate investment is projected to grow 23% year on year to USD 231.1 billion in 2025, with value-add investors targeting non-prime stock for green upgrades. Spain’s buildings account for 30% of national energy use, and more than 80% hold low efficiency ratings, presenting ample retrofit opportunities. Colonial’s 99% green-certified USD 12.58 billion portfolio illustrates how sustainability drives high occupancy of 95% and steady rent growth. Heightened ESG regulation under the EU’s CSRD accelerates the bifurcation between future-ready assets and obsolete stock within the Spain office real estate market.[2]
Restraints Impact Analysis*
| Restraint | (~) % Impact on CAGR Forecast | Geographic Relevance | Impact Timeline |
|---|---|---|---|
| Persistent oversupply in non-core zones | -1.1% | Madrid, Barcelona secondary areas | Medium term (2-4 years) |
| High retrofit costs for outdated buildings | -0.8% | National, older urban stock | Long term (≥ 4 years) |
| Slow rebound in full-time occupancy | -0.7% | National, major cities | Short term (≤ 2 years) |
| Source: Mordor Intelligence | |||
Persistent Oversupply in Non-Core Office Zones of Major Cities
Madrid’s vacancy stood at 9% in 2024, yet prime CBD availability stayed below 5%, revealing a stark performance gap between core and fringe. Barcelona displayed a similar 11.36% city-wide vacancy, heavily centered in peripheral districts. Rent concessions in secondary areas erode landlord cash flow, while ESG-non-compliant buildings risk prolonged emptiness as occupiers gravitate to top-spec options. Without extensive upgrades, roughly 77% of Madrid’s stock could turn obsolete by 2030, locking in a structural drag on the Spain office real estate market.
High Retrofit Costs for Outdated Office Buildings
Europe needs USD 43.2 billion a year to raise low-rated assets to upcoming standards, yet only 17% currently comply. Spanish stock faces acute challenges due to aged mechanical systems and façades. Basel III rules have curtailed bank lending capacity by USD 135 billion, nudging owners toward pricier alternative financing. When projects occur in live buildings, tenant decanting inflates costs and disrupts rental income. Owners unwilling or unable to fund upgrades risk significant value erosion, deepening the split within the Spain office real estate market.
*Our forecasts treat driver/restraint impacts as directional, not additive. The impact forecasts reflect baseline growth, mix effects, and variable interactions.
Segment Analysis
By Building Grade: Premium Assets Drive Market Polarization
Grade A premises captured 53.60% of the Spain office real estate market share in 2025, highlighting the sharpening flight-to-quality trend. Prime Madrid rents reached USD 41.0/m²/month while Barcelona registered USD 32.1/m²/month, underscoring the pricing power of top-specification stock. Vacancy inside CBD corridors remained under 5%, demonstrating robust tenant preference for ESG-certified, tech-enabled workplaces. The Grade A slice of the Spain office real estate market size is forecast to grow at a 4.52% CAGR through 2031, well ahead of legacy categories. Demand is anchored by multinational expansions, particularly from the IT and financial sectors, which value energy-efficient systems capable of lowering total occupancy costs and advancing net-zero agendas.
Grade B and C buildings confront mounting obsolescence risk unless owners commit to deep retrofits. Roughly 77% of Madrid’s total inventory must receive meaningful ESG investments by 2030 to stay relevant. Value-add investors see upside in repositioning Grade B assets, yet feasible projects demand precise cap-ex control and agile leasing strategies. Colonial’s portfolio demonstrates the income resilience of an all-green Grade A strategy: its 95% occupancy and 6.3% rental uplift in 2024 outpaced the broader market. This dichotomy suggests future development pipelines will concentrate on premium, low-carbon stock, while secondary space may transition toward alternative uses.

By Transaction Type: Rental Dominance Reflects Market Flexibility
The rental format accounted for 78.30% of 2025 activity, reinforcing occupier appetite for agility as hybrid work alters long-term space planning. Leasing volumes benefited from Spain’s tenant-friendly structures that facilitate break clauses and term renegotiations. With a 3.4% growth in like-for-like rentals and an occupancy rate of 96.7%, Merlin Properties has contributed to the effectiveness of Spain's office real estate market leasing model. Although rentals remain dominant, sales transactions are expected to clock a 4.73% CAGR to 2031, suggesting a gradual rebound in institutional buying once pricing stabilizes.
Investor confidence is recovering alongside clearer asset repricing and regulatory visibility. Projected office investment could reach USD 2.16 billion in 2024, up 32% on 2023, with a heavy tilt toward ESG-compliant properties. Flexible-workspace operators form a growing tenant segment, often signing management agreements that bridge traditional leasing and turnkey service provision. As hybrid working matures, landlords that can blend core leases with flex options and hospitality-style amenities are best placed to retain tenants across cycles within the Spain office real estate market.
By End Use: Technology Sector Leads Demand Evolution
Information technology and IT-enabled services absorbed 32.70% of all leased space in 2025, solidifying the sector’s standing as the lead growth driver. The segment is forecast to expand at a 4.92% CAGR to 2031, outpacing other occupier groups. Spanish tech firms gravitate toward innovation districts such as Barcelona’s 22@, where single-tenant requirements above 1,000 m² are commonplace. BFSI demand remains healthy, buoyed by Madrid’s 14 fresh financial-services projects in 2024. Consultancies and professional-services groups exhibit more modest growth as remote-work uptake drives portfolio rationalization.
The Spain office real estate market size for technology occupiers is widening because companies need collaboration zones, robust connectivity, and green credentials to meet internal carbon targets. Valencia's office market highlights rising demand from the technology sector, with companies requiring spaces over 1,000 square meters to support growth and collaboration, as noted by BNP Paribas Real Estate. Sectors like Retail, Life Sciences, Energy, and Legal show varied trends, with Life Sciences and Energy poised for growth due to Spain's leadership in renewable energy and pharmaceuticals. The dominance of the technology sector emphasizes the need for future office developments to focus on high-speed connectivity, flexible layouts, and sustainable features aligned with tech companies' priorities.
Geography Analysis
Madrid’s command of 41.40% of 2025 volume reflects its twin roles as government seat and foremost finance hub. Fourteen new financial-services projects last year validate sustained foreign interest, lifting prime CBD rents to USD 41.0/m²/month and compressing vacancy inside 5%. The dichotomy between Grade A scarcity and fringe surplus deepens, granting core landlords pricing power but challenging owners of legacy assets. Without aggressive ESG refurbishments, more than three-quarters of the capital’s inventory risk will slip into functional obsolescence by 2030, creating both retrofit prospects and stranded-asset threats.
Barcelona leverages its globally ranked startup ecosystem and cosmopolitan brand to sustain office demand. The city logged a 22% jump in gross take-up and pushed prime rents to USD 32.1/m²/month, while its 22@ innovation district captured almost a third of all deals. Supply-side pressure persists in peripheral rings, keeping the overall vacancy rate at 11.36%. Still, investors favor Barcelona for its liquid leasing market, depth of talent, and proven rental growth when assets hold LEED or BREEAM certificates.
Valencia is evolving into Spain’s breakout office location. A historically tight vacancy of 4.3% and rent increases nearing 9% illustrate robust demand from technology, maritime logistics, and support-service occupiers. Prime rents at USD 18.4/m²/month remain competitive, yet the differential is narrowing against Madrid and Barcelona, attracting opportunistic capital. Elsewhere, cities such as Málaga, Seville, and Bilbao gain slow but steady traction as corporates seek cost-efficient back-office sites, aided by improving digital infrastructure.
Regulatory Landscape
Spain office real estate is operating under a tightening EU-led sustainability disclosure environment, alongside national housing and land-use measures that shape office supply decisions. The EU Corporate Sustainability Reporting Directive (CSRD) is raising expectations for large occupiers and owners, reinforcing tenant preference for certified, energy-efficient Grade A space and widening the obsolescence gap for inefficient stock.
In April 2026, Spain approved Real Decreto 326/2026 regulating the State Housing Plan 2026-2030 with a EUR 7 billion framework, which can indirectly affect the office market by supporting redevelopment dynamics and public-private programs that compete for land, capital, and construction capacity. In January 2026, a DGSJFP resolution clarified that a statement of responsibility can be sufficient to register commercial-to-residential changes of use in the Property Registry, creating a clearer administrative pathway for conversions of non-core, persistently vacant offices where municipal planning allows.
Value Chain Analysis
The value chain covers land assembly and planning, development and construction, leasing and asset management, and capital markets intermediation. On the demand and transaction side, global advisors such as CBRE, JLL, and Savills originate occupier searches and investor mandates, while Spanish REITs and landlords such as Merlin Properties and Colonial anchor the ownership and repositioning layer. Leasing remains central to monetization, with rentals accounting for 78.30% of market activity in 2025.
Upstream, architects, engineers, contractors, and building-systems suppliers are increasingly drawn into retrofit and repositioning work as ESG compliance becomes a differentiator for occupancy and rents. Policy-led programs influence this chain: the State Housing Plan 2026-2030 emphasizes public-private partnership structures for certain promotions on public land, and national initiatives to industrialize construction (PERTE for Housing Industrialization, EUR 1.3 billion) are intended to modernize delivery methods and cost structures, which can spill over into office refurbishment and mixed-use redevelopment pipelines when owners reconfigure obsolete assets.
Competitive Landscape
Market structure is moderately fragmented, with global advisors CBRE, Jones Lang LaSalle IP, Inc., and Savills vying against Spanish REITs Merlin Properties and Colonial. International brokers leverage cross-border client networks and deep capital-markets expertise to secure outsized roles in mega-deals. Local landlords, in turn, capture value through ownership positions and granular market knowledge. Merlin’s USD 994.7 million capital raise in 2024 finances a 200 MW data-center pipeline, expanding revenue streams beyond conventional office rents. Colonial’s 99% green-certified portfolio illustrates a premium rent and occupancy edge that peers aim to replicate.
Digitalization and ESG analytics form the next competitive frontier. CBRE deepened its flexible-workspace capability by acquiring the remainder of Industrious and integrated Turner & Townsend to enrich project-management offerings. Such moves address occupier demands for turnkey solutions that blend space, services, and sustainability metrics. Meanwhile, specialized value-add funds target older Grade B and C stock for repositioning, betting on regulatory shifts to drive rental re-rating. This dual track—premium core holding plus opportunistic refurb—defines current portfolio strategy in the Spain office real estate market.
Opportunities are most pronounced in emerging secondary cities where barriers to entry are lower and early-mover advantages endure. Local developers that forge municipal partnerships can secure prime parcels for mixed-use precincts integrating offices, residential units, and last-mile logistics. The popularity of tenant experience platforms and real-time energy dashboards favor managers able to invest in prop-tech stack, further separating leaders from laggards.
Spain Office Real Estate Industry Leaders
-
CBRE
-
Jones Lang LaSalle IP, Inc.
-
Savills
-
Cushman & Wakefield
-
Knight Frank
- *Disclaimer: Major Players sorted in no particular order
Market Opportunities and Future Outlook
Opportunities are consolidating around flight-to-quality and ESG-driven repositioning in Madrid and Barcelona, where prime pricing signals remain visible (prime rents around EUR 41/sqm in Madrid and EUR 31/sqm in Barcelona as of Q2 2026) along with yield benchmarks (around 4.50% in Madrid and 4.70% in Barcelona). With Grade A holding 53.60% share in 2025 and CBD availability tight in core corridors, owners and value-add investors have scope to upgrade Grade B assets to compete for technology-led demand (IT and ITES held 32.70% of demand in 2025) and to capture rental premiums tied to certified, tech-enabled buildings.
Non-core and functionally obsolete stock also creates scope for conversions and mixed-use redevelopment, supported by clearer registration treatment for change-of-use documentation following the DGSJFP resolution of January 2026 (subject to planning compliance). Capital activity is also visible: office investment reached EUR 1.634 billion in H1 2026, supporting liquidity for prime acquisitions and refurbishment business plans, while government programs under the State Housing Plan 2026-2030 provide an additional lever when office-to-residential or mixed-use projects align with local housing objectives and eligibility rules.
Recent Industry Developments
- April 2026: Savills Office Pulse 1T 2026: Spain office investment reached 950 million euros in Q1 2026. The publication points to a robust start to 2026 and supports demand for Grade A and prime assets.
- April 2026: CBRE Spain office market: Q1 2026 investment total 869 million euros (YoY surge). The data point indicates tighter cap rates and active leasing in core Madrid and Barcelona markets.
- April 2026: Savills published Office Pulse 1T 2026 reporting that office investment in Spain reached 950 million euros in the first quarter of 2026. The strongest start in 15 years highlights rising investor appetite for Spain's Grade A assets.
Research Methodology Framework and Report Scope
Market Definition and Coverage
For this methodology, the market represents the total value of office real estate activity in Spain, captured through office asset values linked to leasing and sales outcomes across the main business cities and secondary hubs.
Scope exclusions: It excludes residential, retail, hospitality, industrial property, and mixed-use value that cannot be reasonably split into office-only economics.
Segmentation Overview
- By Building Grade
- Grade A
- Grade B
- Grade C
- By Transaction Type
- Rental
- Sales
- By End Use
- Information Technology (IT & ITES)
- BFSI (Banking, Financial Services and Insurance)
- Business Consulting & Professional Services
- Other Services (Retail, Lifesciences, Energy, Legal)
- By City
- Madrid
- Barcelona
- Valencia
- Rest of Spain
Data Sources, Market Sizing, and Validation
Desk Research
Desk work starts by building a simple fact base for Spain offices, so later assumptions do not float without support. We reviewed public indicators and releases such as Banco de Espana and INE macro series, Eurostat construction and price statistics, and municipal planning portals for supply and permitting signals in large cities.
To connect space metrics with money, we leaned on market notes from organizations and publications such as the Bank for International Settlements (property statistics), OECD data for business activity, and official registries and public filings when available for transaction context. We also used company annual reports, investor presentations, and reputable press to sanity-check large leasing moves, refurbishments, and landlord strategies. For cross-checks on ownership and deal flow, we used paid subscriptions for company financials and news intelligence selectively, and the sources listed here are illustrative only because we also relied on other public references to clarify and validate inputs.
Primary Interviews and Surveys
Primary work focused on converting market activity into usable sizing inputs, especially where public data is not consistent by city. We spoke with a mix of landlords, brokers, asset managers, occupiers, and advisory professionals across Spain, and used their feedback to verify demand strength, pricing ranges, and the pace of new completions and refurbishments.
Distribution of primary research fieldwork respondents
| Company type | Respondent position |
|---|---|
| Top tier: 32% | CXOs: 15% |
| Mid tier: 50% | Functional/Unit leaders: 31% |
| Smaller Players: 18% | Managers: 54% |
Market-Sizing & Forecasting
The core sizing logic uses a top-down approach where demand and pricing signals are reconstructed city by city, and then rolled up to a national value. In practice, we start with the active office stock and pipeline by major city, and then apply observed leasing intensity, vacancy movement, and rent ranges to translate space behavior into value outcomes.
Key inputs that shaped the model include office take-up levels, vacancy rates by submarket quality, prime rent levels, prime yield direction, and the pace of new supply and refurbishments. These variables drive whether value is being driven by occupied space growth, rent resets, or cap-rate changes, which are not the same dynamic. To keep totals grounded, we corroborate results with selective bottom-up approximations such as sampled rent roll checks, typical lease size patterns shared by market participants, and transaction-based sense checks for larger assets. Where direct reads were not available, gaps were handled by using proxy ranges from comparable Spanish cities.
For forecasting, scenario analysis was applied around interest-rate sensitivity, occupier expansion plans, and new supply timing, and then the central path was selected after reconciling it with expert expectations gathered in primary calls. If the model showed unusual jumps, assumptions were re-checked at the input level before the final series was locked.
Data Validation & Update Cycle
Validation is done through repeated variance checks across cities, time periods, and value drivers, so one outlier does not tilt the full Spain total. We compare outputs against independent market signals such as published take-up summaries, rental benchmarks, and investment activity commentary, then review any mismatch back to vacancy, rent, and yield inputs.
Before sign-off, the work goes through multi-step analyst review, and follow-up calls are triggered when new leasing bursts, large conversions, or a visible pricing shift changes the story. Reports are refreshed annually, with interim updates considered when material events occur, and a final pre-delivery pass is completed so clients receive the most current view available.
Mordor Intelligence's Spain Office Real Estate Market Size Versus Other Published Estimates
Published market sizes for Spain offices can look far apart even when people are reading the same headlines, because the dollar figure depends on what is being valued and how it is translated from space metrics to money. We kept the comparison focused on scope boundaries, price logic, and how each publisher treats timing, since those are the usual reasons spreads show up.
Leasing take-up and prime rent benchmarks, supported by vacancy and yield direction checks, are the evidence that ties Mordor Intelligence to a demand-led value build for offices rather than a deal-led total. In the estimates below, the biggest gap drivers are typically whether smaller city stock is included, whether sales-only investment volume is used as a proxy for the whole market, and whether aggressive cap-rate compression or rent step-ups are assumed without re-checking them against current market conditions and currency timing.
Benchmark comparison
| Source | Market Size | Gaps in Research Methodology |
|---|---|---|
| Mordor Intelligence | USD 39.01 B (2025) | |
| Global Consultancy A | USD 1.50 B (2024) | Uses office investment volume as the market value proxy, which captures transacted deals but does not represent the wider standing office stock and leasing-led value in a typical year. |
| Trade Journal B | USD 44.90 B (2024) | Applies broad prime pricing assumptions across markets and mixes in conversion and repositioning values, which can inflate totals when office-only economics are not separated cleanly. |
The table shows that differences mainly come from what is counted, not just from math. When the scope stays office-only, inputs are linked to observable space and pricing signals, and assumptions are refreshed with current city conditions, the result becomes easier to trace and repeat for planning decisions.
Key Questions Answered in the Report
What is the current size of the Spain office real estate market?
The market is valued at USD 40.65 billion in 2026 and is projected to reach USD 49.94 billion by 2031.
Which segment holds the largest share of the Spain office real estate market?
Grade A buildings dominate with 53.60% of total volume thanks to strong demand for ESG-certified, tech-ready space.
Which city is forecast to grow the fastest?
Valencia is expected to post a 5.12% CAGR to 2031 as its logistics hub status and lower operating costs attract technology and back-office functions.
How big is the technology sector’s footprint?
Technology and IT-enabled services account for 32.70% of all office demand and are expanding at a 4.92% CAGR.
What drives investor interest in Spanish offices?
Investors pursue prime, green-certified assets because EU ESG regulations, robust occupancy, and rent premiums support stable cash flows.
How is hybrid working influencing leasing patterns?
Hybrid models reduce aggregate footprints but lift demand for premium, flexible space, reinforcing the rental dominance within the market.