
Commercial Payments Market Size and Share
Market Overview
| Study Period | 2020 - 2031 |
|---|---|
| Market Size (2026) | USD 506.5 Trillion |
| Market Size (2031) | USD 627.27 Trillion |
| Growth Rate (2026 - 2031) | 4.37 % |
| Fastest Growing Market | Middle East and Africa |
| Largest Market | Asia-Pacific |
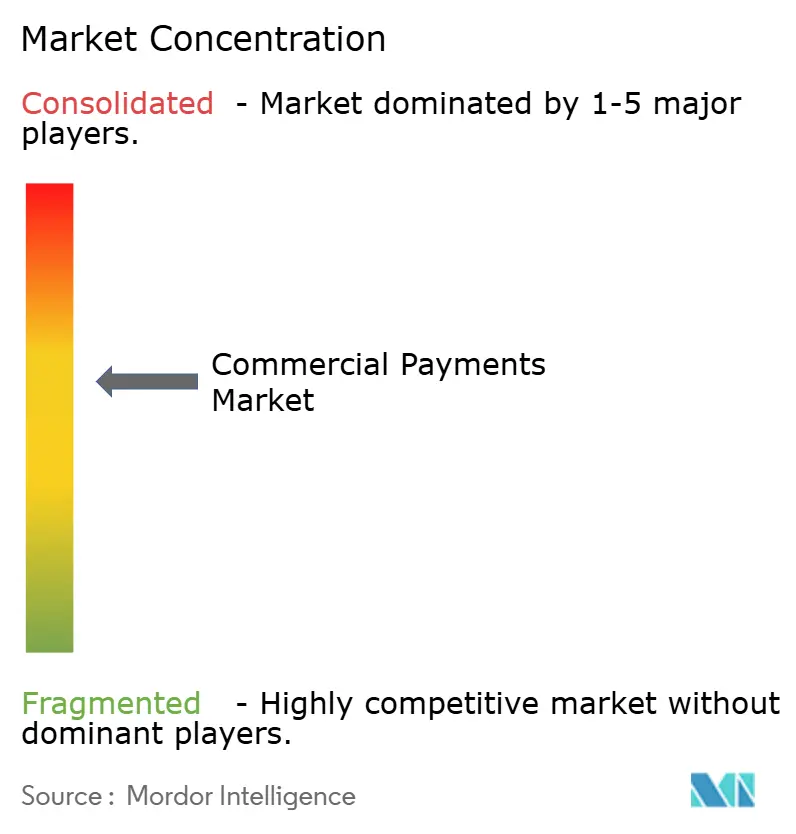
| Market Concentration | Medium |
Major Players *Disclaimer: Major Players sorted in no particular order Image © Mordor Intelligence. Reuse requires attribution under CC BY 4.0. | |
Commercial Payments Market Analysis by Mordor Intelligence
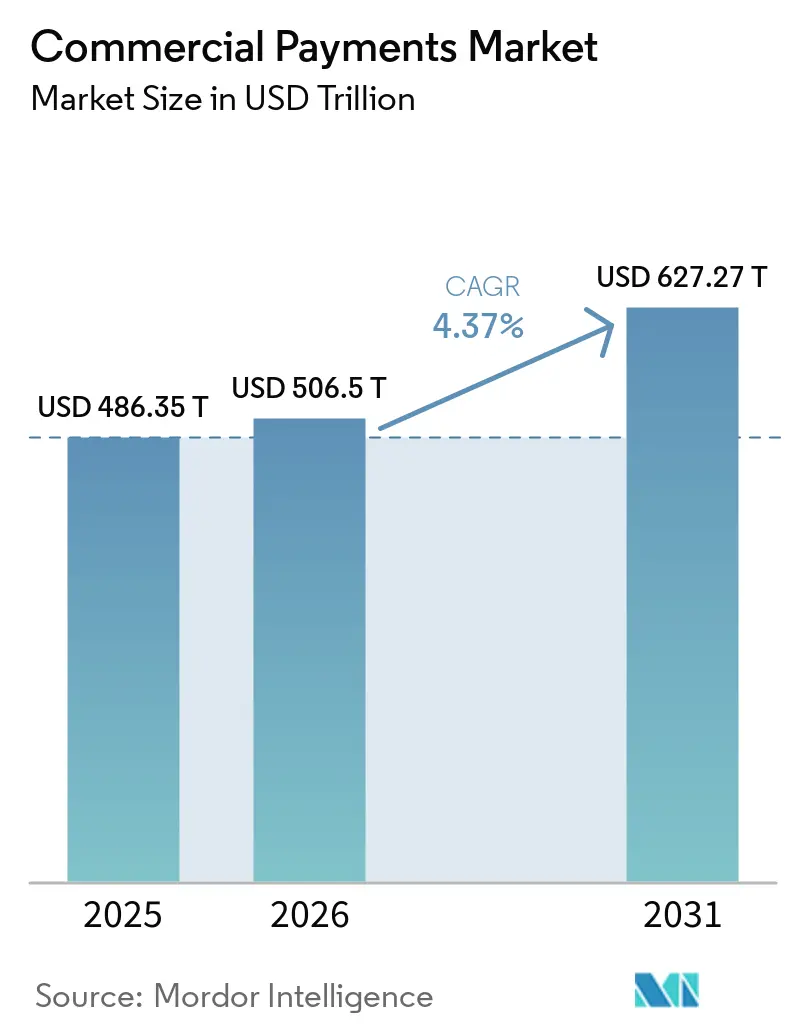
The Commercial Payments Market size is projected to expand from USD 486.35 trillion in 2025 and USD 506.5 trillion in 2026 to USD 627.27 trillion by 2031, registering a CAGR of 4.37% between 2026 and 2031.
The commercial payments market remains very large, but manual workflows, fragmented banking relationships, and legacy message formats continue to add processing costs. ERP-linked payment integration, embedded procurement workflows, and ISO 20022 data requirements are changing how corporate buyers initiate, trace, and reconcile transactions. Providers are placing greater emphasis on invoice matching, reconciliation, and working-capital tools around core payment rails. The commercial payments market is also becoming more competitive as bank-owned platforms and specialist fintech providers invest in embedded accounts payable automation. Firms with direct software integrations and structured-data capabilities are better placed to serve complex enterprise requirements.
Key Report Takeaways
- By payment type, domestic payments captured 72.16% of the commercial payments market share in 2025, while cross-border payments are projected to grow at a 6.21% CAGR through 2031.
- By payment method, bank transfers captured 79.45% of the commercial payments market share in 2025, while cards are projected to grow at a 9.34% CAGR through 2031.
- By enterprise size, large enterprises captured 67.88% of the commercial payments market share in 2025, while SMEs are projected to grow at a 5.96% CAGR through 2031.
- By industry vertical, manufacturing captured 21.05% of the share of the commercial payments market in 2025, while IT and Telecom is projected to grow at a 7.09% CAGR through 2031.
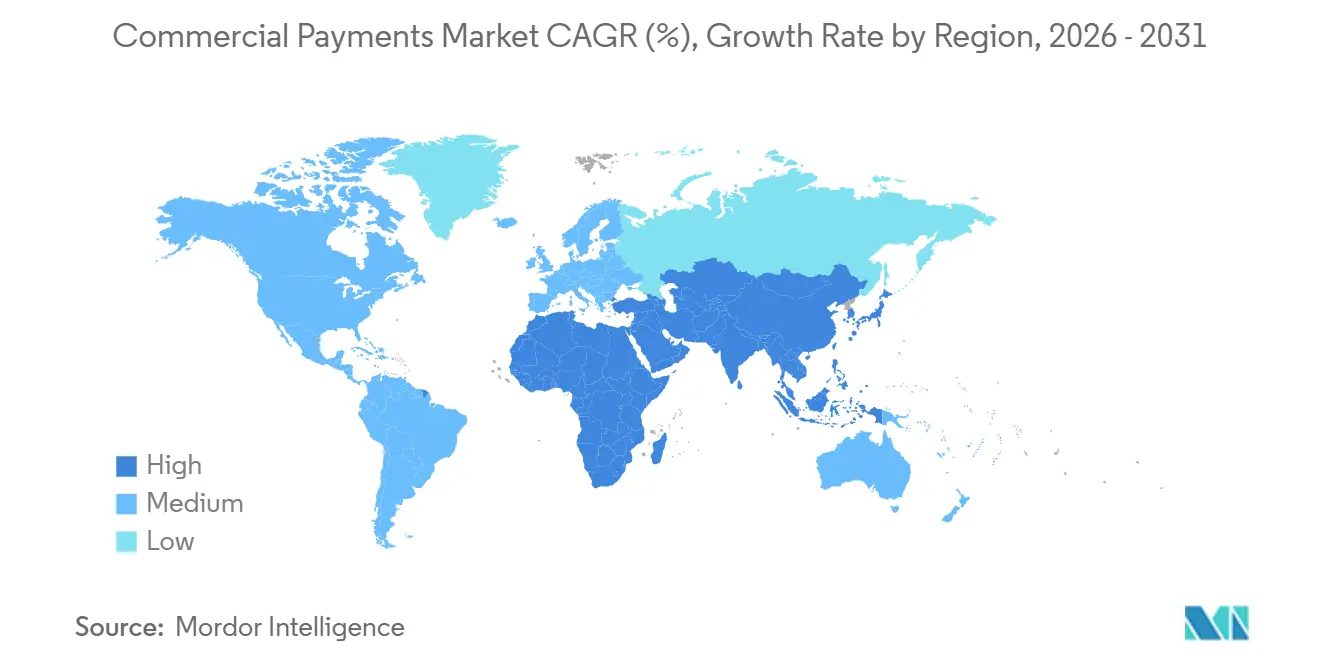
- By geography, Asia-Pacific held 48.75% of the commercial payments market share in 2025, while the Middle East and Africa are projected to grow at a 6.86% CAGR through 2031.
Note: Market size and forecast figures in this report are generated using Mordor Intelligence’s proprietary estimation framework, updated with the latest available data and insights as of January 2026.
Market Trends and Insights
Drivers Impact Analysis of Commercial Payments Market*
| Drivers | (~) % Impact on CAGR Forecast | Geographic Relevance | Impact Timeline |
|---|---|---|---|
| Virtual Cards and Dynamic Spend Controls | +1.1% | Global, concentrated in North America, Europe, and Australia | Medium term (2-4 years) |
| ERP and Accounts Payable Automation Integration | +0.9% | Global, with early gains in North America and Western Europe | Medium term (2-4 years) |
| Faster and Traceable Cross-Border B2B Settlement | +0.8% | Asia-Pacific, North America, and Europe, with spillover to the Middle East and Africa | Short term (≤ 2 years) |
| Straight-Through Processing and Digital Remittance Reconciliation | +0.5% | North America and the European Union, emerging in Asia-Pacific | Medium term (2-4 years) |
| Embedded Workflows in Procurement and Expense Platforms | +0.5% | Global, led by the North American mid-market | Medium term (2-4 years) |
| ISO 20022 and Rich Remittance Data Adoption | +0.7% | Global, centered on SWIFT CBPR+ corridors | Short term (≤ 2 years) |
| Source: Mordor Intelligence | |||
Rising Demand for Virtual Cards and Dynamic Spend Controls
Virtual cards are becoming more relevant to corporate payment programs as companies seek greater control over individual transactions. Commercial cards accounted for less than 3% of global B2B payment value, but spending surpassed USD 4.3 trillion in 2024 and is projected to exceed USD 6 trillion by 2029[1]Mastercard, “J.P. Morgan Payments Brings Its B2B Virtual Card Offering to Europe in Collaboration With Mastercard,” Mastercard Newsroom Europe, mastercard.com. The gap between card penetration and spending shows that adoption remains concentrated among large enterprises and procurement platforms. Single-use card numbers and vendor-level limits can reduce reconciliation uncertainty and may generate rebate income that offsets program costs. Mastercard expanded embedded virtual card number capabilities across SAP Concur, SAP Taulia, and expense platforms in October 2025, showing that networks are competing through ERP connections as well as card acceptance. J.P. Morgan Payments launched its European B2B virtual card offering with Mastercard in March 2026, extending the model to insurance, healthcare, travel, and commercial real estate users
ERP and Accounts Payable Automation Integration Across Enterprises
ERP-native payment execution is moving accounts payable teams closer to working-capital management. Direct integrations allow payment initiation, approval, and status information to remain within the finance systems used by corporate buyers. Manual invoice processing costs averaged USD 10 per invoice, according to FIS Global, creating a clear cost case for automation. Global Payments embedded vendor payments in Sage Intacct in June 2025, allowing accounts payable teams to initiate and track payments without separate logins. Acumatica and BILL introduced a similar embedded accounts payable integration for United States mid-market ERP users in October 2025[2]Acumatica and BILL, “Acumatica and BILL Team Up to Streamline and Accelerate Payments for Growing Businesses,” Business Wire, businesswire.com. In the commercial payments market, competition is increasingly taking place in ERP application marketplaces rather than traditional banking channels.
Cross-Border B2B Commerce Requiring Faster and More Traceable Settlement
Cross-border settlement remains slower and more complex than domestic corporate payment processing. The Financial Stability Board’s G20 roadmap targets transaction costs below 1% for retail payments and below 0.3% for wholesale payments by 2027. The World Bank reported that the share of European Union-Western Balkans B2B transfers settling within 24 hours rose from 6% in 2024 to 63% in 2025 after SEPA integration in Albania, Montenegro, and North Macedonia[3]World Bank, “WB6 Report on B2B Cross-Border Payment Costs, 2nd Edition,” Payments for Development Report, worldbank.org. This development shows the operational value of interoperable payment infrastructure for business users. Real-time payment interlinking and stablecoin settlement options are increasing the number of rails available for cross-border commercial flows. The commercial payments market is therefore likely to place greater value on providers that combine settlement speed with remittance data, compliance support, and straightforward reconciliation.
ISO 20022 and Rich Remittance Data Adoption Improving Reconciliation Efficiency
ISO 20022 migration has entered a period in which corporate readiness has direct operational importance. SWIFT has set November 2026 as the deadline for structured postal addresses in CBPR+ cross-border payment messages, and it stated that noncompliant transactions may be rejected. SWIFT also reported that 65% of payment messages still contained unstructured addresses in mid-2026. ISO 20022-ready systems can support more consistent payment information, lower manual handling, and improved reconciliation. TIS Payments announced in June 2026 that MT101 payment initiation messages will be retired, potentially increasing rejection and exception risks for companies that are not prepared[4]TIS Payments, “ISO 20022 Corporate Readiness, A Call to Action,” TIS Newsroom, tispayments.com. The commercial payments market will favor platforms that treat structured data as a core operating capability rather than a narrow compliance requirement.
Restraints Impact Analysis of Commercial Payments Market*
| Restraint | (~) % Impact on CAGR Forecast | Geographic Relevance | Impact Timeline |
|---|---|---|---|
| Fragmented Legacy Banking Rails | -0.7% | Global, most acute in North America and Europe’s mid-market tier | Long term (≥ 4 years) |
| Commercial Card Acceptance in High-Fee Categories | -0.5% | Global, most pronounced in manufacturing and healthcare B2B | Medium term (2-4 years) |
| Corporate Security and Approval Complexity | -0.4% | Global, particularly among large enterprises with multi-entity approval chains | Medium term (2-4 years) |
| Cross-Border Compliance and Tax Documentation Differences | -0.4% | Asia-Pacific emerging markets, the Middle East and Africa, and South America | Long term (≥ 4 years) |
| Source: Mordor Intelligence | |||
Fragmented Legacy Banking Rails Slow Multi-System Commercial Payment Orchestration
Legacy payment infrastructure remains a persistent limitation because it was not designed for the needs of modern multi-entity enterprises. Many businesses face friction in international payments, including settlement windows of 2-5 days, unclear foreign exchange charges, and fragmented banking data. Enterprises with many banking relationships can face incompatibility between ERP payment modules and bank application programming interfaces. This fragmentation supports demand for middleware and payment orchestration platforms, but it can also reduce straight-through processing rates. Replacing core banking connections is difficult because companies often operate under multiyear banking contracts and internal technology priorities. These conditions can lengthen the sales cycle for commercial payment infrastructure providers.
Merchant Acceptance Friction for Commercial Cards in High-Fee Categories
Supplier resistance to commercial cards continues to limit the growth of card-based B2B payments in high-value categories. Commercial cards accounted for less than 3% of global B2B payment value, indicating that acceptance limits remain material in supplier relationships. Healthcare, commercial real estate, and high-volume manufacturing are affected because invoices can exceed USD 100,000, and interchange expenses can reduce supplier margins. Visa expanded its Commercial Solutions Hub in May 2026 by adding an Accounts Receivable Manager across 69 geographies to support supplier-side virtual card processing. Supplier enablement tools may take time to reach less digitized businesses across manufacturing and healthcare supply chains. Until acceptance is broader, buyers may be unable to extend card-based payable programs across their full supplier base.
*Our forecasts treat driver/restraint impacts as directional, not additive. The impact forecasts reflect baseline growth, mix effects, and variable interactions.
Commercial Payments Market Segment Analysis
By Payment Type:
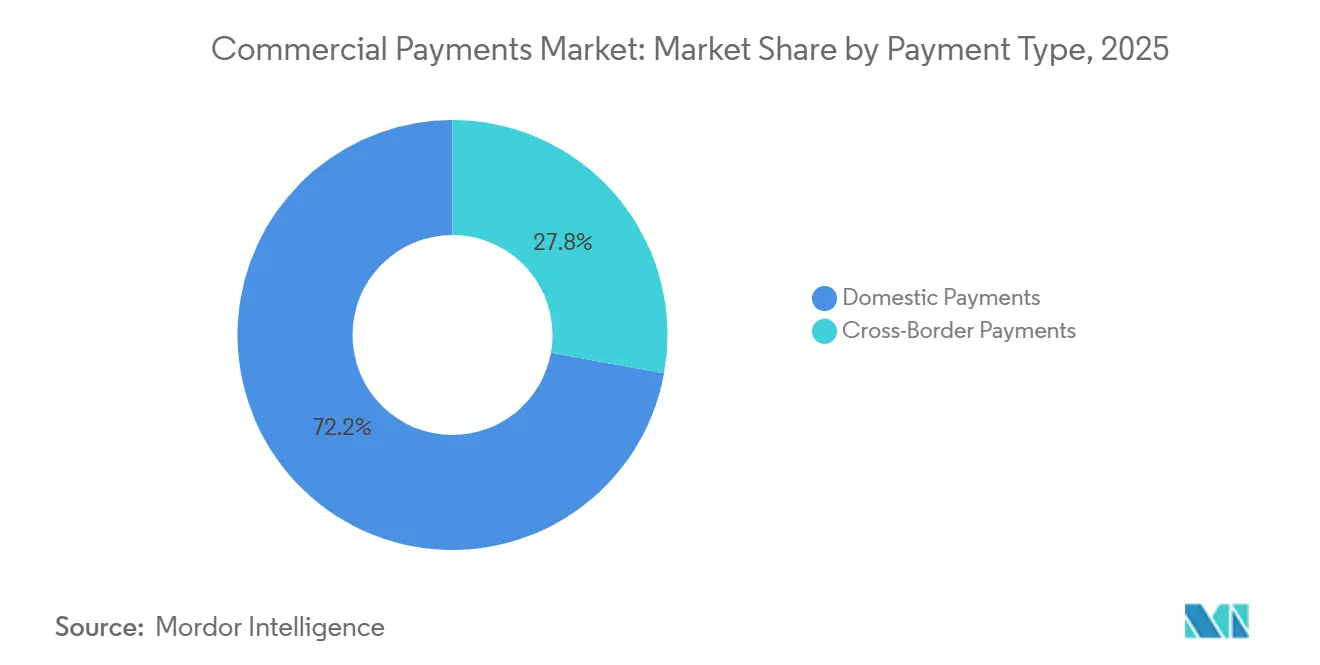
Domestic Volumes Underpin Scale, Cross-Border Shapes ValueDomestic payments accounted for 72.16% of the commercial payments market share in 2025. This leading position reflects recurring intercompany transfers, supplier disbursements, and payroll funding that settle through national payment rails. Cross-border payments are projected to expand at a 6.21% CAGR through 2031. International flows can create greater revenue potential because foreign exchange, payment data, and compliance services are associated with these transactions. Nacha reported that United States B2B ACH payments reached 7.35 billion transactions and USD 58.24 trillion in value in 2024.
The commercial payments market size for cross-border payments is expected to benefit from multinational supply-chain expansion and growing intra-Asia-Pacific trade. Cross-border users need reliable payment tracking because settlement, currency conversion, and documentation can involve multiple parties. Domestic payments will continue to support most transaction volume because they rely on established national infrastructure. Providers are responding by developing workflows that support invoice matching, remittance information, and working-capital visibility. McKinsey identified growing investment in cross-border reconciliation, invoice automation, and working-capital tools in 2025, which signals the importance of higher-value international payment workflows.


By Payment Method:
Bank Transfers Lead, Cards Advance Through DigitizationBank transfers accounted for 79.45% of the commercial payments market share in 2025. Their position is supported by long-standing treasury integration and the high values involved in many B2B payments. Cards are projected to record a 9.34% CAGR through 2031. The growth is primarily linked to virtual cards used within accounts payable workflows rather than physical card issuance. The Association for Financial Professionals reported that checks represented 26% of B2B payment volume in 2025, down from 33% in 2022.
The commercial payments market size for card-based methods is supported by spend-control features, rebate structures, and better data capture. Bank transfers will remain important because they can efficiently handle high-value transfers and are deeply embedded in corporate treasury systems. Other digital methods, including real-time payments and account-to-account transfers, are gaining greater relevance as FedNow, UPI, and Pix expand into B2B use cases. The choice of rail is increasingly based on payment corridor, supplier preference, and settlement urgency. The Association for Financial Professionals also reported that 76% of organizations planned to update their payment strategies within 3 years, indicating a continuing shift away from paper-centered processes.
By Enterprise Size:
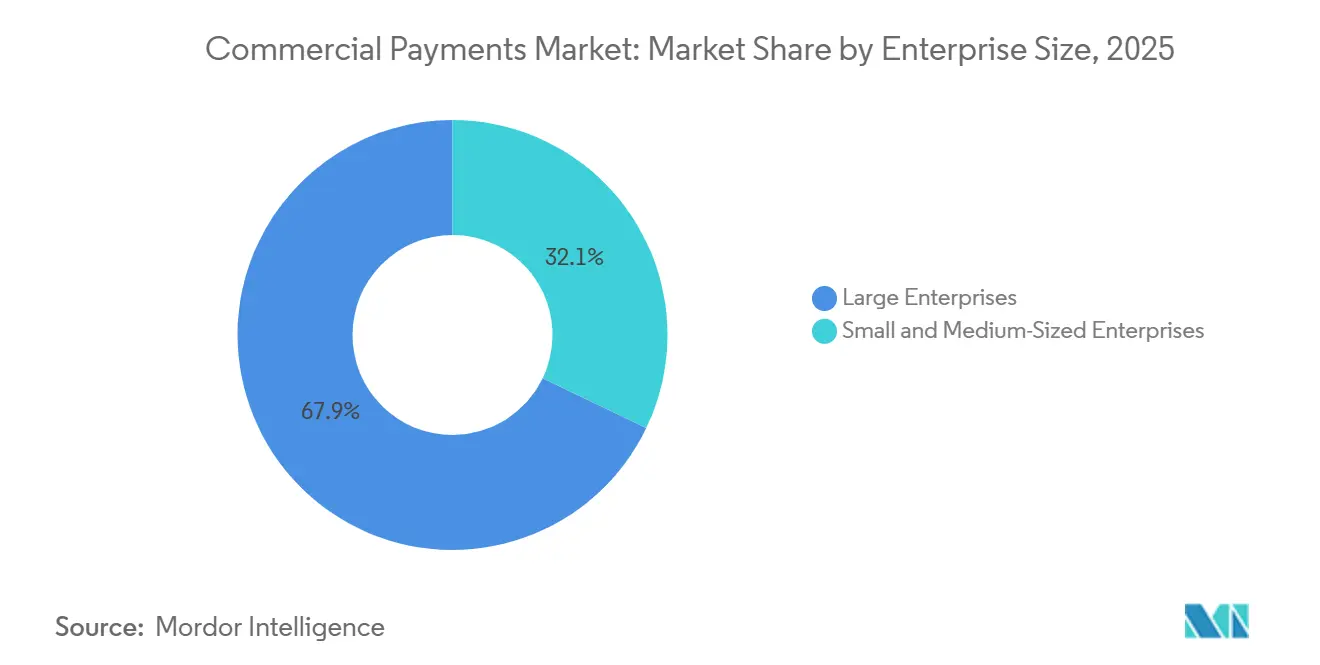
Large Enterprises Anchor Value, SMEs Drive GrowthLarge enterprises accounted for 67.88% of the commercial payments market share in 2025. Their share reflects established banking relationships, existing ERP systems, and dedicated treasury teams. SMEs are forecast to grow at a 5.96% CAGR from 2026 to 2031. Cloud accounting platforms and embedded payment interfaces are reducing the integration burden that previously limited advanced payment capabilities for smaller businesses. SMEs face cross-border payment costs of 5% or more of transaction value, compared with 1-3% for large corporations.
The commercial payments market has a clear route to SME adoption through accounting software and ERP marketplaces. This distribution model differs from conventional commercial bank onboarding and favors software-led providers. Smaller firms need payment tools that can connect to their existing finance systems without extensive technology projects. Accounts payable automation is especially relevant because manual invoice processing incurs direct operational costs. FIS Global estimated that manual processing costs USD 10 per invoice.
By Industry Vertical:
Manufacturing Leads Volume, IT and Telecom Grows FastestManufacturing accounted for 21.05% of the commercial payments market share in 2025. High invoice frequency and extended supplier networks support this position. IT and Telecom is projected to grow at a 7.09% CAGR through 2031. Subscription billing, multicurrency software licensing, and programmatic payment needs support digital adoption in this vertical. Manufacturing users require reliable integration between supplier records, receipt confirmation, invoices, and payments.
The commercial payments industry serves several verticals with different operating needs. BFSI requires precise interbank settlement, while retail and e-commerce need high-throughput card acceptance. Transportation and logistics depend on accurate cross-border freight invoicing and payment tracking. Healthcare and government users can experience slower conversions due to more stringent procurement rules and approval workflows. J.P. Morgan Payments introduced a supply-chain finance solution linked with Oracle Fusion Cloud ERP in July 2025, with FedEx as an early adopter.
Geography Analysis
APAC Commercial Payments Market
Asia-Pacific accounted for 48.75% of the commercial payments market share in 2025 and remained the largest regional contributor. China’s Cross-Border Interbank Payment System exceeded 200 direct participants in 2026 and extended renminbi payment connectivity to more than 100 countries. India’s UPI is linked with Singapore’s PayNow and is being extended through Project Nexus. Japan and South Korea have card-oriented commercial payment ecosystems suited to enterprise B2B activity. ASEAN markets are developing application programming interface interoperability through the ASEAN Payment Connectivity initiative.
North America and Europe Commercial Payments Market
North America and Europe were the second- and third-largest commercial payments geographies. North America benefits from corporate card programs, accounts payable automation, and advanced treasury systems. Full ISO 20022 enforcement on Fedwire and CHIPS by November 2026 affects high-value domestic and cross-border users. The European Instant Payments Regulation required eurozone providers to send and receive instant payments from October 2025.
MEA Commercial Payments Market
The Middle East and Africa commercial payments market size is projected to expand at a 6.86% CAGR from 2026 to 2031. Saudi Arabia reported that electronic payments made up 79% of retail transactions in 2025. GSMA reported that mobile money transactions in the Middle East and North Africa reached USD 62 billion in 2025, up 25% year over year. The UAE’s AANI system and Saudi Arabia’s SARIE platform support B2B payment digitization across the Gulf Cooperation Council. The region is shifting attention from consumer adoption toward enterprise payment workflows.

Competitive Landscape
The commercial payments market has a divided competitive structure. Global card networks and major banks process much of the payment volume and maintain established corporate treasury relationships. Specialist platforms compete through payment data, ERP connectivity, accounts payable automation, and cross-border services. Visa’s Commercial Solutions Hub and Mastercard’s supplier enablement services provide infrastructure that issuing-bank partners can use to reach corporate clients. Mastercard made a USD 300 million equity investment in Corpay’s cross-border business in April 2025 and formed an exclusive financial institution distribution agreement.
Specialist fintech providers are expanding through acquisitions and geographic growth. Corpay completed its USD 2.4 billion acquisition of Alpha Group in November 2025, strengthening its cross-border B2B foreign exchange and bank-account capabilities in Europe. Airwallex secured USD 320 million in Series H funding at a valuation of USD 11 billion in April 2026. The company is expanding from cross-border infrastructure into in-person point-of-sale and global billing services.
Opportunities remain in reconciliation tools for SMEs that manage multiple payment rails. Supplier-side virtual card acceptance is another gap, especially in manufacturing and healthcare supply chains. Emerging corridors in the Middle East, Africa, and Asia-Pacific provide room for digital platforms where correspondent banking remains important. ISO 20022 readiness can reduce exceptions and manual translation. The commercial payments market will favor platforms that provide direct workflow support and reliable data handling.
Commercial Payments Industry Leaders
Visa Inc.
Mastercard Inc.
American Express Company
J.P. Morgan
Fiserv, Inc.
- *Disclaimer: Major Players sorted in no particular order
Commercial Payments Market Companies Covered in this Report
- Visa Inc.
- Mastercard Incorporated
- American Express Company
- J.P. Morgan
- Citigroup Inc.
- Bank of America Corporation
- U.S. Bancorp
- Wells Fargo and Company
- Barclays PLC
- Fiserv, Inc.
- FIS
- PayPal Holdings, Inc.
- Stripe, Inc.
- Adyen N.V.
- Airwallex
- Brex Inc.
- Corpay, Inc.
- WEX Inc.
- Coupa Software Incorporated
- Edenred SE

Recent Industry Developments in Commercial Payments Market
- June 2026: Airwallex secured USD 320 million in Series H funding at a valuation of USD 11 billion. The company reported annualized revenue of USD 1.3 billion, up 74% year over year. It also reported USD 287 billion in annualized transaction volume, up 120%. More than 90% of its revenue came from multiproduct customers. The update indicated strong platform adoption depth.
- May 2026: Visa expanded its Commercial Solutions Hub by integrating Visa Accounts Receivable Manager across 69 geographies. The capability allows issuers to send virtual card payments directly to suppliers through an end-to-end processing function. The feature is expected to launch in September 2026 at no additional cost to eligible Commercial Solutions Hub clients. It is intended to reduce friction in supplier onboarding. The announcement supports Visa’s supplier enablement strategy.
- March 2026: J.P. Morgan Payments and Mastercard launched a full-scope B2B virtual card offering in Europe. The offering uses Mastercard’s B2B Supplier Enablement and Activation Service to automate accounts payable reconciliation. It is directed at the insurance, healthcare, travel, and commercial real estate sectors. The launch builds on J.P. Morgan’s position as the largest virtual card issuer in North America. It extends the partners’ commercial card presence in Europe.
- March 2026: American Express launched the Graphite Business Cash Unlimited Card. The company also announced 8 new or enhanced commercial products in 2026. These include a Corporate Cash Back Card and artificial intelligence-enabled expense management software built on Center-acquired technology. The program also includes artificial intelligence agent capabilities for payment analysis and automated expense reporting. The release described this as the company’s largest commercial product expansion to date.


Global Commercial Payments Market Report Scope
| Domestic Payments |
| Cross-Border Payments |
| Cards |
| Bank Transfers |
| Cheques and Other Paper-based Instruments |
| Other Digital Methods |
| Large Enterprises |
| Small and Medium-Sized Enterprises |
| BFSI |
| IT and Telecom |
| Manufacturing |
| Retail and E-Commerce |
| Transportation and Logistics |
| Energy and Utilities |
| Healthcare |
| Government and Public Sector |
| Other Industry Verticals |
| North America | United States |
| Canada | |
| Mexico | |
| South America | Brazil |
| Argentina | |
| Rest of South America | |
| Europe | United Kingdom |
| Germany | |
| France | |
| Italy | |
| Spain | |
| Rest of Europe | |
| Asia-Pacific | China |
| Japan | |
| India | |
| South Korea | |
| Australia | |
| Indonesia | |
| Thailand | |
| Malaysia | |
| Singapore | |
| Vietnam | |
| Rest of Asia-Pacific | |
| Middle East and Africa | Saudi Arabia |
| United Arab Emirates | |
| Turkey | |
| South Africa | |
| Egypt | |
| Rest of Middle East and Africa |
| By Payment Type | Domestic Payments | |
| Cross-Border Payments | ||
| By Payment Method | Cards | |
| Bank Transfers | ||
| Cheques and Other Paper-based Instruments | ||
| Other Digital Methods | ||
| By Enterprise Size | Large Enterprises | |
| Small and Medium-Sized Enterprises | ||
| By Industry Vertical | BFSI | |
| IT and Telecom | ||
| Manufacturing | ||
| Retail and E-Commerce | ||
| Transportation and Logistics | ||
| Energy and Utilities | ||
| Healthcare | ||
| Government and Public Sector | ||
| Other Industry Verticals | ||
| By Geography | North America | United States |
| Canada | ||
| Mexico | ||
| South America | Brazil | |
| Argentina | ||
| Rest of South America | ||
| Europe | United Kingdom | |
| Germany | ||
| France | ||
| Italy | ||
| Spain | ||
| Rest of Europe | ||
| Asia-Pacific | China | |
| Japan | ||
| India | ||
| South Korea | ||
| Australia | ||
| Indonesia | ||
| Thailand | ||
| Malaysia | ||
| Singapore | ||
| Vietnam | ||
| Rest of Asia-Pacific | ||
| Middle East and Africa | Saudi Arabia | |
| United Arab Emirates | ||
| Turkey | ||
| South Africa | ||
| Egypt | ||
| Rest of Middle East and Africa | ||


Key Questions Answered in the Report
What is the forecast for commercial payments through 2031?
The commercial payments market is projected to reach USD 627.27 trillion by 2031, growing at a 4.37% CAGR from 2026, with domestic and cross-border transaction needs shaping demand throughout the forecast period.
Which payment type holds the largest share?
Domestic payments led with 72.16% share in 2025, while cross-border payments are forecast to grow at a 6.21% CAGR through 2031.
Which payment method is expanding fastest?
Cards are forecast to grow at a 9.34% CAGR between 2026 and 2031, supported by virtual-card adoption in accounts payable workflows.
Why are virtual cards important for corporate payments?
They provide transaction-level controls and can support clearer reconciliation, while commercial card spending surpassed USD 4.3 trillion in 2024.
Which region is growing fastest?
The Middle East and Africa is forecast to expand at a 6.86% CAGR from 2026 to 2031, supported by digital payment infrastructure and trade finance activity.
How does ISO 20022 affect business payment operations?
SWIFT’s November 2026 structured-address deadline raises the risk of rejected cross-border payment messages for organizations that are not prepared.
Page last updated on:





