
Commercial Loans Market Size and Share
Market Overview
| Study Period | 2020 - 2031 |
|---|---|
| Market Size (2026) | USD 66.5 Trillion |
| Market Size (2031) | USD 83.30 Trillion |
| Growth Rate (2026 - 2031) | 4.60 % |
| Fastest Growing Market | Middle East and Africa |
| Largest Market | Asia-Pacific |
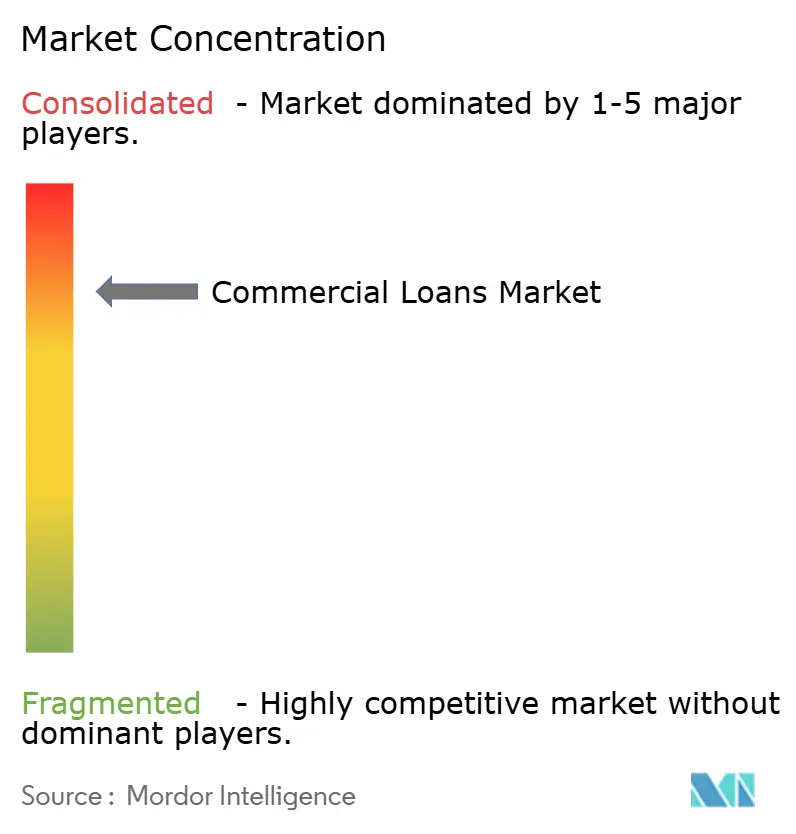
| Market Concentration | High |
Major Players *Disclaimer: Major Players sorted in no particular order Image © Mordor Intelligence. Reuse requires attribution under CC BY 4.0. | |
Commercial Loans Market Analysis by Mordor Intelligence
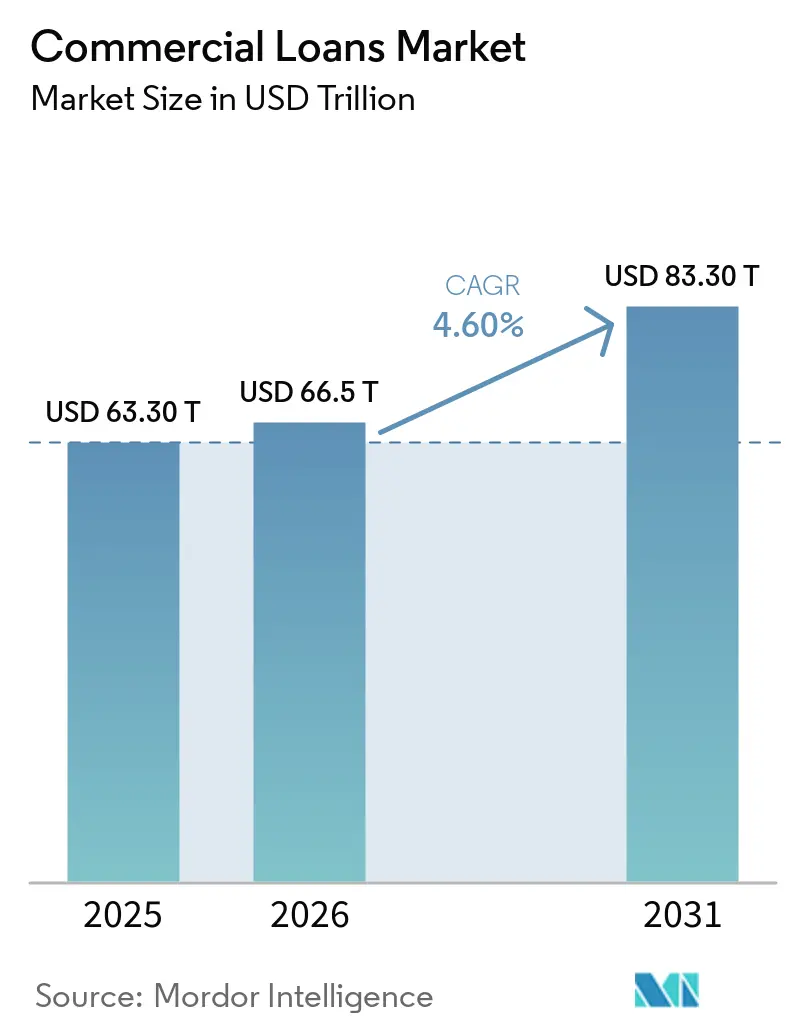
The commercial loans market size was valued at USD 63.30 trillion in 2025 and is estimated to grow from USD 66.5 trillion in 2026 to USD 83.30 trillion by 2031, registering a CAGR of 4.60% from 2026 to 2031. Demand is supported by working-capital needs among small and medium-sized enterprises and mid-sized corporations, along with multiyear spending on infrastructure and energy projects. Lending demand is also becoming more broad-based, as the Federal Reserve reported positive loan-demand readings across commercial bank size groups in the first quarter of 2026. Commercial bank loans increased 5.4% in 2025, while commercial and industrial portfolios grew 4.3%, which supports continued activity in the commercial loans market. Digital origination systems are changing the pace of lending decisions, but they also increase the need for clear controls around model use and credit approvals. Higher debt-service costs and stress in commercial real estate remain important constraints, especially where borrowers need to refinance at current interest rates.
Key Report Takeaways
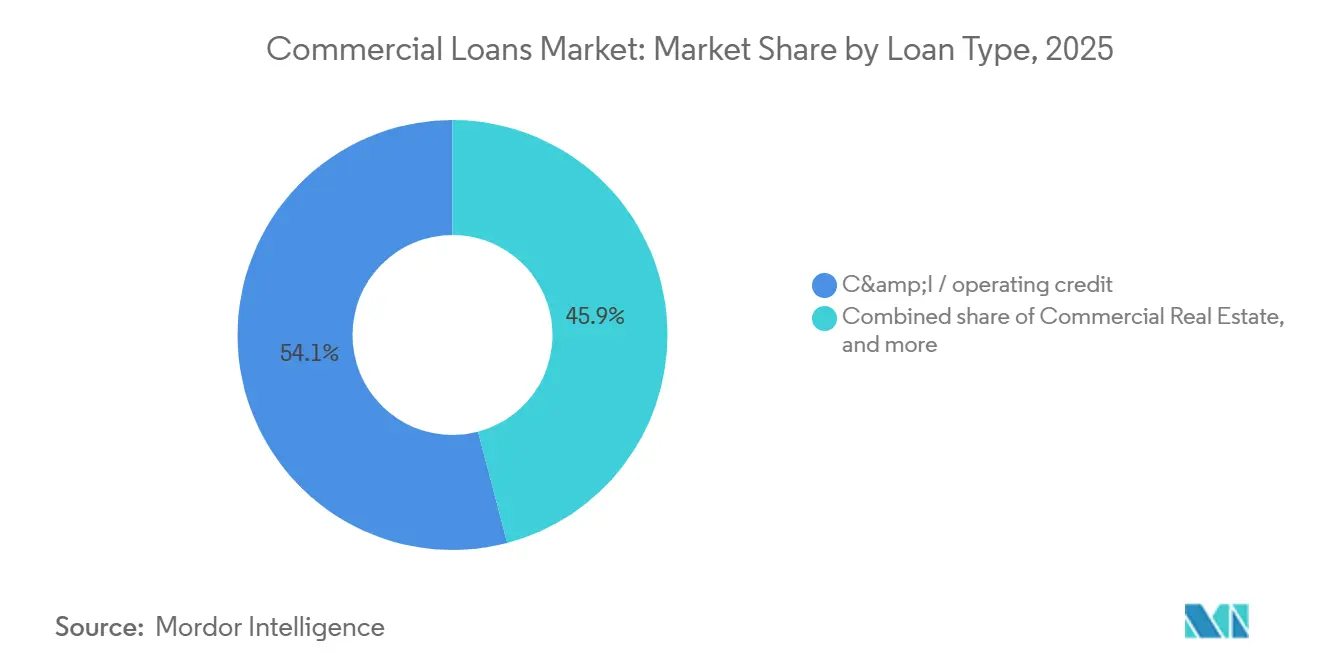
- By loan type, commercial and industrial and operating credit captured 54.1% of the commercial loans market share in 2025, while equipment finance and leases are projected to grow at a 5.8% CAGR through 2031.
- By borrower size, large enterprises held 62.3% of the commercial loans market share in 2025, while small and medium-sized enterprises are projected to grow at a 5.4% CAGR through 2031.
- By end-user industry, construction and real estate accounted for 27.8% of the commercial loans market size in 2025, while information technology and telecommunications are projected to grow at a 6.4% CAGR through 2031.
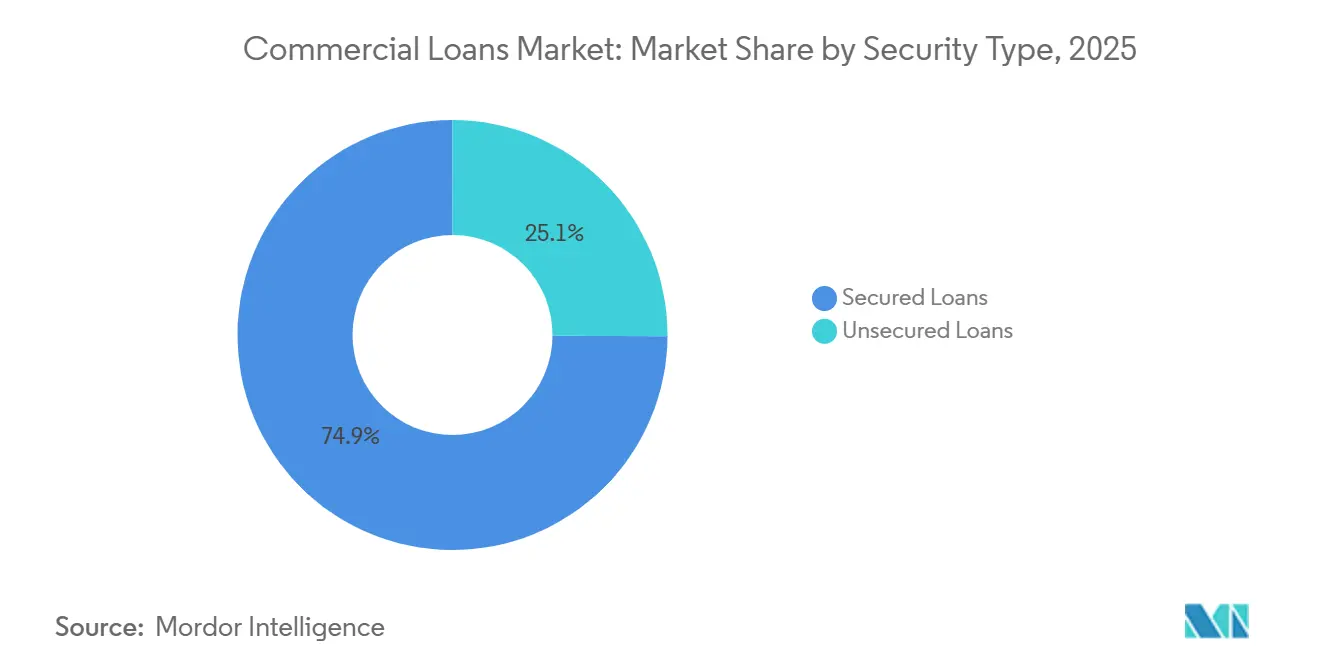
- By security type, secured loans held 74.9% of the commercial loans market size in 2025, while unsecured facilities are projected to grow at a 5.2% CAGR through 2031.
- By lender type, banks held 77.6% of commercial lending balances in 2025, while other lenders are projected to grow at a 7% CAGR through 2031.
- By geography, Asia-Pacific held 51.2% of the commercial loans market size in 2025, while the Middle East and Africa is projected to grow at a 6.1% CAGR through 2031.
Note: Market size and forecast figures in this report are generated using Mordor Intelligence’s proprietary estimation framework, updated with the latest available data and insights as of January 2026.
Global Commercial Loans Market Trends and Insights
Drivers Impact Analysis*
| Driver | (~) % Impact on CAGR Forecast | Geographic Relevance | Impact Timeline |
|---|---|---|---|
| Growing SME and Corporate Working-Capital Requirements | +1.2% | Global, concentrated in Asia-Pacific, North America, and Europe | Short term (≤ 2 years) |
| Rising Infrastructure, Industrial, and Energy-Transition Capital Expenditure | +0.9% | Global, with the highest intensity in Asia-Pacific and North America | Long term (≥ 4 years) |
| Digital Loan Origination and Automated Credit Underwriting | +0.7% | North America and Europe are early adopters, and Asia-Pacific is scaling rapidly | Medium term (2-4 years) |
| Expansion of Alternative Lending Channels and Non-Bank Credit Providers | +0.6% | North America, Australia, and Southeast Asia | Short term (≤ 2 years) |
| Increasing Use of Cashflow and Transaction Data in Commercial Lending | +0.4% | North America and the European Union, with spillover to the Asia-Pacific | Medium term (2-4 years) |
| Growing Trade, Supply-Chain and Cross-Border Financing Requirements | +0.4% | Asia-Pacific, the Middle East and Africa, and South America | Medium term (2-4 years) |
| Source: Mordor Intelligence | |||
Growing SME and Corporate Working-Capital Requirements
Working-capital lending remains a broad source of demand for the commercial loans market because businesses need funding for inventory, payroll, receivables, and seasonal purchases. Small and medium-sized enterprises often need these facilities more frequently because their collection cycles can be longer and their inventories can represent a larger share of operating assets. The Federal Reserve found that 38% of employer firms applied for a loan, line of credit, or merchant cash advance during the prior 12 months. Approval rates rose at both small and large banks, while the share of firms seeking credit remained broadly unchanged from 2024. The OECD reported increases in small and medium-sized enterprise loan flows in several member economies, including a 61% increase in Chile[1]Organisation for Economic Co-operation and Development, “Recent Trends in SME and Entrepreneurship Finance,” Financing SMEs and Entrepreneurs 2026, oecd.org.. These conditions support steady demand across the commercial loans market while lenders continue to focus on borrower repayment capacity.
Rising Infrastructure, Industrial and Energy-Transition Capital Expenditure
Infrastructure, industrial expansion, and energy-transition investment are increasing the need for long-dated project loans, equipment finance, and construction facilities. The International Energy Agency projects global energy-sector investment of USD 3.4 trillion in 2026, 5% higher than in 2025[2]: International Energy Agency, “World Energy Investment 2026,” International Energy Agency, iea.org.. It expects USD 2.2 trillion to be directed to renewables, grids, nuclear power, storage, efficiency, and related assets. These projects require credit through multiple stages, including construction, equipment acquisition, and working-capital management after operations begin. Energy and data-center projects can also compete for senior construction debt, which may influence pricing and lender selection. This driver expands opportunities in the commercial loans market, although lenders must assess project concentration and construction risk.
Digital Loan Origination and Automated Credit Underwriting
Digital origination and automated underwriting are reducing manual work in commercial lending and changing how lenders compete for standardized borrowers. Celtic Bank selected Casca in April 2026 to support its Small Business Administration lending program and reduce origination timelines[3]https://apnews.com/press-release/pr-newswire/casca-selected-by-celtic-bank-to-power-its-sba-lending-program-917a167f6f3ad1f2b42d7d0e68e37316. Faster document collection and financial spreading can improve the borrower experience when lenders retain effective review controls. Automated workflows also allow lenders to process smaller transactions more efficiently, which can improve access for smaller businesses. Regulators continue to examine whether automated credit decisions provide sufficiently clear explanations and maintain appropriate governance. The commercial loans market is therefore likely to reward lenders that combine digital speed with consistent human oversight in final credit decisions.
Expansion of Alternative Lending Channels and Non-Bank Credit Providers
Alternative lenders, private credit funds, non-bank financial institutions, and fintech platforms are expanding the channels available to commercial borrowers. These providers often serve borrowers that fall outside bank underwriting policies, including some small and medium-sized enterprises and sub-investment-grade companies. Federal Reserve data showed that lending to non-bank financial institutions reached USD 1.997 trillion in June 2026. Their ability to use specialized underwriting and flexible loan structures has increased competition for bank lenders. Banks are responding by using deposit-funded balance sheets and established relationship networks to pursue commercial and industrial lending opportunities. This competition broadens funding options in the commercial loans market, while differences in underwriting discipline remain important for loan performance.
Restraints Impact Analysis*
| Restraint | (~) % Impact on CAGR Forecast | Geographic Relevance | Impact Timeline |
|---|---|---|---|
| High Interest Rates and Rising Debt-Service Burden | -0.9% | Global, most acute in North America and Europe | Short term (≤ 2 years) |
| Tighter Credit Underwriting and Collateral Requirements | -0.7% | Global, especially North America and Western Europe | Medium term (2-4 years) |
| Elevated Credit Risk and Deteriorating Asset Quality | -0.7% | North America and Europe, and emerging in the Asia-Pacific | Medium term (2-4 years) |
| Economic Uncertainty and Volatility in Corporate Investment Activity | -0.6% | Global, concentrated in trade-exposed economies | Short term (≤ 2 years) |
| Source: Mordor Intelligence | |||
High Interest Rates and Rising Debt-Service Burden
Higher interest rates continue to limit borrowing capacity for companies that must refinance existing floating-rate facilities. The Mortgage Bankers Association baseline forecast assumes that the 10-year Treasury yield will average 4.2% in 2026 and that there will be only 1 further rate cut. This outlook keeps permanent-loan pricing high even as short-term rates ease. Borrowers who originated facilities in 2021 and 2022 at lower spreads face materially higher all-in costs at refinancing. The Mortgage Bankers Association reported that USD 875 billion in commercial mortgages are scheduled to mature in 2026. This refinancing requirement may limit credit demand in more rate-sensitive parts of the commercial loans market.
Elevated Credit Risk and Deteriorating Asset Quality
Credit conditions are becoming more uneven because stress is concentrated in selected property types and borrower groups. The Mortgage Bankers Association reported a 4.02% commercial mortgage delinquency rate in the first quarter of 2026, compared with 3.86% in the fourth quarter of 2025. Multifamily, office, and health care properties showed the strongest short-term deterioration. The Federal Reserve supervisory stress test projects an 8.8% loss rate on domestic commercial real estate loans between the first quarter of 2026 and the first quarter of 2028, equal to USD 76.5 billion in losses. Lenders are likely to maintain tighter monitoring of collateral quality, cash flow, and refinancing plans. This restraint may slow activity in the commercial loans market for borrowers with weaker debt-service coverage.
*Our forecasts treat driver/restraint impacts as directional, not additive. The impact forecasts reflect baseline growth, mix effects, and variable interactions.
Segment Analysis
By Loan Type: Commercial and Industrial Credit Retains the Largest Position
Commercial and industrial and operating credit held 54.1% of the commercial loans market size in 2025. These facilities include revolving credit lines, short-term operating lines, asset-based loans, and syndicated corporate loans. They remain important because companies use them to fund daily working-capital requirements and manage cash flow across invoice cycles. Their revolving structure makes them useful for both mid-sized businesses and large corporations with recurring liquidity needs. Commercial banks reported continued commercial and industrial portfolio growth in 2025, with this category increasing 4.3%. The segment’s scale reflects the established role of relationship banking and treasury services in commercial credit decisions.
Equipment finance and leases are projected to grow at a 5.8% CAGR from 2026 to 2031 in the commercial loans market. The Equipment Leasing and Finance Association forecasts total United States equipment deal volume of USD 129 billion in 2026. Its June 2026 reading showed new business volume rising 17.2% year over year. Investment in equipment and software is also expected to increase 6.2% in 2026, supported by spending on artificial intelligence infrastructure and fleet replacement. Commercial real estate, trade finance, supply-chain finance, and other loan types account for the balance of demand. The commercial loans industry benefits when equipment lending converts capital spending into scheduled repayment streams.


By Borrower Size: Large Enterprises Hold the Largest Lending Base
Large enterprises accounted for 62.3% of the commercial loans market size in 2025. Banks favor these borrowers because they generally have audited financial statements, established banking relationships, and more consistent covenant reporting. The Federal Reserve reported that credit approval rates increased at both small and large banks in its 2026 employer-firm survey. Large enterprise facilities often combine term loans, revolving credit, cash-management services, and hedging arrangements. These broader relationships support a significant share of commercial lending balances. Their scale also allows lenders to structure larger syndicated and bilateral facilities.
Small and medium-sized enterprises are projected to grow at a 5.4% CAGR from 2026 to 2031 in the commercial loans market. United Kingdom, gross small and medium-sized enterprise bank lending rose 9% to GBP 68 billion (USD 87 billion) in 2025. The United Kingdom Finance recorded a 16% increase in gross small and medium-sized enterprise lending in the first quarter of 2026. Credit demand in this group centers on working capital, business expansion, inventory, and equipment purchases. Government-backed programs and community lending requirements support the availability of credit in underserved locations. The commercial loans market size for small and medium-sized enterprises is expanding as lenders improve delivery models and reach more qualified borrowers.
By End-User Industry: Construction and Real Estate Leads Outstanding Balances
Construction and real estate accounted for 27.8% of the commercial loans market size in 2025. The sector requires substantial financing because property development needs land acquisition, construction funding, bridge loans, and long-term mortgages. The Mortgage Bankers Association expects commercial mortgage originations to increase 27% to USD 805.5 billion in 2026. Refinancing activity is expected to support this origination volume as loans mature. The Federal Reserve reported differences in commercial real estate lending standards by bank size during the first quarter of 2026. This creates different borrowing conditions across construction, multifamily, and nonfarm nonresidential properties.
Information technology and telecommunications are projected to grow at a 6.4% CAGR from 2026 to 2031 in the commercial loans market. Demand is being supported by investment in data centers, fifth-generation mobile networks, and fiber infrastructure. Turkcell secured a USD 1 billion syndicated Murabaha facility in March 2026 to fund fifth-generation and next-generation communications infrastructure. Telecom businesses require financing for network construction, upgrades, spectrum-related investments, and operating assets. Manufacturing, health care, energy, financial services, agriculture, and transportation complete the end-user base. The commercial loans market is gaining additional exposure to technology-related capital expenditure as these assets move from equity-heavy funding toward credit facilities.
By Security Type: Secured Lending Remains the Core Structure
Secured loans held 74.9% of outstanding commercial balances in 2025. Collateral remains important because it provides lenders with an identifiable claim on property, equipment, inventory, or other pledged assets. Secured structures also align with bank risk-management practices and regulatory capital requirements. The Federal Reserve, Office of the Comptroller of the Currency, and Federal Deposit Insurance Corporation re-proposed capital requirements for large banks in March 2026.
Unsecured facilities are projected to grow at a 5.2% CAGR from 2026 to 2031. Lenders are increasingly using cash-flow data, payment records, and transaction information to assess borrowers that may not offer substantial hard collateral. This approach can support working-capital facilities for businesses with recurring revenue and stable operating performance. It can also broaden access for small companies that have limited fixed assets. The approach requires disciplined monitoring because repayment depends more heavily on operating cash flow. The commercial loans industry is therefore balancing more flexible underwriting with the need to control losses across unsecured portfolios.
By Lender Type: Banks Maintain the Largest Share While Other Lenders Grow
Banks held 77.6% of the commercial loans market size in 2025. Their position is supported by deposit funding, branch and relationship-manager networks, and the ability to provide several financial products to the same borrower. Large banks are directing resources toward commercial and industrial, real estate, and mid-market lending. Industrial and Commercial Bank of China reported total loans of RMB 31,992,126 million (USD 4.456 trillion) in June 2026, up 4.9% from year-end 2025. Agricultural Bank of China reported total loans of RMB 28,824,760 million (USD 4.015 trillion) in June 2026, up 4.97%. These results illustrate the lending capacity of the largest banks within the commercial loans market.
Other lenders are projected to grow at a 7% CAGR from 2026 to 2031 in the commercial loans market. This category includes private credit funds, business development companies, fintech lenders, and marketplace platforms. Non-bank financial institutions can offer specialized structures and may lend where bank standards are more restrictive. Their expansion is most relevant for smaller transactions, leveraged borrowers, and companies that need flexible terms. Non-bank financial institution lending reached USD 1.997 trillion in June 2026. Non-bank finance companies also play a meaningful role in South and Southeast Asia by originating small and medium-sized enterprise credit and distributing risk to wholesale banking partners.
Geography Analysis
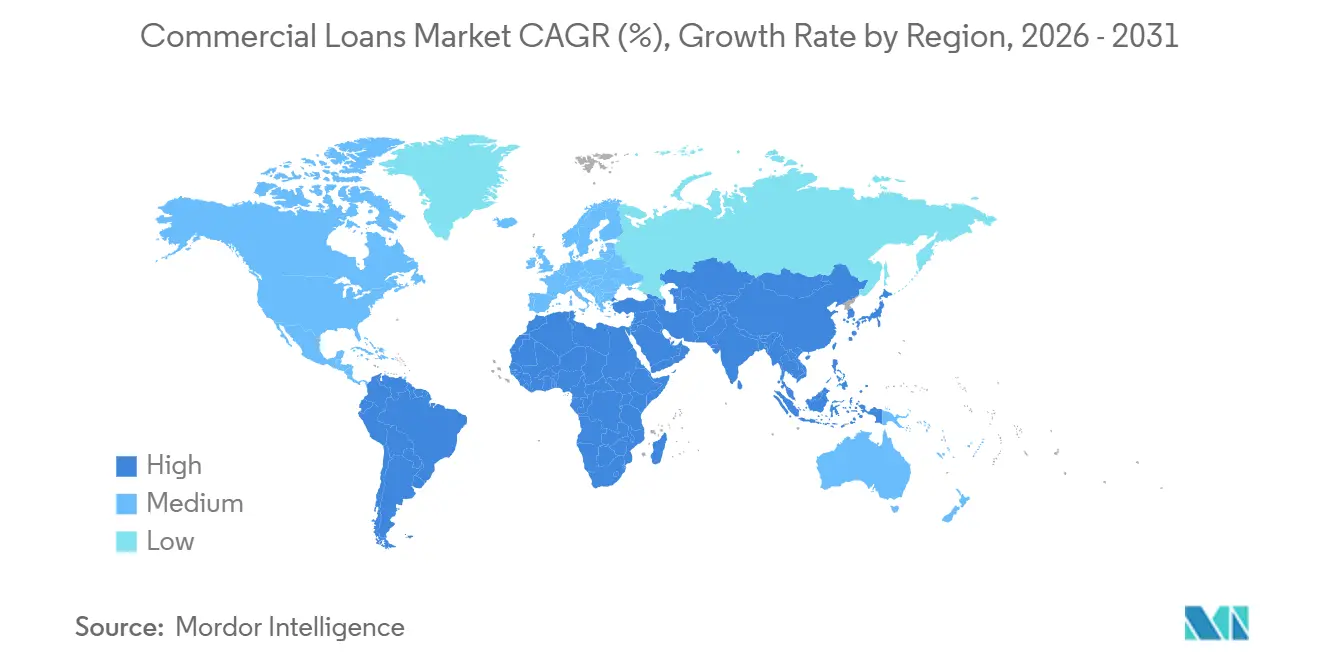
Asia-Pacific held 51.2% of the commercial loans market size in 2025, making it the largest regional base. China and India underpin the region’s scale through manufacturing, infrastructure, and corporate investment activity. Industrial and Commercial Bank of China reported RMB 31,992,126 million (USD 4.456 trillion) in total loans in June 2026, with growth of 4.9% from year-end 2025. Agricultural Bank of China reported RMB 28,824,760 million (USD 4.015 trillion) in total loans in June 2026. Credit policies in China continue to direct lending toward green development, technology, and inclusive finance. India’s credit demand is also shifting toward non-bank structures as borrowers seek funding beyond conventional bank channels.
North America is the second-largest geography, led by the United States commercial and industrial lending base. Commercial and industrial portfolios at commercial banks grew 4.3% in 2025. The Mortgage Bankers Association expects United States commercial mortgage originations of USD 805.5 billion in 2026. Canada is using government-backed working-capital support for small and medium-sized enterprises affected by tariff disruptions. Europe benefits from programs that combine public guarantees and bank distribution. The European Investment Bank Group committed EUR 876 million (USD 1.003 billion) to a Santander securitization that is expected to unlock EUR 1.43 billion (USD 1.637 billion) for Spanish small businesses and mid-sized companies. In the United Kingdom, lending growth among smaller firms supports demand, although refinancing costs remain a concern.
The Middle East and Africa are projected to grow at a 6.1% CAGR from 2026 to 2031, the fastest rate among the geographic segments. Saudi Arabia and the United Arab Emirates are central to regional lending activity because infrastructure investment, economic diversification, and trade finance require large credit facilities. Development-finance institutions are helping extend project finance to private-sector borrowers across African economies. Turkcell’s USD 1 billion Murabaha facility in March 2026 shows that large regional borrowers can access international syndicated financing. South America is led by Brazil, where credit penetration and a large small and medium-sized enterprise base support lending demand. Argentina and other South American markets remain at an earlier stage of institutional credit development. The commercial loans market in these regions depends on lenders’ ability to manage currency, trade, and country-risk conditions.

Competitive Landscape
The commercial loans market has a two-level competitive structure. Large global banks have significant balance-sheet capacity and broad corporate relationships. Non-bank lenders, fintech platforms, and specialist finance companies compete through speed, tailored terms, and data-led underwriting. Banks remain the largest lender group, with 77.6% of commercial lending balances in 2025. This share indicates that established institutions still control the core lending base despite growing competition from private credit. Competitive pressure is strongest in mid-market, working-capital, and smaller-ticket lending.
JPMorgan Chase is pursuing commercial, industrial, and real estate lending opportunities while adding relationship bankers to its mid-market business. Industrial and Commercial Bank of China and Agricultural Bank of China announced separate A-share private placements totaling RMB 260 billion (USD 36.2 billion) in September 2026 to replenish core tier-1 capital. BNP Paribas reported transaction banking loan growth of 10.8% year over year in the first half of 2026. Banco Santander reported that loans increased 9% in the first half of 2026, supported by corporate and investment banking activity and the incorporation of TSB. These actions show that major banks are using capital strength, product breadth, and cross-border networks to protect lending relationships. They also illustrate why the leading banks remain central to the commercial loans market.
Competition is creating openings in underserved small and medium-sized enterprise working capital, thin-file lending, and cross-border supply-chain finance. Alternative providers seek these opportunities through transaction-data systems and faster credit-scoring processes. The Federal Reserve, Office of the Comptroller of the Currency, and Federal Deposit Insurance Corporation re-proposed the Basel III Endgame framework in March 2026. Changes in capital requirements may encourage some large institutions to focus more on fee income and loan syndication. Smaller lenders and credit funds may therefore find more origination opportunities in selected areas.
Commercial Loans Industry Leaders
Bank of America Corporation
JPMorgan Chase & Co.
Wells Fargo & Company
Citigroup Inc.
PNC Financial Services Group, Inc.
- *Disclaimer: Major Players sorted in no particular order

Recent Industry Developments
- June 2026: The World Bank Group's IFC and Banco Santander launched a new USD 500 million risk-sharing facility for supply-chain finance, expected to support USD 1.5 billion in supply-chain transactions over 3 years across emerging markets, with a focus on small and medium-sized enterprise suppliers.
- May 2026: Banco Santander and Uber established a financing platform of up to EUR 1 billion (USD 1.08 billion) to support Uber's fleet operators across Europe, combining commercial auto lending with fleet-renewal infrastructure over a 3-year program.
- March 2026: The Federal Reserve, Office of the Comptroller of the Currency, and Federal Deposit Insurance Corporation jointly re-proposed the Basel III Endgame capital framework, requiring the largest United States banking organizations to adopt the expanded risk-based approach and replacing the current dual-calculation regime, with an estimated 1.4% increase in Common Equity Tier 1 requirements for Category I and II banks.
- March 2026: UniCredit and ING acted as global coordinators for a EUR 375 million (USD 405 million) project financing for Retelit Datacenter, Italy's dominant interconnection platform, comprising a EUR 135 million (USD 145.8 million) term loan, EUR 225 million (USD 243 million) capex facility, and EUR 15 million (USD 16.2 million) revolving credit facility, attracting a broad international lending syndicate.


Global Commercial Loans Market Report Scope
| C&I / Operating Credit |
| Commercial Real Estate |
| Equipment Finance and Leases |
| Trade and Supply-Chain Finance |
| Other Commercial Loans |
| Small and Medium-Sized Enterprises (SMEs) |
| Large Enterprises |
| Manufacturing |
| Construction and Real Estate |
| Wholesale, Distribution and Retail |
| Information Technology and Telecommunications |
| Healthcare and Life Sciences |
| Energy and Utilities |
| Transportation and Logistics |
| Agriculture and Agribusiness |
| Financial and Professional Services |
| Other Industries |
| Secured Loans |
| Unsecured Loans |
| Banks |
| NBFCs |
| Other Lenders |
| North America | United States |
| Canada | |
| Mexico | |
| South America | Brazil |
| Argentina | |
| Rest of South America | |
| Europe | United Kingdom |
| Germany | |
| France | |
| Italy | |
| Spain | |
| Rest of Europe | |
| Asia-Pacific | China |
| Japan | |
| India | |
| South Korea | |
| Australia | |
| Indonesia | |
| Thailand | |
| Malaysia | |
| Singapore | |
| Vietnam | |
| Rest of Asia-Pacific | |
| Middle East and Africa | Saudi Arabia |
| United Arab Emirates | |
| Turkey | |
| South Africa | |
| Egypt | |
| Rest of Middle East and Africa |
| By Loan Type | C&I / Operating Credit | |
| Commercial Real Estate | ||
| Equipment Finance and Leases | ||
| Trade and Supply-Chain Finance | ||
| Other Commercial Loans | ||
| By Borrower Size | Small and Medium-Sized Enterprises (SMEs) | |
| Large Enterprises | ||
| By End-User Industry | Manufacturing | |
| Construction and Real Estate | ||
| Wholesale, Distribution and Retail | ||
| Information Technology and Telecommunications | ||
| Healthcare and Life Sciences | ||
| Energy and Utilities | ||
| Transportation and Logistics | ||
| Agriculture and Agribusiness | ||
| Financial and Professional Services | ||
| Other Industries | ||
| By Security Type | Secured Loans | |
| Unsecured Loans | ||
| By Lender Type | Banks | |
| NBFCs | ||
| Other Lenders | ||
| By Geography | North America | United States |
| Canada | ||
| Mexico | ||
| South America | Brazil | |
| Argentina | ||
| Rest of South America | ||
| Europe | United Kingdom | |
| Germany | ||
| France | ||
| Italy | ||
| Spain | ||
| Rest of Europe | ||
| Asia-Pacific | China | |
| Japan | ||
| India | ||
| South Korea | ||
| Australia | ||
| Indonesia | ||
| Thailand | ||
| Malaysia | ||
| Singapore | ||
| Vietnam | ||
| Rest of Asia-Pacific | ||
| Middle East and Africa | Saudi Arabia | |
| United Arab Emirates | ||
| Turkey | ||
| South Africa | ||
| Egypt | ||
| Rest of Middle East and Africa | ||


Key Questions Answered in the Report
What is the projected value of commercial loans by 2031?
The commercial loans market is projected to reach USD 83.3 trillion by 2031, expanding at a 4.6% CAGR from 2026.
Which loan category holds the largest commercial lending balance?
Commercial and industrial and operating credit held 54.1% of the 2025 lending base.
Which commercial lending category is expected to grow the fastest?
Equipment finance and leases are projected to grow at a 5.8% CAGR through 2031.
Which borrower group is growing fastest in commercial credit?
Small and medium-sized enterprises are projected to grow at a 5.4% CAGR through 2031.
Which region has the largest commercial lending base?
Asia-Pacific held 51.2% of commercial lending balances in 2025.
What is the main risk affecting commercial lending growth?
Higher refinancing costs and commercial real estate credit stress may limit borrowing capacity and raise lender caution.
Page last updated on:





