
Colombia Power Market Size and Share
Market Overview
| Study Period | 2021 - 2031 |
|---|---|
| Forecast Data Period | 2026 - 2031 |
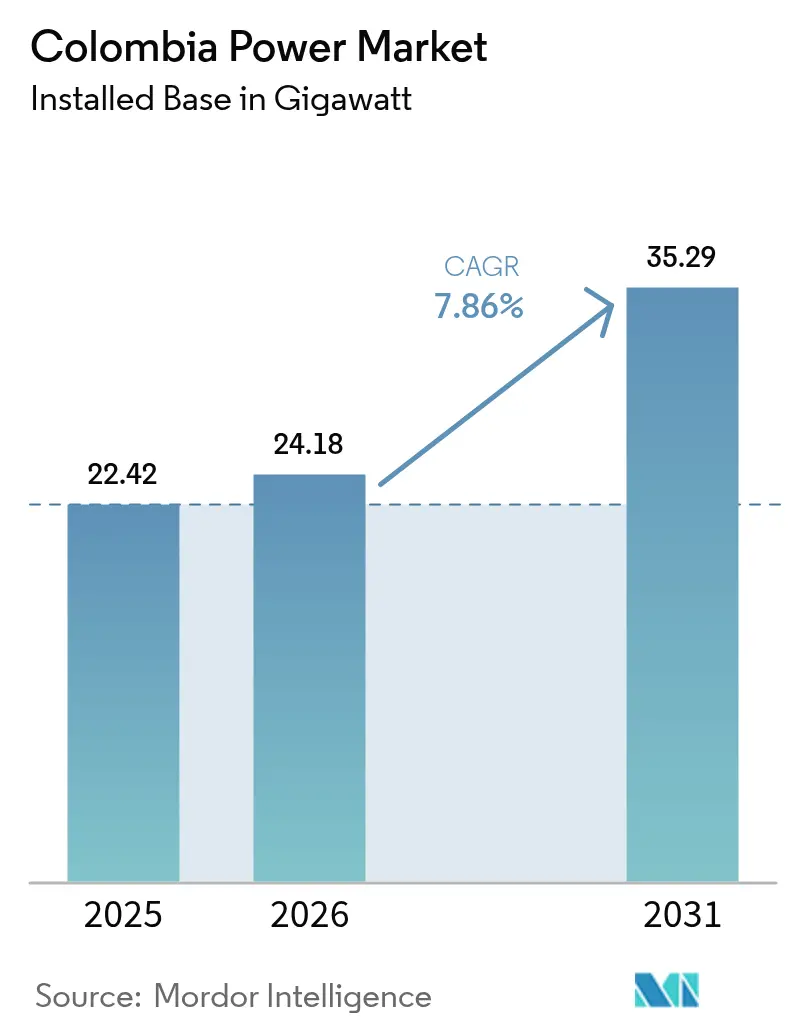
| Base Year Market Size (2025) | 22.42 gigawatt |
| Market Volume (2026) | 24.18 gigawatt |
| Market Volume (2031) | 35.29 gigawatt |
| Growth Rate (2026 - 2031) | 7.86 % |
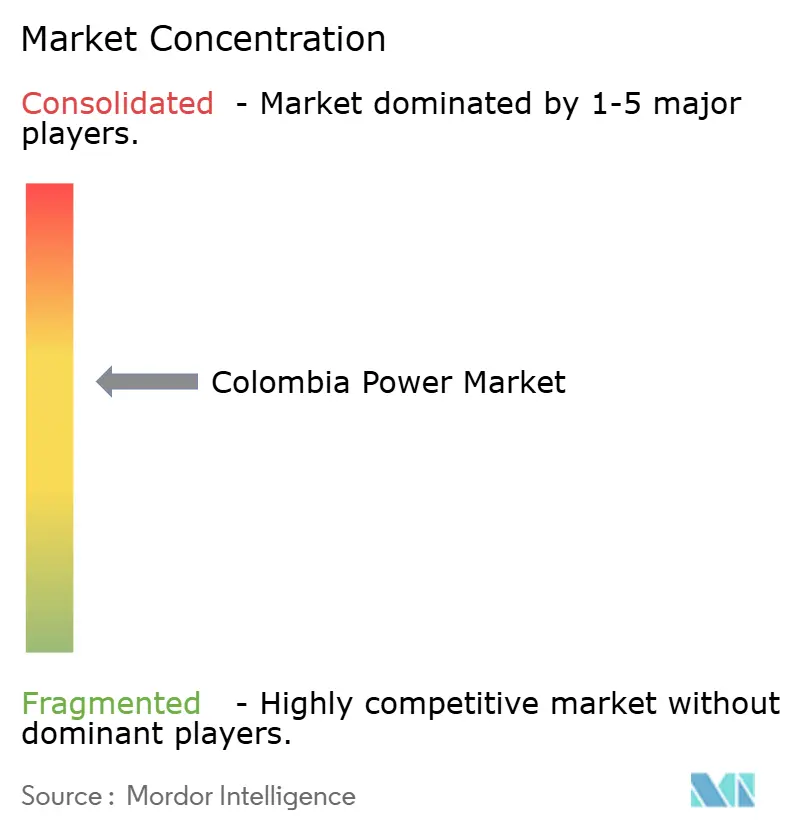
| Market Concentration | Medium |
Major Players *Disclaimer: Major Players sorted in no particular order Image © Mordor Intelligence. Reuse requires attribution under CC BY 4.0. | |
Colombia Power Market Analysis by Mordor Intelligence
The Colombia Power Market size was valued at 22.42 gigawatt in 2025 and estimated to grow from 24.18 gigawatt in 2026 to reach 35.29 gigawatt by 2031, at a CAGR of 7.86% during the forecast period (2026-2031).
Strong policy backing, rapid industrial electrification, and expanding renewable auctions lift capacity additions far above the regional average. The 2024 El Niño drought highlighted hydro-dependency risks, prompting the aggressive rollout of solar and wind energy that now anchors long-term climate resilience. Large-scale green-hydrogen pilots, a USD 40 billion transition plan, and ISA Intercolombia’s grid-modernisation drive further reinforce growth, while heightened digitalization accelerates residential and commercial loads. Competitive pricing in auctions, robust foreign financing, and quicker permitting for self-generators sustain capital inflows even amid regulatory uncertainty, securing the outlook for the Colombia power market.[1]International Trade Administration, “Colombia – Energy Overview,” trade.gov
Key Report Takeaways
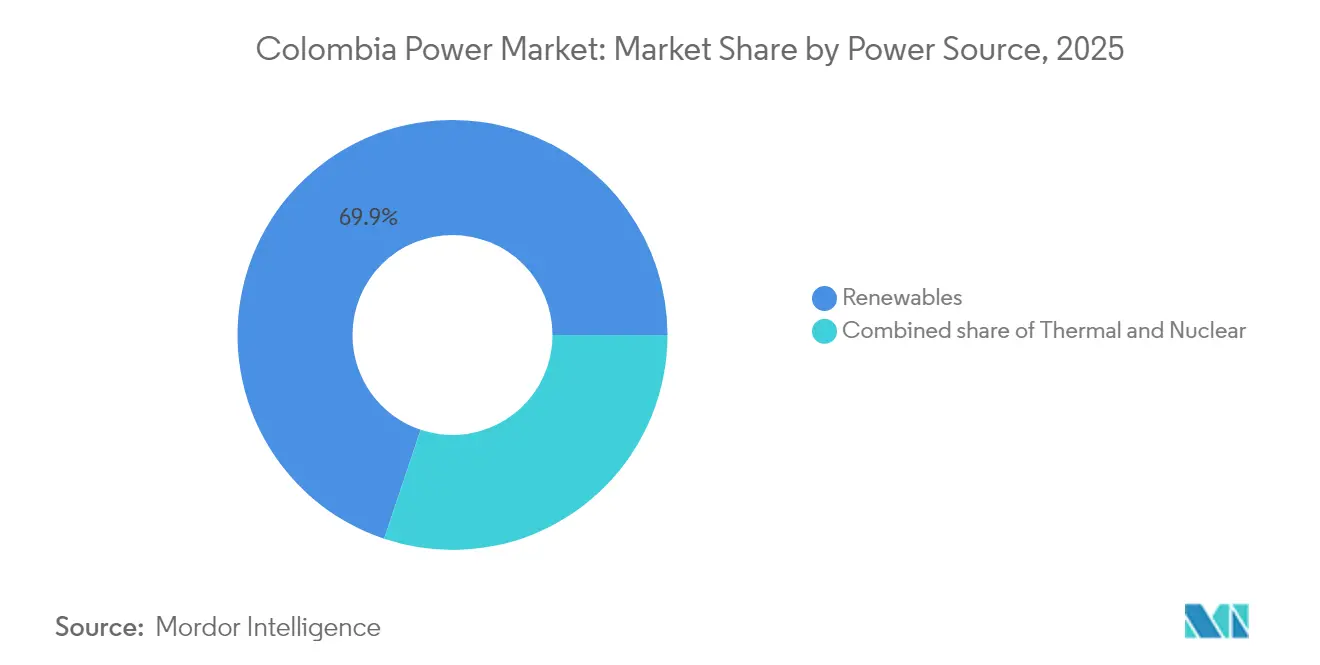
- By power source, renewables captured 69.85% of Colombia's power market share in 2025 and are expected to expand at a 10.22% CAGR through 2031.
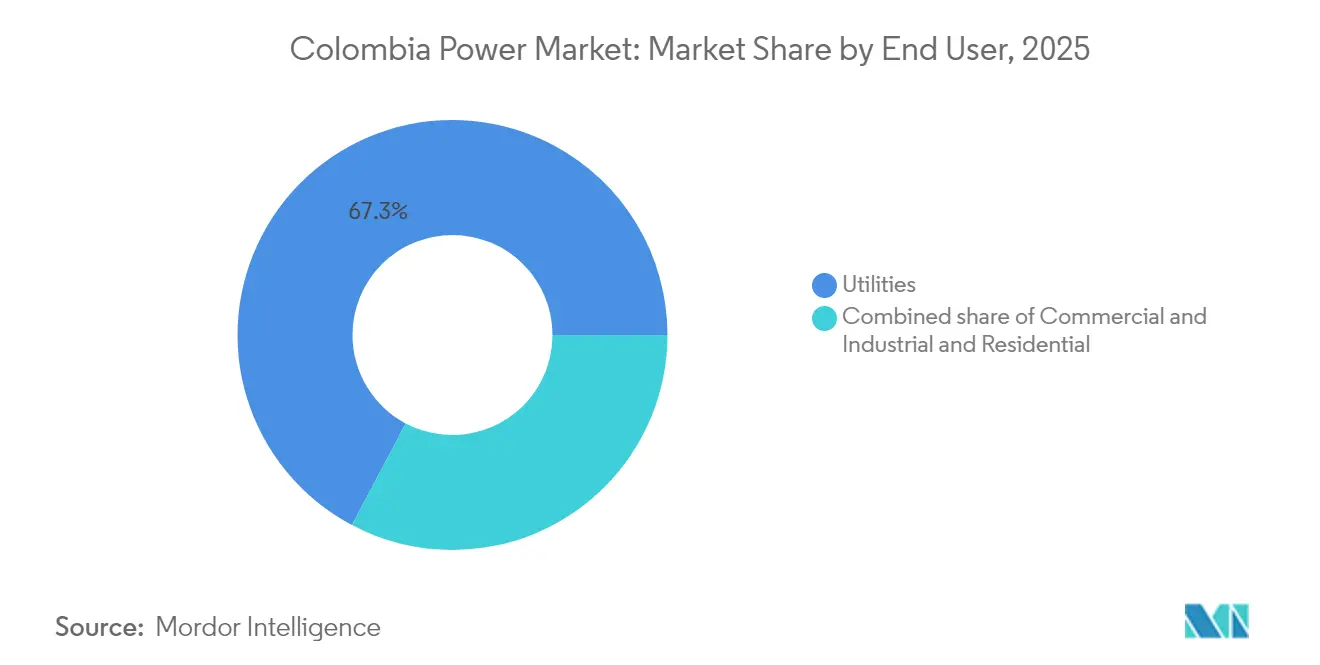
- By end user, utilities held 67.25% of the Colombia power market size in 2025, yet commercial and industrial demand is advancing at a 10.29% CAGR to 2031.
Note: Market size and forecast figures in this report are generated using Mordor Intelligence’s proprietary estimation framework, updated with the latest available data and insights as of 2026.
Colombia Power Market Trends and Insights
Drivers Impact Analysis*
| Driver | (~) % Impact on CAGR Forecast | Geographic Relevance | Impact Timeline | |
|---|---|---|---|---|
| Rising electricity demand from industrial & digital growth | 2.1% | National, with concentration in Caribbean Coast and Central regions | Medium term (2-4 years) | |
| Abundant hydro resources & favourable renewable potential | 1.8% | National, particularly Andean regions and Caribbean Coast | Long term (≥ 4 years) | |
| Government renewable‐energy auctions & incentives (Law 1715) | 2.5% | National, with focus on Atlántico, Cesar, and Córdoba | Short term (≤ 2 years) | |
| Grid-modernisation investments led by ISA Intercolombia | 1.2% | National transmission network | Medium term (2-4 years) | |
| Emerging green-hydrogen hubs spurring flexible generation | 0.5% | Caribbean Coast, particularly La Guajira | Long term (≥ 4 years) | |
| Andean cross-border interconnections enabling power exports | 0.2% | Border regions with Ecuador and Panama | Medium term (2-4 years) | |
| Source: Mordor Intelligence | ||||
Rising electricity demand from industrial & digital growth
Colombia’s digital economy plan aims for nationwide 5G rollouts and 63% internet penetration by 2026, while reducing data center electricity needs as mining and metallurgy shift to electric haulage and automated rigs. Energy demand increased by 5.48% year-over-year in February 2024, driven by the regulated household and small-industry segments, which require higher quality and more stable supply. Caribbean industrial parks absorb the largest loads, reflecting the growth of port logistics, agro-processing, and free-trade zones. Utilities respond with smart meters and time-of-use tariffs to flatten peaks, while self-generation reforms let factories sell surplus solar power into the Colombia power market.
Government renewable-energy auctions & incentives (Law 1715)
The 2024 reliability auction secured 4.4 GW of solar capacity at a record USD 18.2/MWh, guaranteeing 20-year revenue and derisking cash flows for global developers. Law 1715 offers income tax deductions, VAT relief, and accelerated depreciation, reducing the equity payback period to below five years for utility-scale assets. Self-generator caps increased from 1 MW to 5 MW, broadening participation to include agribusiness and retail chains. The ministry projects 2,550 MW of new renewable capacity in 2025, adding COP 3.7 trillion to GDP and sustaining Colombia's power market expansion.
Abundant hydro resources & favourable renewable potential
Hydro plants still anchor grid inertia, yet La Guajira’s 20 GW wind corridor and 7 GW offshore target unlock seasonally complementary resources that limit storage needs.[2]World Bank Energy Team, “As Colombia leads on renewables, boosting its clean hydrogen industry is the next step,” worldbank.org Government data list 139 exajoules of geothermal heat, equal to 1.17 GW of firm capacity awaiting auction in 2025. Solar irradiation tops 4.5 kWh/m² across the Caribbean, enabling 25% capacity factors. Resource depth allows diversified siting that lessens curtailment, while hydro reservoirs provide virtual batteries for evening ramps, protecting the Colombia power market against weather shocks.
Grid-modernisation investments led by ISA Intercolombia
ISA directed 71% of COP 3.9 trillion Q1 2023 capex into new 230 kV and 500 kV lines and wide-area phasor networks. Real-time control devices at Santa Marta 220 kV substation reroute coastal solar surges, cutting congestion by 18% during trials.[3]Sebastián Hincapié et al., “Real-Time Simulations…,” arxiv.org The stalled Colombia–Panama intertie would add 400 MW bidirectional capacity once biodiversity offsets are clear, opening export arbitrage windows. These upgrades shave curtailment risk and keep renewable projects bankable, supporting the Colombia power market’s 8%-plus trajectory.
Restraints Impact Analysis*
| Restraint | (~) % Impact on CAGR Forecast | Geographic Relevance | Impact Timeline |
|---|---|---|---|
| Hydrology dependency & El Niño supply variability | -1.5% | National, particularly Andean hydroelectric regions | Short term (≤ 2 years) |
| Regulatory uncertainty over tariff adjustments | -1.0% | National, with acute impact on Caribbean Coast | Medium term (2-4 years) |
| Transmission bottlenecks delaying project execution | -0.7% | National grid, critical corridors to La Guajira | Medium term (2-4 years) |
| Social opposition & indigenous consultations delaying RE projects | -0.5% | La Guajira and other indigenous territories | Long term (≥ 4 years) |
| Source: Mordor Intelligence | |||
Hydrology dependency & El Niño supply variability
Reservoir inflows plunged during El Niño 2024, tripling gas burn and pushing wholesale prices up 23% to COP 763.48/kWh. Bogotá imposed water rationing, exposing the water–energy nexus. The Colombia power market still leans on hydro for 50% of firm energy, so drought events hinder the growth outlook. Solar and wind yield higher during dry seasons, yet their ramp-up speed lags behind near-term deficit risks, keeping thermal standby capacity costly.
Social opposition & indigenous consultations delaying RE projects
Wayuu protests halted Enel’s Windpeshi site 60% of workdays in 2023, inflating costs to USD 400 million and reaching only 35% completion. Celsia exited two wind licences after multi-year stalemates, relocating turbines to Peru. Draft reforms would allow licenses to proceed ahead of full consultations, but local distrust persists. Delays skew immediate investment to solar in less contentious districts, reshaping the Colombia power market pipeline geography.
*Our forecasts treat driver/restraint impacts as directional, not additive. The impact forecasts reflect baseline growth, mix effects, and variable interactions.
Segment Analysis
By Power Source: Renewable Dominance Accelerates
Renewables delivered 69.85% of Colombia's power market share in 2025 on a 15.66 GW base, and they are on track for a 10.22% CAGR to 2031. Auctions steered 4.4 GW of solar at USD 18.2/MWh, driving utility pipelines in Atlántico, Cesar, and Córdoba. The Colombia power market size for solar could top 6 GW by 2027 if supply-chain logistics hold steady. Wind additions are lagging due to disputes in La Guajira, yet offshore solicitations have attracted nine global developers eager for 25-year concessions. Geothermal's first 1.17 GW tender in 2025 offers base-load potential that buffers hydro volatility.
Thermal fleets supplied essential peaking power during the 2024 drought, but mounting carbon pricing and fuel volatility are shortening dispatch windows. Gas discoveries, such as Kronos-1, may reassure supply after 2031; however, investors already favour hybrid solar-storage stacks for capacity credits. Small biomass and waste-to-energy plants fill rural niches, while tidal pilots gain grants along the Pacific coast. Together, these shifts consolidate a highly renewable system without compromising reliability, reinforcing the long-run appeal of the Colombia power market.



By End User: Commercial and Industrial Growth Drives Demand
Utilities channeled 67.25% of delivered electricity in 2025, yet commercial and industrial customers are lifting demand at a 10.29% CAGR, reflecting heavy investment in processing, logistics, and cloud computing hubs. The Colombia power market size serving data centers rose 19% in 2024, as fintech adoption tripled the number of server racks in Bogotá and Barranquilla. Mining clusters electrify haul trucks and crushers, cutting diesel imports and stabilizing load curves. Self-generation reforms to 5 MW unlock rooftop and ground-mount arrays on factory roofs, curbing grid import bills and injecting surplus into local feeders.
Residential loads increase steadily with urban migration and the adoption of cooling systems. The USD 10 billion “Colombia Solar” program plans to equip 500,000 low-income homes with PV, reshaping evening peaks and easing subsidy burdens. Demand-response pilots now cover 14 industrial estates and 20,000 smart appliances, targeting 500 GWh of flexible load and setting a template for 2,500 GWh by 2030. These dynamics broaden the customer mix and cement the growth fulcrum for the Colombia power market.
Geography Analysis
The Caribbean Coast hosts over half of the 2024 renewable ground-breakings, owing to prime irradiation, steady trade winds, and proximity to 230 kV substations. Atlántico’s solar cluster added 700 MW in one year, while La Guajira’s wind lanes await consultation reforms. Port infrastructure supports turbine imports, positioning the coast as a future green-hydrogen export hub. Social conflicts, however, create execution uncertainty that tilts near-term capacity toward solar and battery hybrids in Cesar and Córdoba, guarding the Colombia power market against schedule slips.
The Andean interior remains the heartland of hydropower, with reservoirs in Cundinamarca and Antioquia balancing daily fluctuations. Climate swings reduced inflows by 38% during the 2024 drought, spotlighting the need for diversified firm generation. Rooftop PV in Bogotá doubled in 2024 under streamlined net-billing rules, easing midday peak stress. Central departments expect 73% of new solar installations in 2025, thanks to land availability and shorter interconnection queues, thereby cementing their share within the Colombia power market size.
Pacific and Amazonian zones see limited utility-scale buildouts but gain microgrids that cut diesel reliance in non-interconnected areas. A Buenaventura LNG terminal proposal could stabilize local peaking needs, while geothermal mapping around Cauca sets the stage for pilot wells. Cross-border ties with Ecuador export surplus during wet seasons but were suspended for three weeks in 2024 when domestic reserves fell, underscoring the delicate regional interdependence. Offshore wind tranches along the Caribbean shelf are expected to reach up to 50 GW post-2035, securing Colombia’s ambition as an energy exporter and further expanding Colombia's power market footprint.
Regulatory Landscape
Colombia's power sector is governed by a split-institution model led by the Ministry of Mines and Energy (MME) for policy, the Commission for the Regulation of Energy and Gas (CREG) for market rules and tariffs, and the Unit of Mining and Energy Planning (UPME) for planning and connection processes within the National Interconnected System (SIN). Core transition-enabling legislation includes Law 2099 of 2021 and the market modernization framework under Decree 1091 of 2025, supporting a shift toward structured, longer-tenor procurement alongside conventional reliability mechanisms.
In 2026, the long-term contracting framework was formalized through MME Resolution 40178 (March 2026) and Resolution 40208 (April 2026). These set general rules and technical parameters for long-term electricity contracting mechanisms that explicitly cover generation, storage, and related infrastructure. CREG Resolution 101-109 (April 2026) defined regulatory competencies tied to the mechanism, including cost transfer for regulated users and guarantees linked to commercial operation dates, while UPME Circular 020 (April 2026) tightened grid-connection governance by requiring updated electrical models in the Unified Window used for connection studies.
Competitive Landscape
Three incumbents, ISAGEN, EPM, and Ecopetrol, controlled roughly 60% of installed capacity in 2024, giving the Colombia power market a moderate concentration profile. ISAGEN supplied 15.6% of national demand from 3,140 MW of mainly renewable assets and is trialing a 50 MW battery at San Carlos hydropower to sell ancillary services. Ecopetrol spent USD 1 billion buying Statkraft's 1.3 GW pipeline and acquired 49% of the 1,087 MW Jemeiwaa Ka'I wind cluster, diversifying beyond hydrocarbons. EPM focuses on finalizing the 2.4 GW Ituango plant while rolling out 120 MW of solar on corporate rooftops.
International entrants, such as Enel Green Power, secure low-cost finance via a USD 300 million synthetic facility with the EIB and SACE, allowing sub-COP 180/kWh bids that reset the auction floors. Celsia pivots from contested wind assets to distributed solar, installing 25 MW of solar panels on supermarket roofs within six months. Tech start-ups bundle IoT meters and solar leasing for SMEs, nibbling at utility margins. Geothermal and offshore wind remain open fields, where early movers may lock scarce permits. Overall rivalry tightens, but deep capital and integrated grids still give the incumbents sizeable advantages, shaping a Colombia power market that balances legacy heft and new-energy agility.
Colombia Power Industry Leaders
Empresas Públicas de Medellín (EPM)
ISAGEN SA
Enel Colombia
Celsia SA ESP
AES Colombia
- *Disclaimer: Major Players sorted in no particular order

Market Opportunities and Future Outlook
The 2026 long-term contracting rules (MME Resolutions 40178 and 40208, and CREG Resolution 101-109) create a clearer procurement pathway that explicitly includes storage alongside generation. That widens the scope for hybrid solar-plus-storage and other flexible capacity offerings that can reduce exposure to spot-market volatility during hydrology stress events. The direction is consistent with observable market momentum in Colombia, where the 2024 reliability auction awarded 4.4 GW of solar at USD 18.2/MWh and accelerated the utility-scale pipeline in Caribbean departments.
System adequacy and fuel-security initiatives are also influencing near-term investment themes. In May 2026, XM conducted a Firm Energy Obligations (OEF) auction awarding 4,069.7 MW of new capacity for the 2029-2030 period, reinforcing bankable long-tenor revenue structures for new builds. Separately, LNG regasification activity in 2026, including the US$150 million Ballenas LNG project receiving technical viability clearance and the Buenaventura regasification facility targeting a November 2026 startup, supports opportunity for gas-backed flexibility during dry seasons. Grid integration remains a practical constraint and an actionable opportunity, reflected in UPME's April 2026 push for updated network modeling in the Unified Window, and the July 2026 environmental licensing for a transmission line to connect the San Bartolome hydroelectric plant to the SIN, pointing to continued permitting and buildout needs for transmission and interconnection services.
Recent Industry Developments
- May 2026: Enel Colombia reported surpassing 1 GW of installed solar capacity in the country, following final energization stages tied to the Atlantico photovoltaic project. The milestone reflects the pace of utility-scale solar clustering in the Caribbean region and sets a higher bar for peers competing in auction-backed and corporate-PPA pipelines.
- December 2025: Brookfield Renewable completed the acquisition of an incremental 15% ownership stake in ISAGEN S.A. for about USD 1 billion. The transaction increases international capital exposure to Colombia's hydro-heavy platform while supporting balance-sheet capacity for repowering, grid services, and complementary renewable additions.
- October 2024: The European Investment Bank extended a USD 300 million financing package to Enel Colombia for the Guayepo solar expansion. Access to lower-cost, long-tenor funding supports aggressive build schedules and competitive pricing in Colombia's long-term contracting and reliability-oriented procurement processes.


Research Methodology Framework and Report Scope
Market Definition and Coverage
For this study, the Colombia power market is defined at the country level as the electricity supply system measured through installed generation capacity and the related build-out needed to serve demand over time.
Scope exclusions: We exclude captive, behind-the-meter generation that is not connected to the national grid, and we also exclude temporary rental power units used for short-term emergency supply.
Segmentation Overview
- By Power Source
- Thermal (Coal, Natural Gas, Oil and Diesel)
- Nuclear
- Renewables (Solar, Wind, Hydro, Geothermal, Biomass & Waste, Tidal)
- By End User
- Utilities
- Commercial and Industrial
- Residential
- By T&D Voltage Level (Qualitative Analysis only)
- High-Voltage Transmission (Above 230 kV)
- Sub-Transmission (69 to 161 kV)
- Medium-Voltage Distribution (13.2 to 34.5 kV)
- Low-Voltage Distribution (<1 kV)
Data Sources, Market Sizing, and Validation
Desk Research
Desk research was used to set the factual boundaries of Colombia's electricity system, and then to build a clean history for capacity additions and demand direction. Public sources such as the Ministry of Mines and Energy, UPME planning documents, XM market publications, and DANE economic and industrial indicators were reviewed to ground assumptions that can be traced. We also referenced International Energy Agency datasets, World Bank energy access series, and macro indicators where available to cross-check reported capacity and generation trends.
To translate those signals into a workable model, we added context from company filings, investor presentations, utility project updates, and reputable press coverage on auctions, grid constraints, and large additions. For some company-level financial checks and project tracking, we used a paid subscription focused on company financials and news intelligence, and we also used a patent database in a limited way to validate activity around grid and generation technologies. The specific desk sources named here are illustrative only, and many other public references were used for data collection, validation, and clarification.
Primary Interviews and Surveys
Primary interviews and surveys were conducted with a mix of generation owners, EPC and service firms, grid-side stakeholders, and large buyers to confirm what is getting built and connected in Colombia's power sector. We used these discussions to validate commissioning timelines, typical utilization ranges by technology, and practical constraints such as permitting, interconnection queues, and grid upgrade readiness across key demand centers.
Distribution of primary research fieldwork respondents
| Company type | Respondent position |
|---|---|
| Top tier: 25% | CXOs: 16% |
| Mid tier: 56% | Functional/Unit leaders: 32% |
| Smaller Players: 19% | Managers: 52% |
Market-Sizing & Forecasting
The sizing model starts from a top-down reconstruction of the country capacity base using published system statistics and planning pipelines, which are then adjusted for realistic commissioning and retirement timing. We then corroborate the totals with selective bottom-up approximations, such as sampled project-level capacity rollups, implied capacity from generation and capacity factor ranges, and sense checks against public expansion plans shared by market participants.
A few practical inputs guide the build, including installed capacity by technology, annual additions and retirements, auction awards and contracted capacity, reserve margin and reliability needs, and grid connection readiness that can delay commissioning. When an input series is patchy, we fill gaps using conservative interpolation anchored to known project milestones and then re-test the trend against system-level totals.
For forecasting, scenario analysis is used so the outlook reflects how permitting pace, interconnection timing, hydrology variability, and fuel availability can shift additions year to year. The final path is selected after checking that assumptions match what interviewees describe as buildable, and that implied growth does not break physical constraints in the network.
Data Validation & Update Cycle
Outputs are checked against independent system signals, such as published installed capacity totals, reported generation trends, and visible project commissioning events. If any estimate creates an odd jump that cannot be explained by auctions, retirements, or grid constraints, the drivers are reworked and the assumption trail is reviewed again.
Before sign-off, the model goes through multiple analyst review steps, and follow-up outreach is triggered when key inputs like commissioning dates or policy changes look uncertain. Reports are refreshed annually, and interim updates are added when material events occur such as major auctions, rule changes, or large project delays. Before delivery, we do a fresh pass of recent public releases so clients receive the latest updated view.
Mordor Intelligence's Colombia Power Market Size Compared Against Other Published Estimates
Published market values for the Colombia power sector can look far apart, mainly because some sources size the market in revenue terms, while others size it in capacity terms, and the conversion between the two is not straightforward. Differences also come from what gets counted as part of the market, such as whether off-grid projects or grid upgrades are included, and which year and currency timing are used.
Installed capacity totals, observed commissioning milestones, and planning pipeline checks are the evidence that keeps Mordor Intelligence's estimate tied to a capacity-based market definition instead of mixing in electricity sales revenues. When other publications report a USD value, the result often depends on assumed tariffs, wholesale prices, and demand growth scenarios, which can move the number without any real change in physical capacity.
Benchmark comparison
| Source | Market Size | Gaps in Research Methodology |
|---|---|---|
| Mordor Intelligence | USD 22.42 B (2025) | |
| Regional Consultancy A | USD 13.00 B (2024) | Reported in revenue terms and tied to a specific base year, which makes the figure sensitive to tariff levels, wholesale price assumptions, and currency timing rather than installed capacity changes. |
| Trade Journal B | USD 18.70 B (2026) | Uses a value-based definition with a longer horizon, and it appears to fold in broader grid and technology themes, which can shift market boundaries beyond installed generation capacity. |
The table shows that the spread is mostly driven by unit choice and scope boundaries, not just different math. By keeping the steps anchored to capacity additions, retirements, and visible commissioning evidence, our approach stays traceable to signals that can be rechecked each year, and then updated when the pipeline or policy reality changes.


Key Questions Answered in the Report
What capacity will Colombia reach by 2031?
Forecasts place total installed capacity at 35.29 GW, up from 24.18 GW in 2026.
Which segment grows fastest in the next five years?
Commercial and industrial demand leads with a projected 10.29% CAGR through 2031.
How large is the renewable share today?
Renewables already supply 69.85% of generation, among the world’s highest penetration rates.
What policy tools drive new capacity?
Reliability auctions under Law 1715 award 20-year contracts, while tax breaks and VAT relief cut project payback periods.
Where are most solar projects located?
Atlántico, Cesar, and Córdoba departments host the bulk of new solar farms due to high irradiation and grid access.
How concentrated is market ownership?
The top three players hold about 60% of capacity, indicating moderate concentration and room for new entrants.
Page last updated on:





