Market Overview
| Study Period | 2021 - 2031 |
|---|---|
| Forecast Data Period | 2026 - 2031 |
| Historical Data Period | 2021 - 2024 |
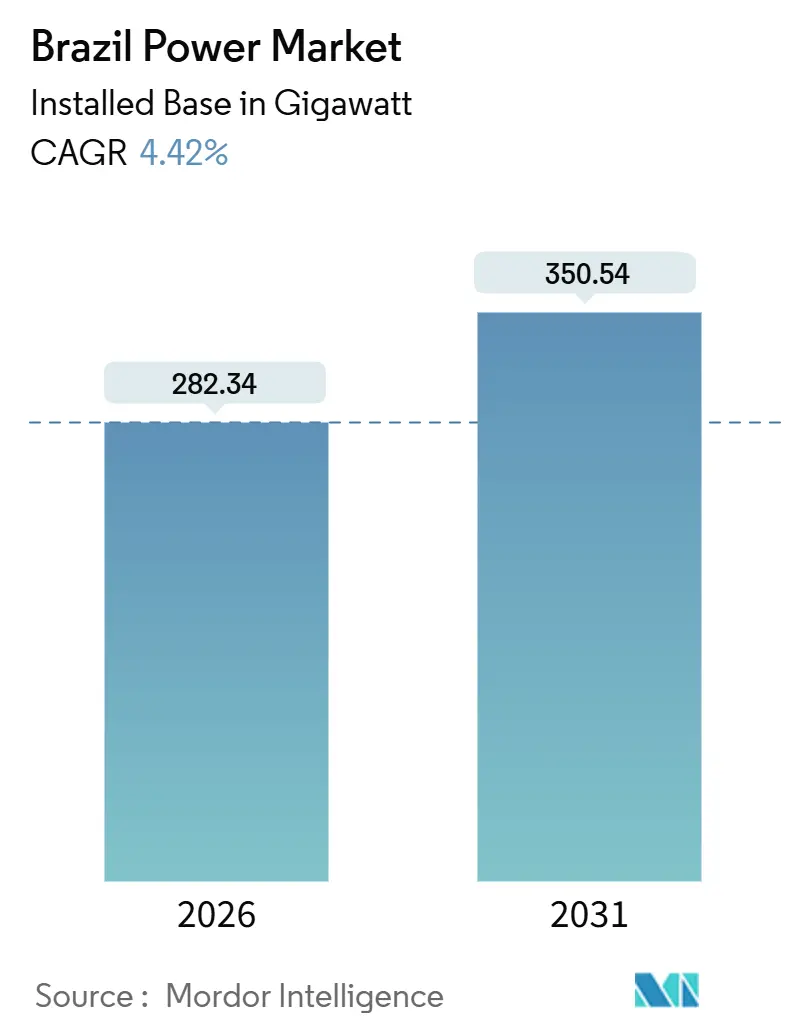
| Market Volume (2026) | 282.34 gigawatt |
| Market Volume (2031) | 350.54 gigawatt |
| Growth Rate (2026 - 2031) | 4.42% CAGR |
| Market Concentration | Medium |
Major Players *Disclaimer: Major Players sorted in no particular order Image © Mordor Intelligence. Reuse requires attribution under CC BY 4.0. | |
Brazil Power Market Analysis by Mordor Intelligence
The Brazil Power Market size in terms of installed base is expected to grow from 282.34 gigawatt in 2026 to 350.54 gigawatt by 2031, at a CAGR of 4.42% during the forecast period (2026-2031).
This trajectory reflects a decisive pivot away from large hydro toward a diversified renewable portfolio, spurred by the 2022 privatization of Eletrobras, which unlocked BRL 17 billion (USD 3.4 billion) in generation and transmission capital through 2027. Annual transmission auctions mobilized BRL 12.4 billion (USD 2.5 billion) in 2025 to relieve Northeast-to-Southeast grid congestion, enabling wind and solar producers to curtail fewer gigawatt-hours of output. Net-metering Law 14.300/2022 accelerated distributed solar to 40 GW by June 2025, while pre-salt associated gas supports an 800 MW gas-fired build-out that backs up intermittent renewables. Collectively, these drivers give the Brazil power market scalable pathways to balance reliability, decarbonization, and affordability targets through 2031.
Key Report Takeaways
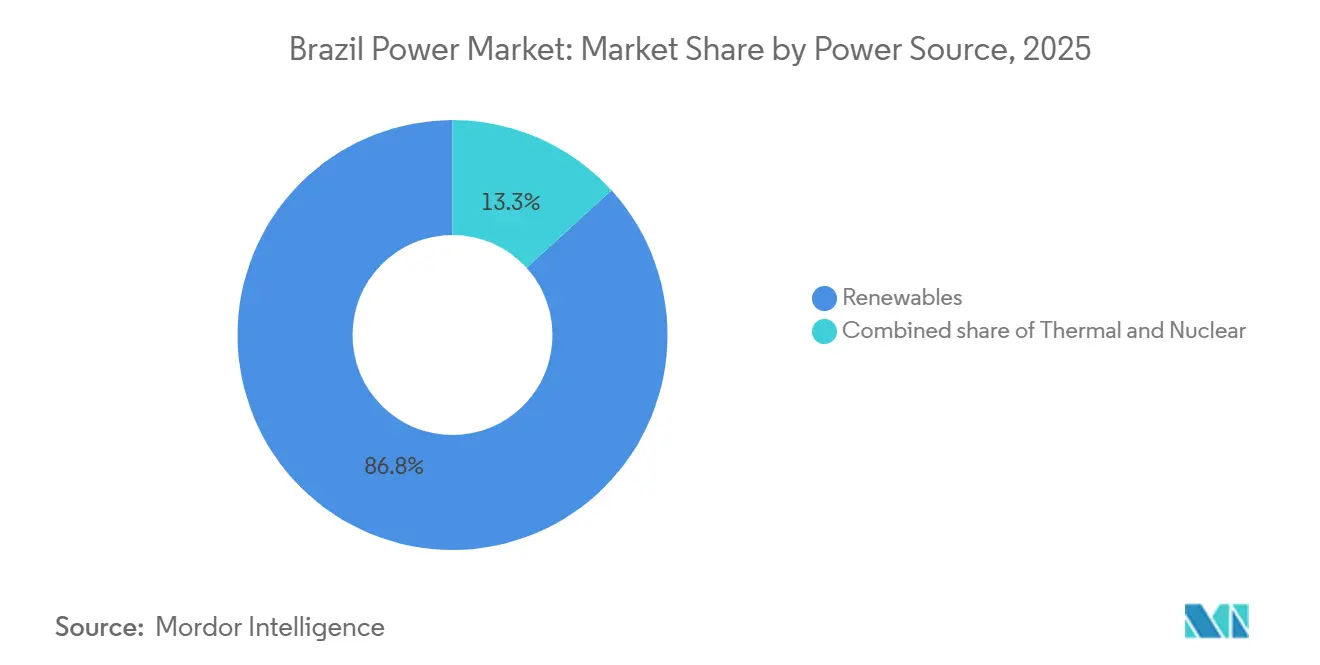
- By power source, renewables captured 86.75% of the Brazil power market share in 2025 and are forecast to grow at a 5.17% CAGR through 2031.
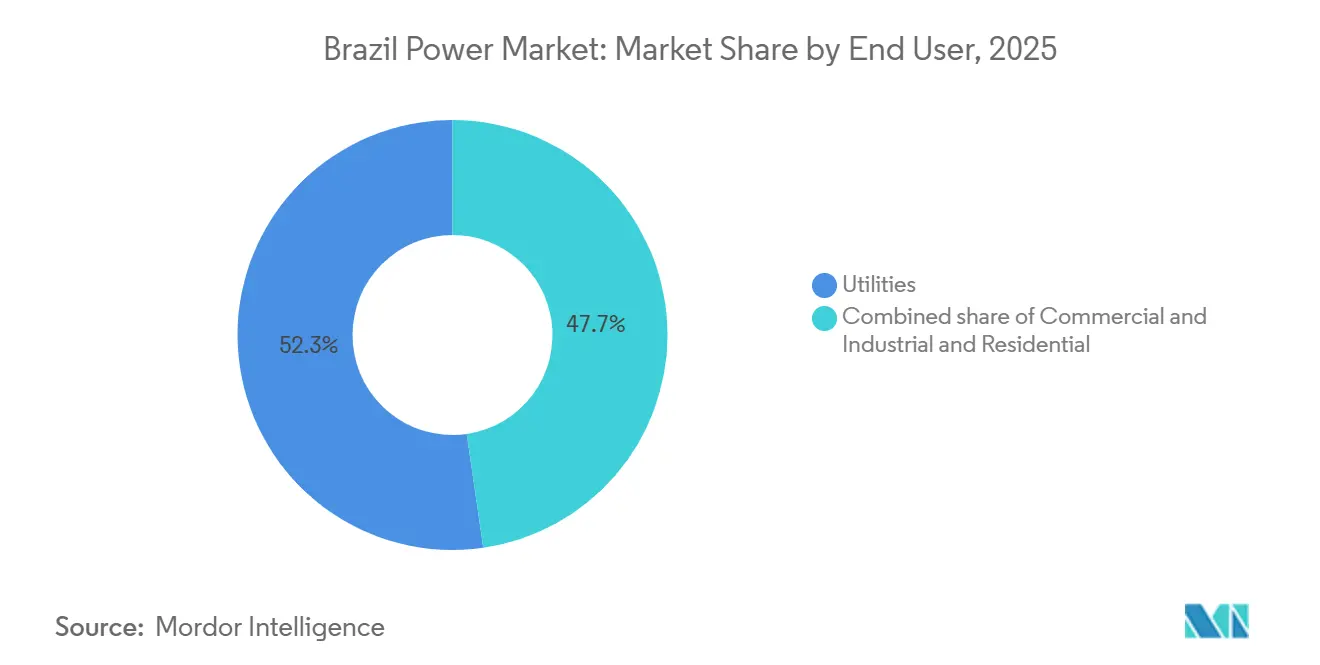
- By end user, the Commercial and Industrial segment posted the fastest expansion at a 13.72% CAGR through 2031, while regulated utilities retained 52.28% of demand in 2025.
Note: Market size and forecast figures in this report are generated using Mordor Intelligence’s proprietary estimation framework, updated with the latest available data and insights as of January 2026.
Brazil Power Market Trends and Insights
Drivers Impact Analysis*
| Driver | (~) % Impact on CAGR Forecast | Geographic Relevance | Impact Timeline |
|---|---|---|---|
| Privatization of Eletrobras Unlocking Capex Surge in Generation & T&D | +0.8% | National, with concentration in Southeast and South generation assets | Medium term (2-4 years) |
| Long-Term Expansion Plan 2032 Prioritizing Non-Hydro Renewables | +1.2% | National, strongest in Northeast (wind) and Central-West (solar) | Long term (≥ 4 years) |
| Annual Transmission Auctions Catalyzing Grid Expansion across North-Northeast | +0.7% | North-Northeast corridor, spillover to Southeast load centers | Medium term (2-4 years) |
| Net-Metering Law (14.300/2022) Accelerating Distributed Solar Adoption | +0.9% | National, early gains in São Paulo, Minas Gerais, Rio Grande do Sul | Short term (≤ 2 years) |
| Gas-to-Power Build-out Leveraging Pre-Salt Associated Gas | +0.5% | Southeast coastal states (Rio de Janeiro, São Paulo) | Medium term (2-4 years) |
| Corporate PPA Demand for 24/7 Clean Power from Data Centers & Mining | +0.6% | Southeast (data centers), North (mining operations) | Short term (≤ 2 years) |
| Source: Mordor Intelligence | |||


Privatization Of Eletrobras Unlocking Capex Surge In Generation & T&D
The 2022 privatization removed state-imposed capital constraints, enabling Eletrobras to invest BRL 1.6 billion (USD 320 million) in 2025 and BRL 17 billion (USD 3.4 billion) across 2023-2027 in modernizing hydro fleets and building new high-voltage corridors. Private ownership imposes performance incentives that accelerate project schedules and attract co-investment from global infrastructure funds. As the utility’s market share slides, Neoenergia, Enel Brasil, CPFL Energia, and Engie Brasil are scaling renewables and smart-grid deployments, intensifying competition that ultimately curbs end-user tariffs.
Long-Term Expansion Plan 2034 Prioritizing Non-Hydro Renewables
EPE’s Plan delimits a path to 83% renewable generation by 2031, emphasizing modular wind and solar over large hydro that faces licensing headwinds.[1]Empresa de Pesquisa Energética, “Plano Decenal de Expansão de Energia 2032,” epe.gov.br Northeast wind capacity factors average above 50%, and Central-West solar additions proceed on 18-24 month schedules. The Plan earmarks battery storage as a grid-balancing tool, positioning behind-the-meter systems to scale once ANEEL finalises ancillary-services participation rules.
Annual Transmission Auctions Catalysing Grid Expansion across North-Northeast
ANEEL’s 2025 auction awarded 3,500 km of new high-voltage lines under 30-year concessions, drawing domestic operators such as ISA CTEEP and global entrants including State Grid Brazil Holding.[2]Agência Nacional de Energia Elétrica, “Leilão de Transmissão 02/2025,” aneel.gov.br The corridors will evacuate stranded Northeast renewables to Southeast load centers, mitigating 2024 curtailments that idled 2 GW of wind farms. Regulated tariffs secure predictable returns that crowd in private capital previously concentrated in generation.
Net-Metering Law 14.300/2022 Accelerating Distributed Solar Adoption
Regulatory clarity on grid-access fees and compensation mechanisms propelled distributed generation to 40 GW by mid-2025, with São Paulo, Minas Gerais, and Rio Grande do Sul accounting for 60% of new rooftops. Remote net-metering provisions allow urban consumers to credit rural solar output, spawning aggregator platforms that pool small systems into virtual power plants eligible for future ancillary revenues.
Restraints Impact Analysis*
| Restraint | (~) % Impact on CAGR Forecast | Geographic Relevance | Impact Timeline |
|---|---|---|---|
| Drought-induced hydrological risk | -0.3% | Amazon and São Francisco basins | Short term (≤ 2 years) |
| Environmental licensing bottlenecks | -0.1% | Nationwide, acute in Amazon and Atlantic Forest | Medium term (2-4 years) |
| Foreign-exchange volatility on equipment imports | -0.05% | Nationwide, Southeast manufacturing nodes | Short term (≤ 2 years) |
| High technical and commercial losses in Northern distribution | -0.05% | Amazonas, Pará, Roraima | Long term (≥ 4 years) |
| Source: Mordor Intelligence | |||
Drought-Induced Hydrological Risk Impacting Hydro Dominant Mix
Severe 2024 drought pushed Belo Monte, Santo Antônio, and Jirau to below 10% of capacity in September, forcing the system operator to dispatch costly thermal units and import regional power. Climate models foresee a 7-30% drop in river-flow energy potential by 2030, heightening reliance on LNG imports that doubled regasification to 5.1 Bcf/d by August 2025.[3]U.S. Energy Information Administration, “Brazil Country Analysis Brief,” eia.gov
Environmental Licensing Bottlenecks for Large-Scale Projects
IBAMA approval times reached 5-7 years through 2024, stalling BRL 100 billion (USD 20 billion) in renewable pipelines. A July 2025 law sets binding timelines and digital filings, yet effectiveness hinges on agency staffing and state adherence.
*Our forecasts treat driver/restraint impacts as directional, not additive. The impact forecasts reflect baseline growth, mix effects, and variable interactions.
Segment Analysis
By Power Source: Renewables Anchor Growth Amid Hydro Decline
Renewables accounted for 86.75% of installed capacity in 2025, and the renewables segment is forecast to expand at a 5.17% CAGR through 2031, eclipsing the 4.42% overall growth rate. Wind additions in Bahia and Ceará benefit from 50% capacity factors, while distributed solar scaled to 40 GW under Law 14.300/2022. Biomass cogeneration moderates dry-season hydro deficits, though feedstock competition caps expansion. Hydro still dominates absolute megawatts, yet hydrological volatility and licensing hurdles redirect capex toward run-of-river upgrades rather than new dams.
Thermal technologies comprise 13.25% of the Brazil power market. Natural gas is the lone growth engine, with the Route 3-linked 800 MW portfolio using pre-salt supply priced in BRL, insulating developers from FX spikes. Coal remains legacy, and oil-diesel units operate mainly in isolated Amazon micro-grids. Nuclear’s two-unit Angra complex offers baseload stability, but cost overruns impede Angra 3. The result is a hybrid generation mix pairing intermittent renewables with flexible gas and emerging batteries to secure reliability.


By End User: C&I Segment Accelerates on Free Market Access
Regulated utilities held 52.28% of demand in 2025, yet the Commercial and Industrial slice of the Brazil power market is expanding at 13.72% CAGR after the 500 kW threshold opened competitive procurement. Data centers in São Paulo and Rio de Janeiro value 24/7 renewables backed by storage, while Pará mining houses hedge spot volatility through decade-long PPAs. Omega Energia and digital traders now intermediate bilateral deals that bypass utility mark-ups.
Residential demand grows modestly because rooftop solar offsets grid purchases, a dynamic that accelerates as net-metering grandfathering endures until 2045. Distributors lobby for higher fixed charges to recover stranded wires costs, yet any tariff escalation risks stimulating faster rooftop adoption, further eroding volumetric revenues.
Geography Analysis
Regional asymmetries shape the Brazil power market. The Northeast leads renewable build-out, supported by 50% wind capacity factors and BRL 12.4 billion in 2025 transmission concessions that evacuate power to the Southeast. Bahia and Ceará host multi-gigawatt wind clusters from Neoenergia and Engie Brasil, while Piauí solar farms exploit high irradiation near new lines.
The Southeast accounts for 50% of national consumption, with data centers and heavy industry driving C&I PPA demand. Petrobras’ Route 3 pipeline feeds two 400 MW peakers near Rio de Janeiro, bolstering peak reliability.
Hydro-dependent North faces capacity shocks when droughts cut river flows below operating minima, as seen in 2024 when Amazon dams ran at 10%. Distribution networks here lose up to 25% of dispatched energy, prompting targeted smart-grid pilots. Central-West emerges as a solar hotspot, leveraging land availability and proximity to agribusiness loads, while the South retains legacy coal and enjoys cross-border trade with Argentina and Uruguay during tight supply windows.
Regulatory Landscape
Brazil’s power sector is regulated primarily by ANEEL, with planning and policy led by the Ministry of Mines and Energy (MME) and long-term studies from EPE, while commercialization rules are implemented through the CCEE framework. ANEEL approved a 2025-2026 regulatory agenda with prioritized activities and, in October 2025, opened Public Consultation (CP) 031/2025 to develop the 2026 version of commercialization rules, following updates to rules and procedures under ANEEL Resolution 1.110/2024 for 2025. Tariff and network-charge administration continues through ANEEL instruments governing transmission revenues (RAP) and system usage tariffs (TUST/TUSDg), which directly influence project bankability for new generation and grid connections.
On system reliability, the Electric Sector Monitoring Committee (CMSE) approved the Agenda Estrategica Eletroenergetica 2026 on February 11, 2026, laying out 27 strategic actions focused on operational security measures such as ramp support and minimum load management. In planning, MME approved the Decennial Energy Expansion Plan PDE 2034 via Portaria 831/2025, embedding sector programs and legal frameworks (including hydrogen and gas-related initiatives) into the expansion pathway. In parallel, the federal government advanced guidelines in February 2026 for a Just Energy Transition roadmap to be submitted to CNPE, adding an additional policy anchor for investments tied to decarbonization and affordability objectives.
Competitive Landscape
Post-privatization, the Brazil power market shows moderate concentration with Eletrobras no longer dominant. Neoenergia, Enel Brasil, CPFL Energia, and Engie Brasil have earmarked a collective BRL 25.8 billion (USD 5.16 billion) for 2024-2025 renewables, transmission, and grid-digitalization projects. Vertical integration trends see distributors acquiring generation to hedge spot exposure, while independent traders aggregate C&I loads into bilateral blocks.
Technology adoption is a differentiator. ISA CTEEP’s 30 MW/60 MWh battery in São Paulo delivers frequency regulation today and positions the firm for ancillary service revenues post-2026 rule-making.[4]ISA CTEEP, “Battery Energy Storage Project Commissioned in São Paulo,” isacteep.com.br CPFL Energia uses AI for load forecasting, trimming outage durations by 15% in 2025. State Grid Brazil Holding deploys 800 kV HVDC lines that lower long-haul losses, while Omega Energia benefits from auction-free PPAs that capture C&I growth.
Brazil Power Industry Leaders
Centrais Elétricas Brasileiras S.A. (Eletrobrás)
Neoenergia SA
Enel Brasil SA
CPFL Energia SA
Engie Brasil Energia SA
- *Disclaimer: Major Players sorted in no particular order

Market Opportunities and Future Outlook
Grid-enabling investment and market-design changes are opening whitespace in flexibility, connections, and retail-market participation. The federal planning package around PDE 2034 highlights a large multi-year investment envelope for generation and network build-out (R$ 3.2 trillion cited for 2025-2034), while ANEEL and MME are actively adjusting the rulebook that governs how new capacity and consumers participate. In June 2026, MME published Ordinance No 135/2026 with guidelines for the A-1, A-2, and A-3 Existing Energy Auctions scheduled for November 2026, reinforcing procurement pathways for contracted supply and creating transactional opportunities for generators and traders with established portfolios.
Regulatory workstreams also point to near-term commercialization and tariff-model opportunities, particularly for distributed resources, storage, and load aggregation. Law No 15.269/2025 introduced legal frameworks that include energy storage and grid access elements, and Decree 12.772 established the National Policy for Access to the Transmission System (PNAST), shifting from first come, first served to competitive access seasons, which elevates the value of early, well-prepared interconnection strategies. On the demand side, ANEEL’s Public Consultation No 016/2026 (June 2026) on replacing an availability-based minimum allowance with a fixed monthly charge for low-voltage consumers signals ongoing tariff modernization, supporting business models around retail offers, virtual power plants, and services that reduce peak exposure. These changes sit alongside observed curtailment and congestion challenges and ongoing transmission expansion, positioning storage, grid-digitalization, and structured PPAs as practical routes to improve deliverability and price certainty for both generators and C&I buyers.
Recent Industry Developments
- July 2026: Neoenergia announced a BRL 13.8 billion investment plan to expand and modernize distribution networks in Pernambuco and Rio Grande do Norte through 2030. The program emphasizes grid reinforcement and modernization in two Northeast concessions where distributed resources and load growth put pressure on reliability. The scale of planned capex raises demand for automation, digital protection, and network services across the regulated distribution value chain.
- December 2025: Petrobras agreed to acquire a 49.99% stake in Lightsource bp's Brazilian subsidiaries, expanding its renewable development pipeline adjacent to Petrobras' gas-to-power and energy trading ambitions. It also intensifies competition for prime project sites and interconnection capacity in key regions.
- September 2024: Severe drought conditions reduced output at major hydro assets, with Belo Monte, Santo Antonio, and Jirau reported below 10% of capacity during the month, triggering higher thermal dispatch to protect system adequacy. The episode reinforced the system value of flexible generation and grid-operational tools that manage hydrological volatility. It also sharpened incentives for investment in transmission, storage, and demand-side flexibility to reduce reliability and cost shocks.


Research Methodology Framework and Report Scope
Market Definition and Coverage
This market is defined as Brazil's total electricity supply base measured by installed power capacity, covering grid connected plants and registered distributed generation that is officially tracked in the country.
Scope exclusions: Unregistered off-grid captive generation and small temporary diesel generator sets used at remote sites are excluded.
Segmentation Overview
- By Power Source
- Thermal (Coal, Natural Gas, Oil and Diesel)
- Nuclear
- Renewables (Solar, Wind, Hydro, Geothermal, Biomass & Waste, Tidal)
- By End User
- Utilities
- Commercial and Industrial
- Residential
- By T&D Voltage Level (Qualitative Analysis only)
- High-Voltage Transmission (Above 230 kV)
- Sub-Transmission (69 to 161 kV)
- Medium-Voltage Distribution (13.2 to 34.5 kV)
- Low-Voltage Distribution (Up to 1 kV)
Data Sources, Market Sizing, and Validation
Desk Research
Desk research started with public power system statistics to anchor the installed capacity base and the technology mix. We relied on sources such as ANEEL generation and distributed generation registries, ONS system planning and operation summaries, EPE energy balance and expansion planning documents, and IBGE macro indicators that help explain demand growth.
Next, the supply side picture was strengthened using project and tender disclosures from government portals, auction outcomes, and permitting updates, which support realistic commissioning timelines. Company filings, investor presentations, and reputable press were also used to cross check announced capacity additions, retirements, and grid connection milestones. Where needed, paid subscriptions that track company financials and intelligence, news and financials, patent databases, and global contracts and tenders were used to validate ownership changes and project status. The desk sources listed here are illustrative only, and many other public references were used for data collection, validation, and clarification.
Primary Interviews and Surveys
Primary work was used to confirm what is actually getting built and connected, because announced capacity does not always translate into commissioned capacity on time. We spoke with a mix of utilities, developers, equipment and service ecosystem participants, and large buyers, and then used their inputs to tighten assumptions on build schedules, retirements, and distributed generation registration trends across Brazil.
Distribution of primary research fieldwork respondents
| Company type | Respondent position | Region |
|---|---|---|
| Top tier: 33% | CXOs: 15% | |
| Mid tier: 47% | Functional/Unit leaders: 34% | |
| Smaller Players: 20% | Managers: 51% |
Market-Sizing & Forecasting
Sizing was built by reconstructing Brazil's installed capacity pool from official registries and system operator reporting, and then rolling it forward year by year using additions and retirements by technology. The top-down approach was applied by starting with the national installed capacity totals and splitting them by power source based on published plant level and program level disclosures, which are then checked using selective bottom-up roll ups from known project pipelines.
Key inputs used in the model include commissioning timelines for hydropower, wind, solar and thermal projects, retirement and repowering expectations for older thermal units, the pace of registered distributed generation connections, auction and contracting volumes that indicate future build intent, and grid availability signals that can delay actual energization. Forecasts were produced using scenario analysis, because expansion depends heavily on permitting, transmission readiness, and policy stability, and the final path was aligned to what experts considered the most likely schedule. When project level details were missing, gaps were handled using technology specific average lead times and observed historical slippage rates, and then rechecked through interviews before totals were finalized.
Data Validation & Update Cycle
Outputs were validated through multiple checks so the capacity totals stay consistent with independent signals. We compared results against official aggregates, technology mix shares, and year on year changes that should match known commissioning waves and retirement events, and then investigated any unusual jumps before sign off.
A second analyst review was carried out to confirm that assumptions, units, and conversions are consistent across the full time series, and re-contact was triggered when a major project status looked unclear or conflicting across sources. Reports are refreshed annually, and interim updates are made when there are material events such as large auctions, regulatory changes affecting distributed generation, or big plant additions and closures. Before delivery, an analyst performs a final pass to ensure clients receive the latest updated view.
Mordor Intelligence's Brazil Power Market Estimate Compared With Other Published Estimates
Published estimates for Brazil power often diverge because some sources size the market in capacity terms, while others present a revenue style value that bundles different parts of the electricity chain. Differences also come from which assets are counted, the year chosen as a base, and how quickly the underlying project pipeline assumptions are refreshed.
Unregistered off-grid captive generation sits outside Mordor Intelligence's scope, and that creates a noticeable spread versus estimates that loosely include behind-the-fence industrial self-generation or broader power sector revenues. Gaps also appear when one publisher uses a faster distributed generation ramp, applies aggressive commissioning timing for wind and solar projects, or mixes regulated and free market activity without clearly separating installed capacity from sales value.
Benchmark comparison
| Source | Market Size | Gaps in Research Methodology |
|---|---|---|
| Mordor Intelligence | USD 282.34 B (2026) | |
| Industry Publisher A | USD 3.40 B (2024) | Uses a value-based definition and can combine generation, transmission, and distribution economics, so the figure is not comparable to an installed-capacity style market size and can shift with tariff and currency timing. |
| Industry Publisher B | USD 253.50 B (2025) | Counts installed capacity but appears to project a faster ramp for additions through the forecast window, which can happen when permitting, grid connection constraints, and typical schedule slippages are not stress tested. |
The table shows that the biggest gap is not only the year used, but also whether the market is treated as capacity or as an economic value pool that includes other parts of the electricity system. By keeping inputs tied to traceable capacity signals like registrations, commissioning schedules, and retirements, the final estimate stays repeatable and easier to reconcile with what is happening on the ground.


Key Questions Answered in the Report
How large is the Brazil power market in 2026?
Installed capacity totals 282.34 GW in 2026, and the Brazil power market size is forecast at 350.54 GW by 2031.
What is driving the fastest growth in Brazil’s generation mix?
Wind and solar dominate additions due to favorable capacity factors, clear auction rules, and the Long-Term Expansion Plan 2032 that targets an 83% renewable share by 2031.
Why is the Commercial and Industrial segment expanding so quickly?
MME Ordinance 50/2022 lets consumers above 500 kW buy directly from generators, so data centers and miners sign PPAs to secure clean power and predictable prices.
How are transmission investments addressing renewable curtailment?
ANEEL’s 2025 auction awarded 3,500 km of new high-voltage lines that link Northeast wind corridors to Southeast load centers, reducing 2024 curtailments of 2 GW.
What role will natural gas play through 2031?
Pre-salt associated gas feeds new peaker plants that provide flexible backup for intermittent renewables, lowering reliance on imported LNG and stabilizing evening peaks.
Page last updated on:


