Cold-Chain Qualification And Lane Mapping Services Market Size and Share
Market Overview
| Study Period | 2020 - 2031 |
|---|---|
| Market Size (2026) | USD 1.56 Billion |
| Market Size (2031) | USD 2.41 Billion |
| Growth Rate (2026 - 2031) | 9.07% CAGR |
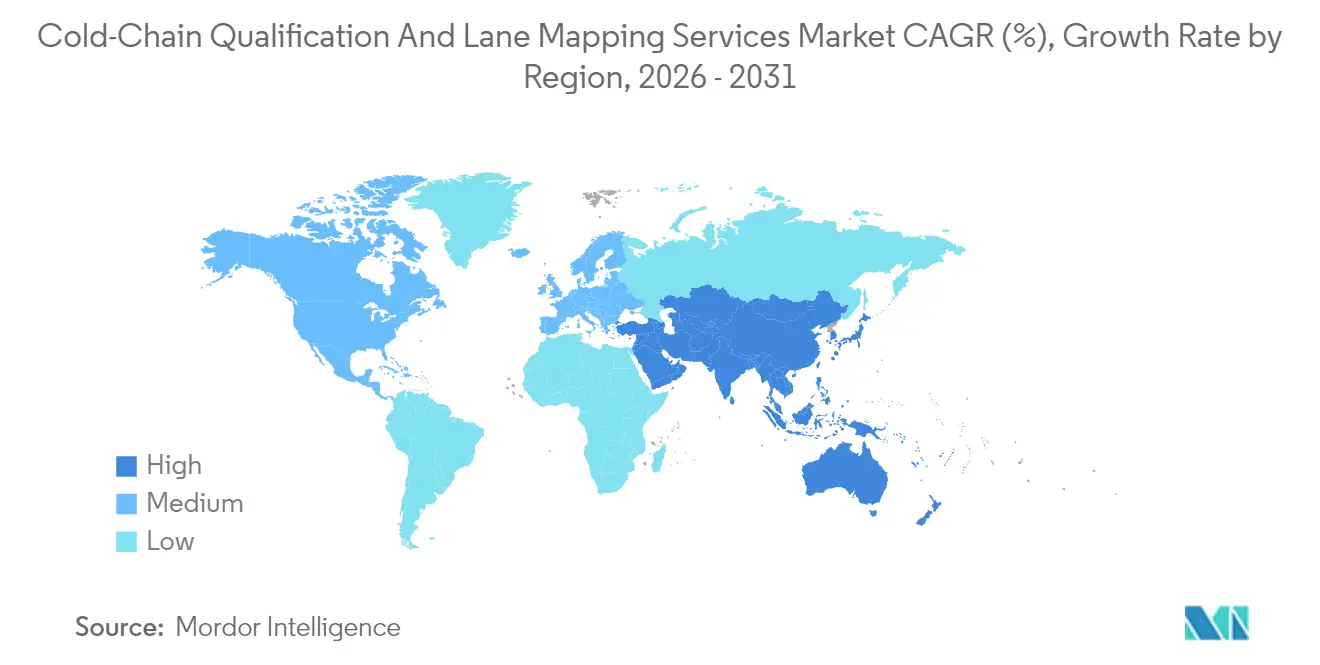
| Fastest Growing Market | Asia Pacific |
| Largest Market | North America |
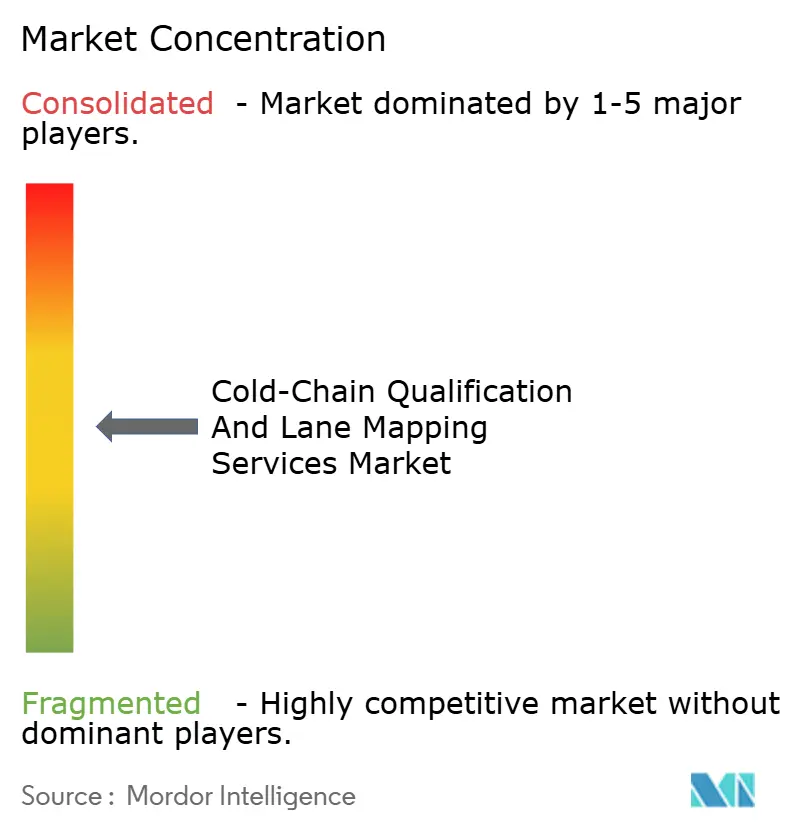
| Market Concentration | Medium |
Major Players *Disclaimer: Major Players sorted in no particular order Image © Mordor Intelligence. Reuse requires attribution under CC BY 4.0. | |
Cold-Chain Qualification And Lane Mapping Services Market Analysis by Mordor Intelligence
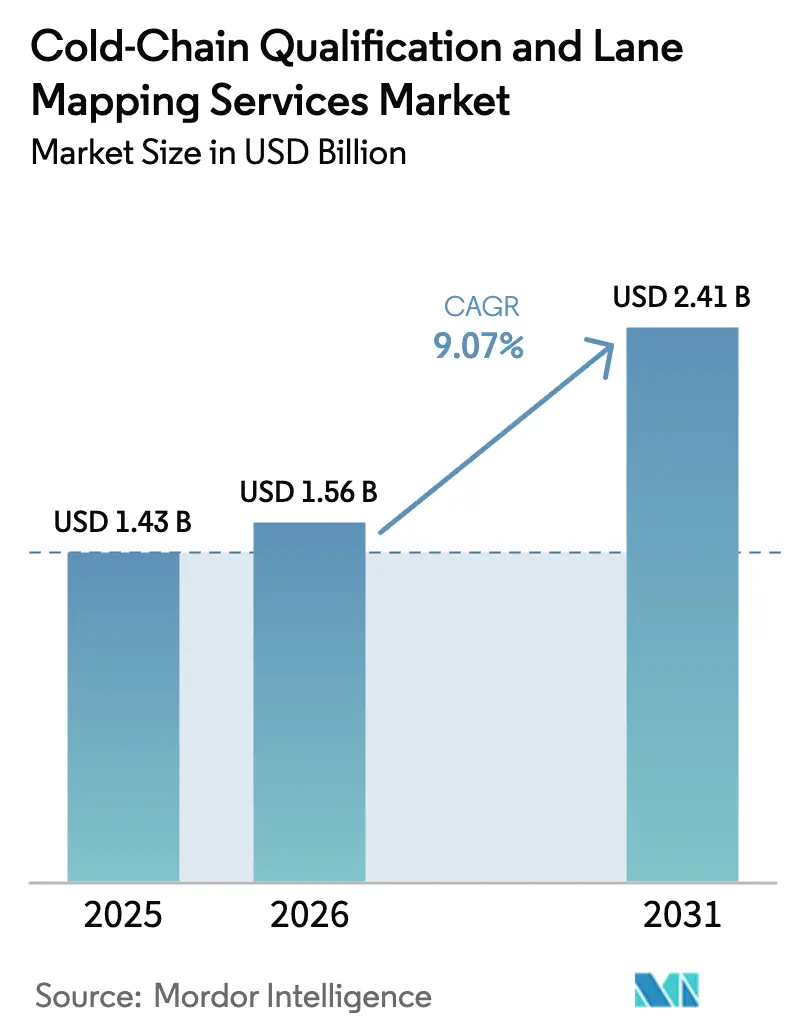
The Cold-Chain Qualification and Lane Mapping Services market size is expected to grow from USD 1.43 billion in 2025 to USD 1.56 billion in 2026 and is forecast to reach USD 2.41 billion by 2031 at 9.07% CAGR over 2026-2031. This sustained expansion is driven by the growing share of temperature-sensitive biologics, stricter Good Distribution Practice (GDP) enforcement, and the rapid digitalization of lane-risk analytics. The growing demand for ultra-low temperature services linked to cell and gene therapies refocuses qualification budgets toward cryogenic equipment validation. Airlines, ports, and third-party logistics providers (3PLs) are accelerating the adoption of predictive intelligence to reduce excursion rates, while sustainability regulations drive modal shifts and container redesigns. The Cold-Chain Qualification and Lane Mapping Services market is also shaped by workforce constraints, prompting vendors to embed no-code validation tools that let fewer engineers qualify more lanes. Finally, regulatory bodies now recognize digital twins as valid supportive evidence, compressing physical mapping cycles and opening new advisory revenue streams.
Key Report Takeaways
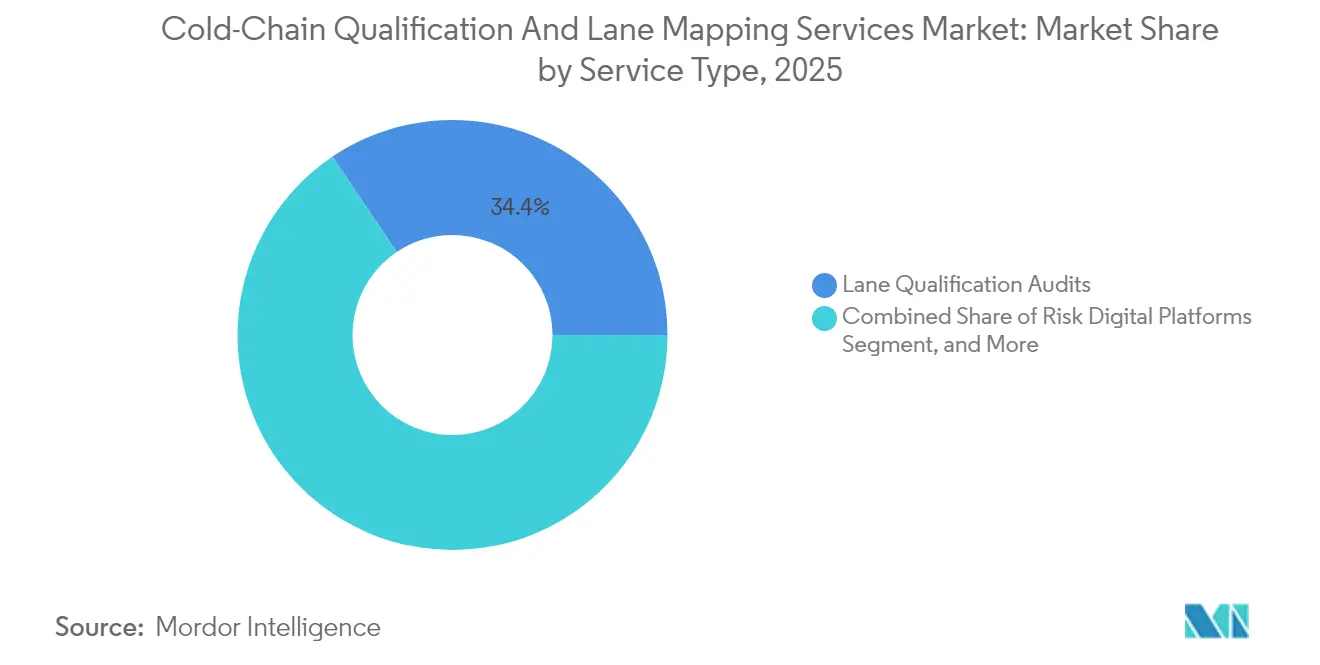
- By service type, Lane Qualification Audits captured 34.42% of the Cold-Chain Qualification and Lane Mapping Services market share in 2025.
- By temperature range, the Cold-Chain Qualification and Lane Mapping Services Market size for ultra-low/cryogenic services is projected to grow at a 10.62% CAGR between 2026–2031.
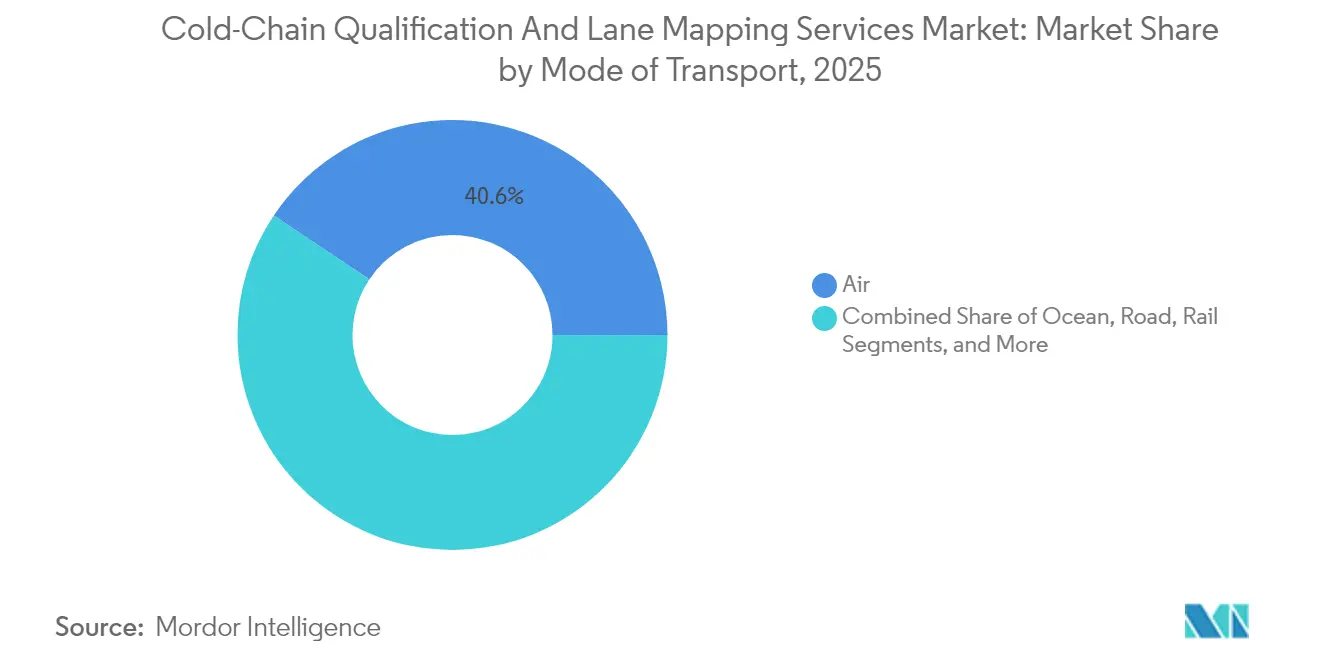
- By mode of transport, air captured 40.62% of the Cold-Chain Qualification and Lane Mapping Services market share in 2025.
- By end-use industry, the Cold-Chain Qualification and Lane Mapping Services Market size for pharmaceuticals is projected to grow at a 10.71% CAGR between 2026–2031.
- By geography, North America captured 32.35% of the Cold-Chain Qualification and Lane Mapping Services market share in 2025.
Note: Market size and forecast figures in this report are generated using Mordor Intelligence’s proprietary estimation framework, updated with the latest available data and insights as of 2026.
Global Cold-Chain Qualification And Lane Mapping Services Market Trends and Insights
Drivers Impact Analysis*
| Driver | (~) % Impact on CAGR Forecast | Geographic Relevance | Impact Timeline |
|---|---|---|---|
| Rapid biologics pipeline expansion | +2.1% | Global, concentrated in North America and Europe | Medium term (2-4 years) |
| AI-enabled lane-risk analytics adoption | +2.3% | North America and Europe early adoption, APAC follow | Long term (≥ 4 years) |
| Rising GDP and GXP audit frequency | +1.8% | Global, emphasis on Asia-Pacific alignment | Short term (≤ 2 years) |
| Sustainability mandates for CO₂-efficient lanes | +1.4% | Europe leading, North America and APAC accelerating | Long term (≥ 4 years) |
| Growing CEIV-Pharma and GDP lane certification programs | +1.5% | Global, led by IATA members | Medium term (2-4 years) |
| Demand for digital twins and simulation | +1.9% | Global, tech centers in developed markets | Medium term (2-4 years) |
| Source: Mordor Intelligence | |||
Rapid Biologics Pipeline Expansion
Monoclonal antibodies, RNA therapeutics, and personalized cell therapies multiply lane-qualification needs across new temperature bands. Biologics already account for 35% of all drug shipments, and their share is set to reach 50% by 2030, pushing shippers to validate both refrigerated and cryogenic corridors for every major trade lane. Frequent protocol updates on stability and hold-time pull-through mapping demand beyond launch phases. Biopharma clusters in Ireland, Singapore, and North Carolina add capacity faster than the growth of validation talent, forcing outsourcing to specialized service firms. Original equipment manufacturers (OEMs) respond by bundling hardware with turnkey qualification kits to shorten time-to-market. Combined, these factors lift baseline spend on the Cold-Chain Qualification and Lane Mapping Services market, as every new biologic requires a qualified lane roster before commercial release.
AI-Enabled Lane-Risk Analytics Adoption
Artificial intelligence converts historical excursion records, meteorological feeds, and live sensor data into predictive quality scores, allowing shippers to preempt exposure risk rather than react to temperature alarms. Platforms such as SkyMind and elproPREDICT have documented zero product loss records across hundreds of millions of vaccine doses through automated routing and real-time escalation workflows. Validation teams now submit algorithmic risk profiles as part of GDP evidence, and regulators increasingly accept these datasets when human oversight is documented. Vendors monetize subscription-based dashboards, digital SOP libraries, and audit trails, adding sticky recurring revenue to the Cold-Chain Qualification and Lane Mapping Services market. Early adopters also report a 30% reduction in lane-mapping cycles because AI narrows the number of physical tests required for full qualification.
Rising GDP and GXP Audit Frequency
Updated WHO guidelines and the expanded United States Pharmacopeia <1079> series recommend risk-based mapping of critical corridors every two years, rather than the five-year cycles common a decade ago.[1]World Health Organization, “WHO Technical Report Series No. 1019,” who.int In the Asia-Pacific region, health authorities now tie manufacturing site approvals to demonstrable compliance of downstream transport lanes, triggering repeat audits for any routing change. Airlines and 3PLs consequently establish dedicated GDP desks and subscribe to centralized certificate repositories to prevent downtime due to recertification. The faster cadence lifts baseline demand for both traditional IQ-OQ-PQ studies and their digital-twin equivalents, directly driving revenue growth for the Cold-Chain Qualification and Lane Mapping Services market.
Sustainability Mandates for CO₂-Efficient Lanes
The European Union’s F-gas Regulation (EU) 2024/573 phases out high-GWP refrigerants, forcing logistic firms to requalify containers that switch to alternative coolants by 2028. MIT modeling indicates that modal shifts, combined with reusable active containers, can reduce pharmaceutical freight emissions by up to 90%. Shippers recalibrate lane-mapping projects to prove both quality compliance and emissions reduction, often bundling the two into a single procurement. Vendors capable of quantifying carbon savings during qualification gain a pricing premium and first-mover advantage as life-science boards formalize net-zero roadmaps. This trend encourages wider adoption of ocean corridors and hybrid truck-rail services, each requiring fresh validation, expanding the Cold-Chain Qualification and Lane Mapping Services market further.
Restraints Impact Analysis*
| Restraint | (~) % Impact on CAGR Forecast | Geographic Relevance | Impact Timeline |
|---|---|---|---|
| Scarcity of skilled validation engineers | -1.2% | Global, acute in Asia-Pacific and emerging markets | Short term (≤ 2 years) |
| Fragmented regulatory standards across borders | -0.8% | Global, complicates cross-border lanes | Medium term (2-4 years) |
| High Data-Integration/ Interoperability Barriers | -0.9% | Global, concentrated in multi-vendor environments | Medium term (2-4 years) |
| Rising Lithium-Battery Restrictions on IoT Loggers | -0.6% | Global, with varying aviation authority interpretations | Short term (≤ 2 years) |
| Source: Mordor Intelligence | |||
Scarcity of Skilled Validation Engineers
Global demand for QA-QC professionals versed in advanced mapping protocols now exceeds supply. Emerging biopharma hubs in India and Malaysia frequently experience double-digit vacancy rates, which inflate contractor costs and stretch project timelines. Many validation specialists lack exposure to AI-driven tools, which slows enterprise adoption despite the clear ROI. Industry groups respond with micro-credential courses; yet, capacity shortfalls will likely persist through 2027, capping how quickly new corridors can be qualified and tempering the near-term expansion of the Cold-Chain Qualification and Lane Mapping Services market.
Fragmented Regulatory Standards Across Borders
Divergent national GDP annexes still force firms to run additional tests when a lane crosses jurisdictions. OECD studies confirm that inconsistent electronic certificates and temperature excursion thresholds increase transaction costs and prolong market entry by several months. Carriers must therefore maintain multiple, sometimes conflicting, SOP sets, undercutting scale benefits and discouraging smaller players from entering multi-region routes. Although IATA’s CEIV Pharma scheme attempts to harmonize requirements, varying enforcement stances keep fragmentation alive, slightly dampening the true growth potential of the Cold-Chain Qualification and Lane Mapping Services market.
*Our forecasts treat driver/restraint impacts as directional, not additive. The impact forecasts reflect baseline growth, mix effects, and variable interactions.
Segment Analysis
By Service Type: Digital Platforms Scale Predictive Validation
Lane Qualification Audits controlled a 34.42% share of 2025 revenue and remain the baseline procurement for new drug launches. The Cold-Chain Qualification and Lane Mapping Services market size linked to these audits benefits from the mandated IQ-OQ-PQ structure that regulators worldwide still reference. However, Risk Digital Platforms expand at an 11.10% CAGR and increasingly bundle audit templates, real-time sensor feeds, and automated report builders in one subscription. This blend allows smaller shippers to remain compliant without maintaining large in-house QA teams. As the tools ingest more lane data, audit intervals shorten, and corrective actions shift from reactive to predictive.
Simulation consulting and temperature-mapping services complement both traditional and digital offerings, maintaining high utilization across peak and trough cycles. Vendors like ELPRO and SmartCAE co-develop modules that utilize a single data lake to power both validation evidence and machine-learning models. The Cold-Chain Qualification and Lane Mapping Services market, therefore, sees converging revenue streams, with service providers capitalizing on cross-selling between hardware loggers, cloud analytics, and audit preparation packs. As subscription penetration rises, share gains accrue to firms that can align digital dashboards with regulator-approved terminology, preserving audit acceptability while slashing manual paperwork.


By Temperature Range: Cryogenic Corridors Outpace Conventional Cold Chain
Refrigerated lanes at 2-8 °C captured the largest slice of the Cold-Chain Qualification and Lane Mapping Services market share in 2025 at 38.31%, driven by mature vaccine and insulin flows. Frozen lanes continue steady uptake among certain specialty APIs, but ultra-low corridors from −70 °C to −196 °C register the fastest 10.62% CAGR as gene therapy commercialization accelerates. The Cold-Chain Qualification and Lane Mapping Services market size, tied to cryogenic validation, therefore rises faster than the overall average.
Regulatory pressure adds urgency, since EU rules grant mechanical cryogenic freezers only a four-year exemption before low-GWP refrigerants become mandatory. [2]European Commission, “Commission Implementing Regulation (EU) 2024/3120,” eur-lex.europa.eu Shippers consequently budget for dual qualification tracks: one for legacy equipment and another for upgraded freezers. Vendors able to certify both container and refrigerant performance capture a premium. These dynamics position ultra-low services as the next competitive battleground, expanding vendor portfolios and reinforcing long-term demand for the Cold-Chain Qualification and Lane Mapping Services market.
By Mode of Transport: Ocean Corridors Reinvent Long-Haul Distribution
Air freight maintained a 40.62% share of the 2025 spend due to its unrivaled speed and broad CEIV Pharma coverage among top airlines. Yet ocean corridors post an 11.46% CAGR as shippers pursue emissions targets and cost reductions. The Cold-Chain Qualification and Lane Mapping Services market size is closely tied to maritime lanes, as each route requires extended stability studies, vibration analysis, and contingency mapping.
Academic research confirms that optimized container selection can cut lane emissions by up to 90% compared with air routes. Carriers deploy active containers with multi-day hold times and secure exemptions for always-on trackers following ICAO’s 2024 battery-guideline revision. Each technological upgrade triggers fresh qualification, expanding the Cold-Chain Qualification and Lane Mapping Services market and rewarding providers who master both maritime humidity profiles and longer risk horizons.
By End-Use Industry: Traditional Pharmaceuticals Catch Up Digitally
Biologics and vaccines represented 46.33% of 2025 revenue and continue to anchor the Cold-Chain Qualification and Lane Mapping Services market. Small-molecule pharmaceuticals, however, show the sharpest 10.71% CAGR as regulators extend GDP expectations to products once shipped in ambient conditions. The shift enlarges the Cold-Chain Qualification and Lane Mapping Services market size for lane-mapping specialists focused on oral drugs, oncology injectables, and hormonal therapies.
Pipeline diversification also encompasses diagnostics, research reagents, and novel excipients, broadening the addressable client base. As more commerce flows through e-commerce channels, even over-the-counter medicines add temperature monitors, requiring last-mile validation previously reserved for high-value biologics. The widened compliance net expands the serviceable opportunity without cannibalizing biologic spend, thereby maintaining the overall Cold-Chain Qualification and Lane Mapping Services market on a robust trajectory.
Geography Analysis
North America accounted for 32.35% of 2025 revenue, underpinned by FDA audits and a dense network of GDP-certified 3PL facilities. The region sees stable top-line growth as major biologics makers triple-source risk pathways and airports roll out dedicated pharma corridors. State-level incentives for biotech manufacturing in Texas and Massachusetts feed further lane-qualification demand.
Europe remains the second-largest contributor, propelled by stringent EU F-gas deadlines that force container redesigns and requalification. The Cold-Chain Qualification and Lane Mapping Services market benefits from the continent’s early adoption of eco-metrics within tender documents, which embeds carbon reporting into the qualification scope. Airlines and forwarders differentiate by presenting simultaneous quality and emissions dashboards to shippers.
Asia-Pacific records the highest 11.31% CAGR through 2031 as governments harmonize GDP rules and build regional vaccine stockpiles. Multinationals accelerate investment in Singapore, South Korea, and India, each insisting on site-specific lane validation before the first commercial lot. Consortia of airports and carriers are now pursuing joint CEIV Pharma status to streamline audits, which in turn increases the market share captured by advisory vendors specializing in multi-stakeholder projects for Cold-Chain Qualification and Lane Mapping Services. However, fragmented documentation standards across the Association of Southeast Asian Nations (ASEAN) prolong some cross-border approvals, highlighting ongoing restraint pressure.

Competitive Landscape
The market structure is moderately fragmented, with the top ten providers accounting for approximately 45% of the global revenue. Sensitech’s acquisition of Berlinger in August 2024 merged hardware loggers with validation consulting, setting a precedent for vertical integration. ELPRO, Tive, and Berlinger continue to invest in cloud dashboards that offer instant certificate downloads and anomaly heat maps to auditors, reinforcing customer lock-in.
Digital-native challengers, such as SmartCAE, leverage AI to reduce mapping cycle times by 40%, undercutting traditional auditors and capturing market share among startups. Meanwhile, incumbents counter through strategic alliances: Envirotainer integrated va-Q-tec’s passive technology in September 2024 to offer a full portfolio from parcel to pallet. Airlines, led by Swiss WorldCargo, view recurring CEIV recertifications as a form of brand equity, thereby cementing service-provider partnerships to maintain compliant lanes.
Capital infusion into healthcare logistics accelerates consolidation. DHL earmarked EUR 2 billion (USD 2.14 billion) through 2030 to expand GDP hubs, while UPS acquired Andlauer and announced the purchase of Frigo-Trans in 2025.[3]DHL Group, “Transforming Florstadt into a European Pharmaceutical Hub,” group.dhl.com These moves shift bargaining power toward carriers holding integrated validation capabilities, compelling niche consultants to specialize further or join larger platforms. The Cold-Chain Qualification and Lane Mapping Services market therefore evolves toward ecosystem plays that bundle sensors, analytics, and audit preparation in one contract, squeezing low-value commoditized mapping outfits.
Cold-Chain Qualification And Lane Mapping Services Industry Leaders
SmartCAE GmbH & Co. KG
Sensitech Inc.
ELPRO-BUCHS AG
Berlinger & Co. AG
Tive Inc.
- *Disclaimer: Major Players sorted in no particular order

Recent Industry Developments
- May 2025: DHL Group confirmed a EUR 2 billion (USD 2.14 billion) investment to transform its Florstadt campus into a large multi-temperature pharmaceutical hub with GMP-compliant clean rooms.
- April 2025: UPS completed its purchase of North America-based Andlauer Healthcare Group, while DHL Group acquired 100% of pharma courier CRYOPDP from Cryoport for USD 195 million to strengthen clinical-trial logistics.
- March 2025: FedEx launched its Surround monitoring platform across more than 40 countries, combining advanced sensors with AI dashboards for continuous shipment oversight.
- January 2025: UPS announced the pending acquisition of European cold-chain specialist Frigo-Trans and sister company BPL, expanding temperature-controlled warehousing and transportation capabilities for pharmaceutical and biotech companies.


Global Cold-Chain Qualification And Lane Mapping Services Market Report Scope
| Lane Qualification Audits |
| Risk Digital Platforms |
| Temperature-Mapping Services |
| Simulation and Digital Twin Consulting |
| Controlled Room Temperature |
| Refrigerated |
| Frozen |
| Ultra-Low / Cryogenic |
| Air |
| Ocean |
| Road |
| Rail |
| Pharmaceuticals |
| Biologics and Vaccines |
| Food and Beverages |
| Other End-use Industries |
| North America | United States | |
| Canada | ||
| Mexico | ||
| South America | Brazil | |
| Argentina | ||
| Chile | ||
| Rest of South America | ||
| Europe | United Kingdom | |
| Germany | ||
| France | ||
| Italy | ||
| Spain | ||
| Russia | ||
| Rest of Europe | ||
| Asia-Pacific | China | |
| India | ||
| Japan | ||
| South Korea | ||
| Australia | ||
| Rest of Asia-Pacific | ||
| Middle East and Africa | Middle East | Saudi Arabia |
| United Arab Emirates | ||
| Turkey | ||
| Rest of Middle East | ||
| Africa | South Africa | |
| Nigeria | ||
| Rest of Africa | ||
| By Service Type | Lane Qualification Audits | ||
| Risk Digital Platforms | |||
| Temperature-Mapping Services | |||
| Simulation and Digital Twin Consulting | |||
| By Temperature Range | Controlled Room Temperature | ||
| Refrigerated | |||
| Frozen | |||
| Ultra-Low / Cryogenic | |||
| By Mode of Transport | Air | ||
| Ocean | |||
| Road | |||
| Rail | |||
| By End-use Industry | Pharmaceuticals | ||
| Biologics and Vaccines | |||
| Food and Beverages | |||
| Other End-use Industries | |||
| By Geography | North America | United States | |
| Canada | |||
| Mexico | |||
| South America | Brazil | ||
| Argentina | |||
| Chile | |||
| Rest of South America | |||
| Europe | United Kingdom | ||
| Germany | |||
| France | |||
| Italy | |||
| Spain | |||
| Russia | |||
| Rest of Europe | |||
| Asia-Pacific | China | ||
| India | |||
| Japan | |||
| South Korea | |||
| Australia | |||
| Rest of Asia-Pacific | |||
| Middle East and Africa | Middle East | Saudi Arabia | |
| United Arab Emirates | |||
| Turkey | |||
| Rest of Middle East | |||
| Africa | South Africa | ||
| Nigeria | |||
| Rest of Africa | |||


Key Questions Answered in the Report
What is the projected value of the Cold-Chain Qualification and Lane Mapping Services market in 2031?
The market is forecast to reach USD 2.41 billion by 2031.
Which region shows the fastest growth rate through 2031?
Asia-Pacific is expected to grow at an 11.31% CAGR, the highest among all regions.
Which service segment is expanding the quickest?
Risk Digital Platforms post the fastest growth with an 11.10% CAGR between 2026 and 2031.
How do sustainability mandates influence transport mode selection?
Regulations favor ocean corridors and reusable active containers, which can cut lane emissions by up to 90% compared with air routes.
Why are ultra-low temperature services gaining momentum?
The commercialization of cell and gene therapies requires temperatures ranging from −70 °C to −196 °C, driving a 10.62% CAGR for cryogenic lane qualifications.
What challenge limits near-term capacity expansion?
A shortage of skilled validation engineers, particularly in emerging markets, extends project timelines and increases costs.
Page last updated on:


