Clear Aligners Market Size and Share
Market Overview
| Study Period | 2020 - 2031 |
|---|---|
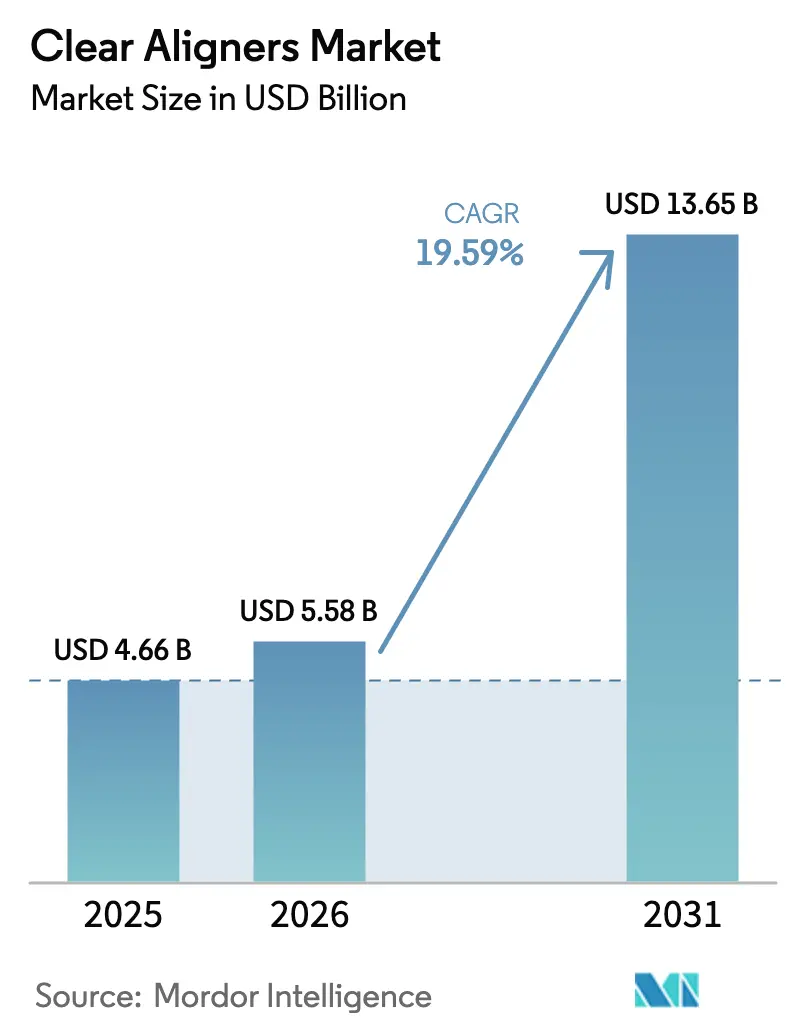
| Market Size (2026) | USD 5.58 Billion |
| Market Size (2031) | USD 13.65 Billion |
| Growth Rate (2026 - 2031) | 19.59% CAGR |
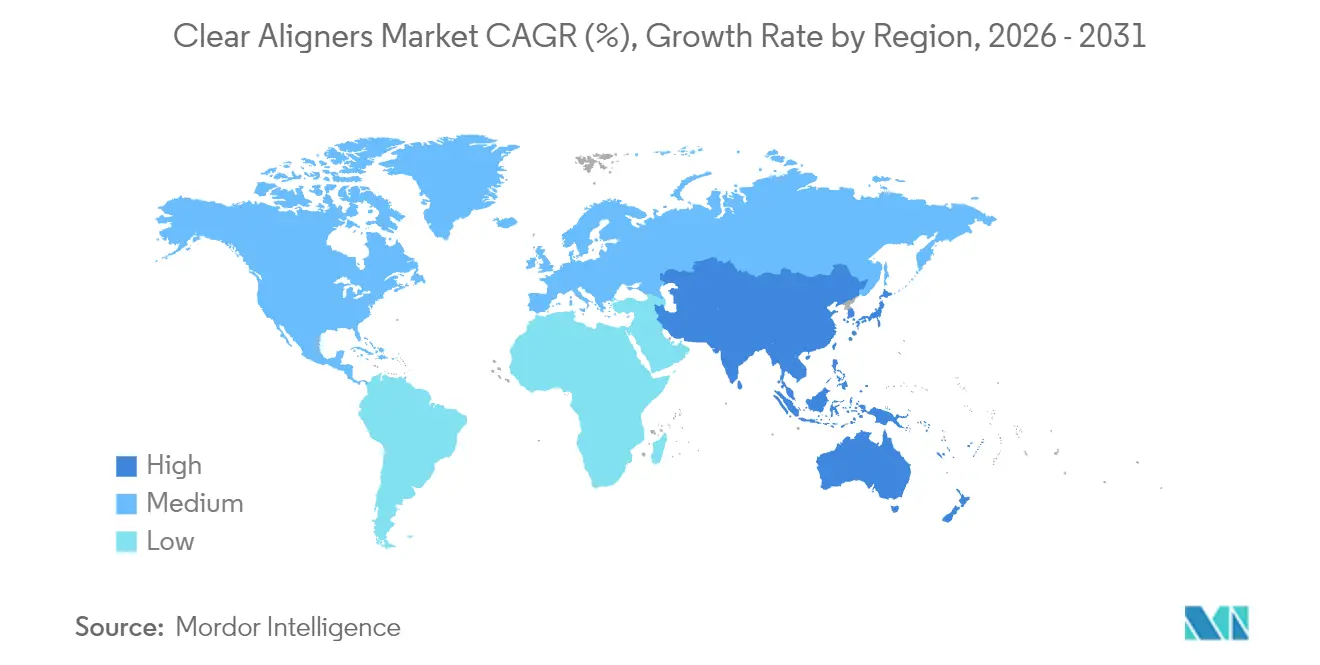
| Fastest Growing Market | Asia-Pacific |
| Largest Market | North America |
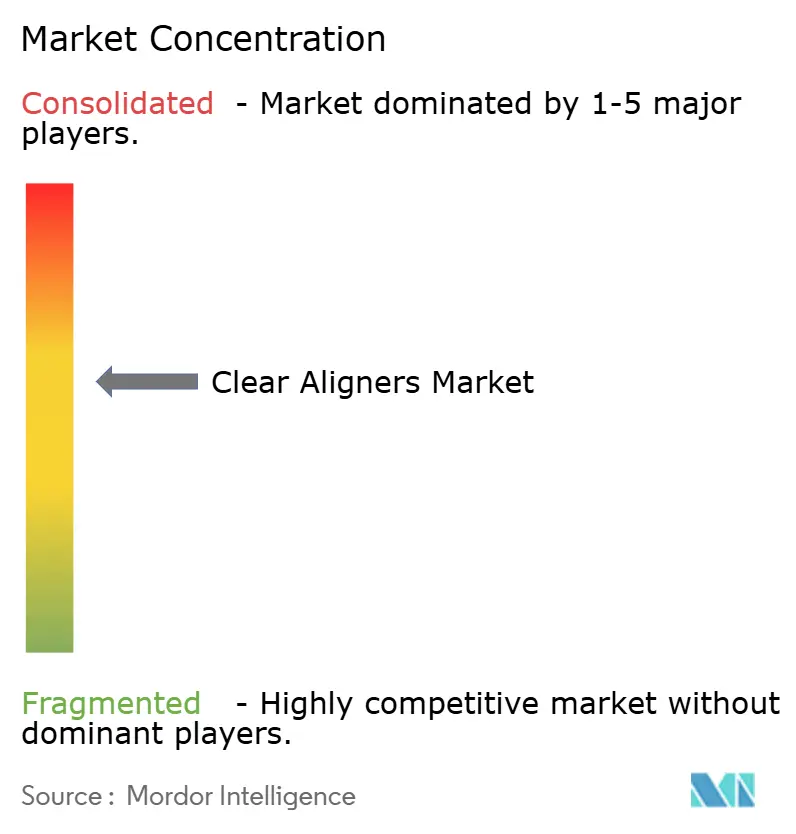
| Market Concentration | Medium |
Major Players *Disclaimer: Major Players sorted in no particular order Image © Mordor Intelligence. Reuse requires attribution under CC BY 4.0. | |
Clear Aligners Market Analysis by Mordor Intelligence
The Clear Aligners Market size was valued at USD 4.66 billion in 2025 and is estimated to grow from USD 5.58 billion in 2026 to reach USD 13.65 billion by 2031, at a CAGR of 19.59% during the forecast period (2026-2031).
This market size growth reflects consumers’ rising aesthetic expectations, insurers’ broader reimbursement policies, and the maturity of direct-to-consumer (DTC) platforms. Premium positioning continues to win share in North America, even as Asia Pacific outpaces every other region on the back of significant unmet needs and rapid infrastructure upgrades. Digital workflows, especially chair-side 3D printing, shorten treatment cycles and tighten the feedback loop between orthodontist and patient, reinforcing adoption. At the same time, new biocompatible materials and environmental regulations are reshaping product development priorities, while private-equity-backed consolidation raises competitive intensity and accelerates roll-outs across dental service organizations (DSOs).
Key Report Takeaways
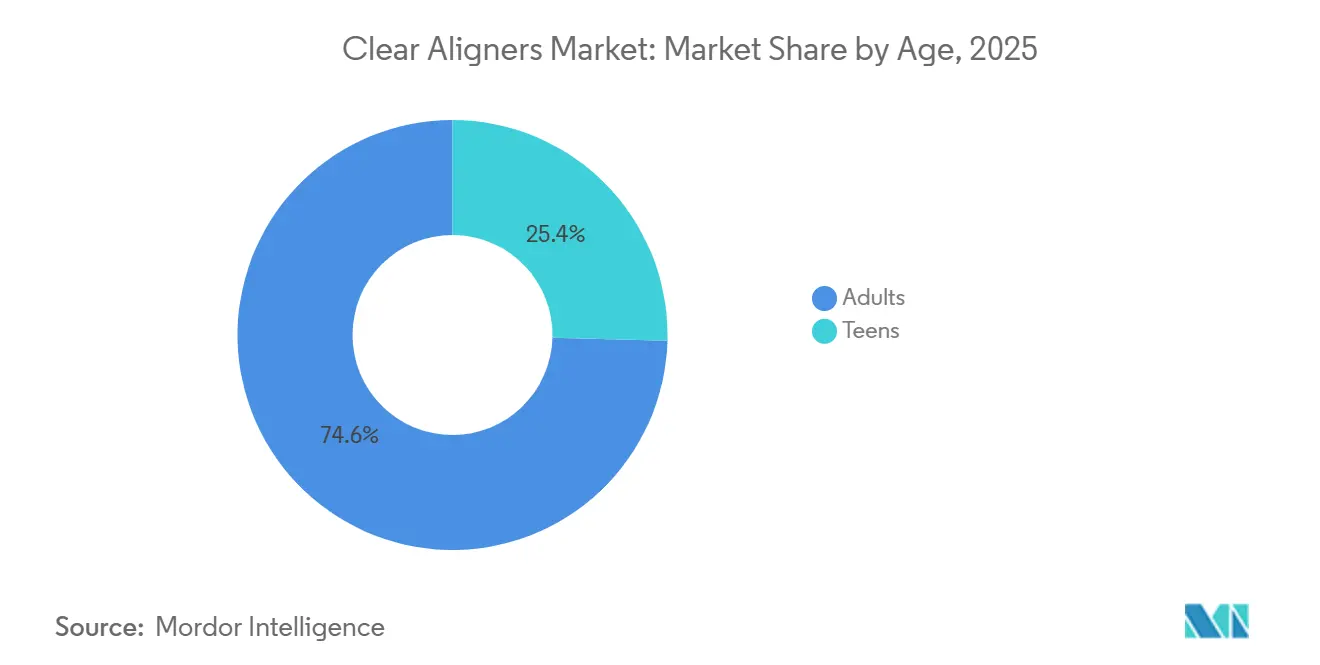
- By age, adults held 74.58% of the clear aligners market share in 2025, while teens are projected to advance at a 21.58% CAGR through 2031.
- By manufacturing workflow, centralized lab production accounted for 79.55% of the clear aligners market in 2025, whereas in-office 3D-printed aligners are expected to grow at a 22.05% CAGR through 2031.
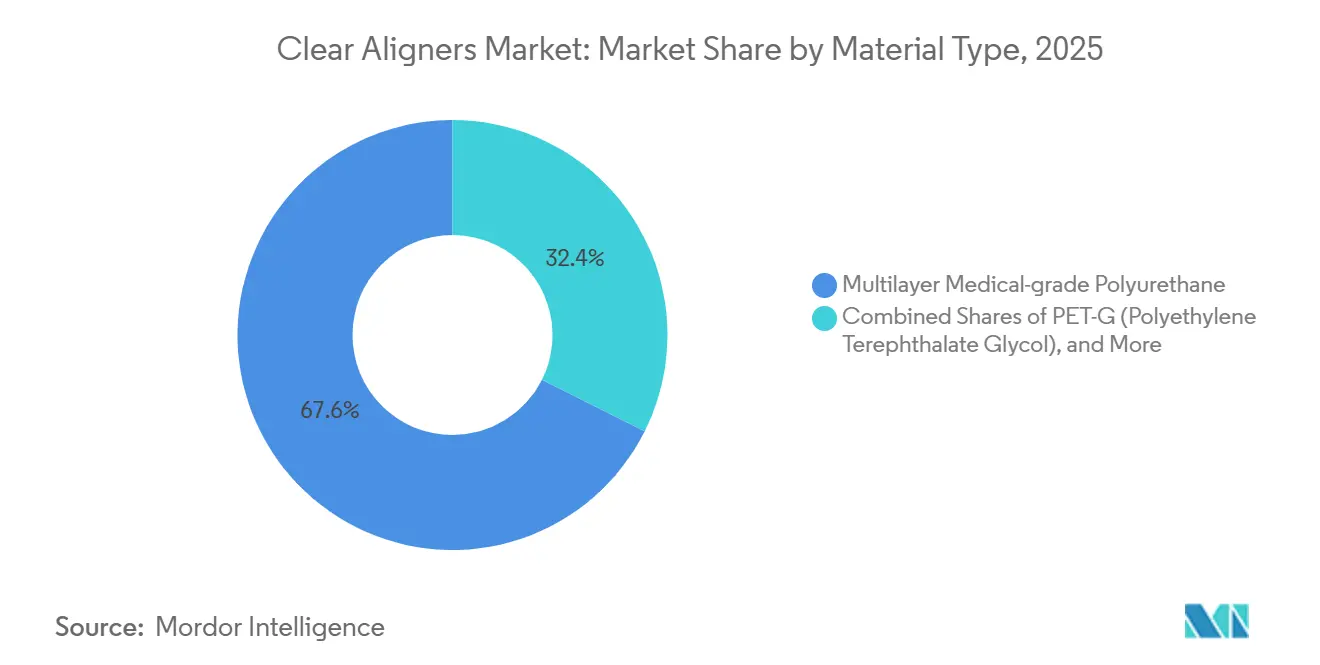
- By material, polyurethane captured 67.62% of the clear aligners market size in 2025; PET-G is slated to accelerate at a 21.92% CAGR between 2026 and 2031.
- By end user, hospitals represented 21.35% CAGR growth potential between 2026 and 2031, compared with stand-alone practices, which accounted for 61.40% of 2025 revenue.
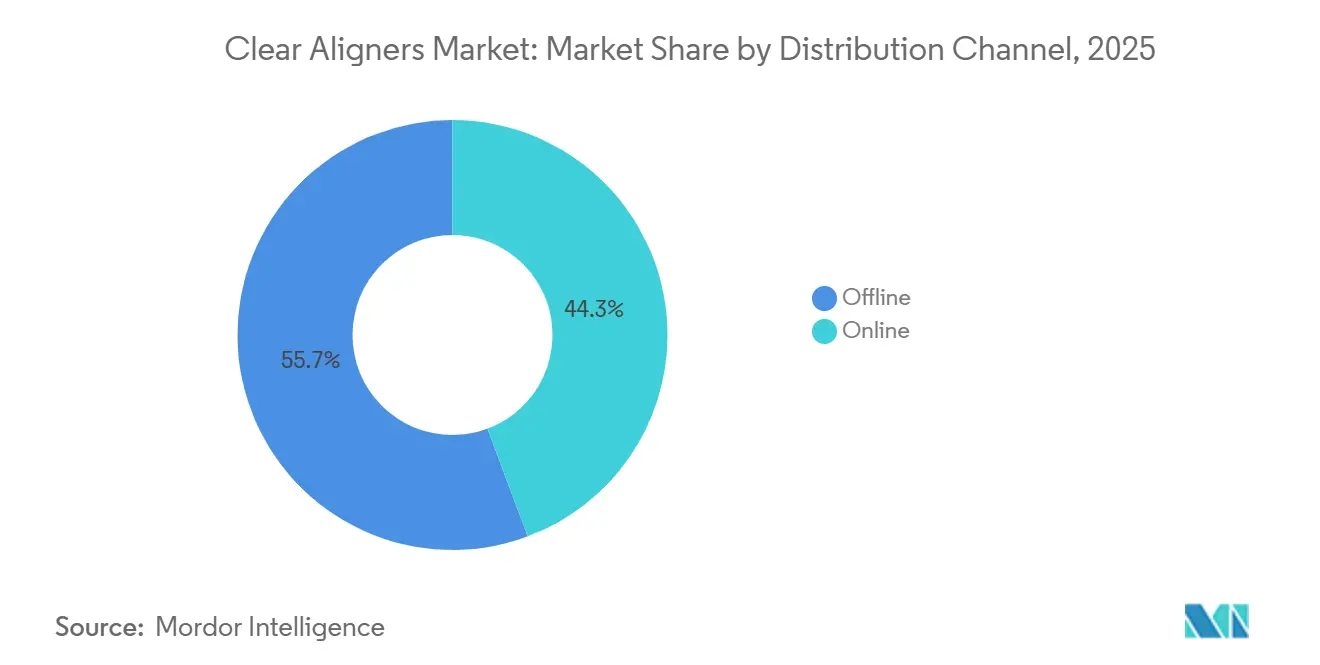
- By distribution, offline channels accounted for 55.70% of revenue in 2025, while online platforms are poised to grow at a 23.02% CAGR through 2031.
- By geography, North America led with 44.85% revenue share in 2025; Asia Pacific is set to expand at a 21.11% CAGR to 2031.
Note: Market size and forecast figures in this report are generated using Mordor Intelligence’s proprietary estimation framework, updated with the latest available data and insights as of 2026.
Global Clear Aligners Market Trends and Insights
Driver Impact Analysis*
| DRIVER | (~) % IMPACT ON CAGR FORECAST | GEOGRAPHIC RELEVANCE | IMPACT TIMELINE |
|---|---|---|---|
| Rising prevalence of adult malocclusion and treatment backlogs | 4.2% | Global, with acute demand in North America and Europe | Medium term (2-4 years) |
| Chair-side 3D printing adoption slashes turnaround times | 3.8% | North America and Europe early adoption; APAC scaling post-2027 | Short term (≤ 2 years) |
| Hybrid DTC-clinic models expanding access | 3.5% | North America and select European markets; regulatory barriers in Asia | Medium term (2-4 years) |
| Biocompatible smart polymers enhancing performance | 2.9% | Global, with R&D concentrated in North America and Germany | Long term (≥ 4 years) |
| AI-driven treatment planning reducing refinements | 3.1% | Global, led by North America and China | Short term (≤ 2 years) |
| Regulatory reimbursement expansion for orthodontics | 2.4% | Europe and select Asia-Pacific markets; limited near-term impact in US | Long term (≥ 4 years) |
| Source: Mordor Intelligence | |||
Rising Prevalence of Adult Malocclusion and Treatment Backlogs
Global epidemiological data show that roughly half of all people exhibit some form of malocclusion, and clear aligners now achieve 86% success in predictable movements such as molar distalization.[1]Jing Guo et al., “Success Rates of Clear Aligners,” International Journal of Oral Science, nature.com Delayed childhood treatment is creating a backlog of adult cases, while rising household incomes in China, India, and Brazil unlock previously priced-out demand. Awareness campaigns by orthodontic societies emphasise links between oral and systemic health, further normalising adult treatment. Emerging markets where orthodontic penetration is still below 15% provide a structural growth runway. Combined, these factors underpin the sustained double-digit expansion forecast for the clear aligners market. The American Association of Orthodontists reported that adults aged 18 and older accounted for 37% of new orthodontic starts in 2025, up from 28% in 2019, reflecting deferred treatment during the COVID-19 pandemic and growing acceptance of discreet appliances in professional settings.[2]Research Article, “Dental LT Resin Biocompatibility,” Frontiers in Materials, frontiersin.org Clear aligners capture a disproportionate share of the adult market because removability facilitates oral hygiene, and because treatment duration of 12 to 18 months for moderate cases aligns with career and lifestyle constraints.
Surge in Chair-side 3D Printing of Patient-Specific Aligners in Europe & North America
Dental practices are investing in in-office printers that produce aligners within hours, reducing treatment cycle times and cutting material waste by up to 40%.[3]Survey, “2024 Dental AI Attitudes,” Cigna Healthcare, cigna.com Materials such as Dental LT Clear and Tera Harz TC-85 have cleared biocompatibility hurdles, though full commercial approval remains pending in key markets. Early adopters report higher patient satisfaction because same-day delivery eliminates lengthy waits for replacement trays. By reducing dependence on large central labs, the technology challenges incumbent supply chains. It enables practices to master chair-side workflows, differentiating and creating new revenue streams through rapid refinements, strengthening competitiveness within the clear aligner market.
Hybrid DTC-Clinic Models Expanding Access
After regulatory pressure dimmed the prospects of standalone DTC operators, the hybrid model pairs digital marketing with periodic chair visits, balancing convenience and oversight. Align Technology rolled out professional-consumer campaigns in June 2025, spotlighting doctor-monitored hybrid pathways. With acquisition costs dropping by up to 40% compared with brick-and-mortar-only, hybrids broaden the clear aligners market by appealing to price-sensitive segments. EU-wide Class IIa device rules nevertheless require conformity assessments, imposing cross-border compliance costs that favor well-capitalized players. In the United States, state-level teledentistry compacts enable interstate digital practice, enabling national-scale delivery at marginal cost.
AI-Driven Treatment Planning Reducing Refinements
Align’s ClinCheck now leverages 14 million de-identified cases to anticipate root positioning and attachment sequencing, cutting refinements from 32% to 19% in a 2025 multi-center trial. Third-party tools such as uLab Systems are challenging the incumbent in the clear aligners market by offering pay-per-case cloud subscriptions compatible with open scanners. The FDA’s 2025 draft guidance clarifies that fully autonomous planning software requires a 510(k), prompting many vendors to market their systems as decision aids. Robust encryption and GDPR compliance are now table stakes for cloud providers entrusted with patient scans. Efficiency gains from AI increase chair capacity and translate into more starts, reinforcing positive feedback loops in the clear aligners market.
Restraints Impact Analysis*
| RESTRAINT | (~) % IMPACT ON CAGR FORECAST | GEOGRAPHIC RELEVANCE | IMPACT TIMELINE |
|---|---|---|---|
| High capital cost of digital workflow software licences | -2.8% | Global, with acute impact in emerging markets and solo practices | Short term (≤ 2 years) |
| Limited evidence for complex skeletal corrections | -2.1% | Global, particularly in markets with high prevalence of severe malocclusion | Medium term (2-4 years) |
| Increasing IP litigation and patent expirations | -1.5% | North America & Europe; spill-over to Asia Pacific | Short term (≤ 2 years) |
| Emerging plastic-waste regulations in major markets | -1.3% | Europe & Australia; gradual adoption elsewhere | Medium term (2-4 years) |
| Source: Mordor Intelligence | |||
High Capital Cost of Digital Workflow Software Licences
Full-featured digital orthodontic platforms can cost USD 50,000 per year in software alone, plus up to USD 100,000 for scanners, milling machines, and printers. The upfront investment required for digital orthodontic workflows, including intraoral scanners, treatment-planning software, and cloud-based case management, creates a barrier for solo practitioners and clinics in price-sensitive markets. Competitors, including 3Shape and Carestream Dental, offer lower-cost alternatives, with the 3Shape TRIOS 5 priced at USD 30,000. Yet, the total cost of ownership remains prohibitive for practices in India, Brazil, and Southeast Asia, where per-capita orthodontic spending is a fraction of North American levels. Financing models are emerging, and open-architecture ecosystems are gaining traction as practitioners seek to avoid vendor lock-in. The Open Dental Software Foundation released an interoperability standard in 2025, enabling treatment plans created in one platform to be exported to rival systems, reducing switching costs and intensifying price competition.
Limited Clinical Evidence for Complex Class III Corrections
Finite-element studies confirm that clear aligners excel in controlled tooth tipping and rotation, yet they still trail fixed appliances for severe skeletal discrepancies. Many orthodontists therefore retain dual modalities, reserving braces for intricate Class III or transverse cases. Align Technology’s mandibular advancement blocks address part of the gap, but broad, peer-reviewed data remain limited. The resulting clinical conservatism restricts aligner adoption in high-value, complex treatments, capping share gains in the top tier of orthodontic acuity.
*Our forecasts treat driver/restraint impacts as directional, not additive. The impact forecasts reflect baseline growth, mix effects, and variable interactions.
Segment Analysis
By Age: Momentum Shifts Toward Teens
Adults generated nearly three-quarters of the 2025 unit volume, yet teens are forecast to grow 21.58% annually from 2026 to 2031, eclipsing the overall clear aligners market CAGR. The clear aligners market size for teens is projected to expand at least as quickly as adult demand, driven by Invisalign First protocols that accommodate mixed dentition. Bluetooth wear-time sensors prompt real-time compliance nudges, improving outcomes and parents' peace of mind. A 2025 orthodontist survey found that 62% of respondents recommended aligners for teenage patients with moderate crowding, a significant increase from 41% in 2022. Parental willingness to finance removable appliances, combined with a school lifestyle that fits, positions teens as the fastest-growing cohort.
Adults remain the cornerstone, particularly professionals requiring invisible solutions for client-facing roles. Geriatric orthodontics is becoming a niche subsegment: patients aged ≥ 60 now seek alignment before implant or restorative procedures to preserve occlusal health. Removability reduces soft-tissue irritation, a prime consideration for older patients with periodontal compromise. With work-from-anywhere policies extending screen time, visible braces carry greater stigma, sustaining adult momentum in the clear aligners market. Regulators are adapting: FDA 510(k)s for pediatric-specific systems require retention-force proofing and age-appropriate instructions, while the EU MDR mandates post-market surveillance for users under 18.


By End User: Hospitals Acquire Share
Stand-alone practices accounted for 61.40% of 2025 revenue, driven by entrenched referral networks and high case throughput. Yet hospitals and academic medical centers are projected to grow at a 21.35% CAGR through 2031, expanding their share of the clear aligners market. Craniofacial teams appreciate the digital planning synergy, which integrates orthodontists, maxillofacial surgeons, and speech therapists into a single care pathway. Hospital adoption also lifts case acuity: complex cleft-related aligner therapy commands premium fees. Meanwhile, DSOs such as Heartland Dental standardized on iTero scanners in 2024, wielding purchasing clout to shave 30% off list pricing.
Mobile clinics and retail chains cover the remaining share, capitalizing on underserved rural pockets and mall footfall. Retail brands monetize cross-selling with general dentistry while leveraging centralized labs for production, reinforcing hybrid channel trends. Hospitals must adhere to Joint Commission hygiene protocols, adding compliance overhead. Conversely, private practices pivot toward remote monitoring to defend against hospital encroachment, thereby sustaining competitive equilibrium within the clear aligners market.
By Material Type: PET-G Accelerates
Multilayer polyurethane accounted for 67.62% of 2025 shipments, translating into a dominant market share in the clear aligners market. Nonetheless, PET-G is on track for 21.92% annual growth over the forecast horizon, benefiting from superior thermoforming fidelity and easier recycling. The clear aligners market size attributable to PET-G could double by 2031, spurred by EU single-use plastic directives that make take-back schemes more feasible for PET-G than polyurethane.
Thermoplastic polyurethane and polycarbonate blends make up the rest of the mix, with TPU enjoying niche demand in chair-side 3D printing due to its DLP compatibility. Regulatory probes into microplastic shedding are pushing innovators toward compostable or bio-based variants, such as silk-fibroin-reinforced films, which demonstrate promising antimicrobial properties. Wider adoption will hinge on matching the force-delivery profiles orthodontists expect while clearing regional safety approvals.

By Manufacturing Workflow: Chair-Side Printing Gains Ground
Centralized labs still produced 79.44% of aligners in 2025, anchoring the clear aligners market. Their USD 8–12 per-tray cost advantage remains meaningful, yet chair-side 3D printing is growing at 22.05% CAGR through 2031. For high-volume DSOs, same-day delivery enhances patient satisfaction and cuts drop-out risk from delayed starts. The FDA’s 2025 guidance requires printed aligners to match thermoformed biocompatibility, a standard most new resins now meet via ISO 10993 tests.
Hybrid workflows are emerging: some practices print models in-house, then thermoform aligners using desktop machines, marrying speed with polyurethane’s mechanical properties. Software bottlenecks persist, as proprietary file formats restrict data flow and inflate licence fees. The American Dental Association is advocating open file standards, which could accelerate chair-side adoption once finalized.
By Distribution Channel: Online Platforms Scale
Offline consultations still accounted for 55.70% of 2025 transactions, leveraging face-to-face diagnostics and trust. Yet online distribution is slated to grow at a 23.03% CAGR, driven by consumer demand for upfront price transparency and flexible scheduling. The General Dental Council in the UK stipulated in 2024 that a clinical exam precede any aligner prescription, forcing DTC platforms to contract licensed practitioners rather than rely solely on impression kits. This shift increases clinical legitimacy and expands the addressable clear aligners market rather than curbing it.
A 2025 AAO consumer survey revealed 68% still prefer at least one in-office visit, suggesting the winning model is hybrid rather than purely virtual. Align Technology’s Invisalign Virtual Care platform embodies the blended path, enabling orthodontists to start patients in the chair and then monitor progress on a smartphone, reducing visits from monthly to quarterly.
Geography Analysis
North America accounted for 44.85% of revenue in 2025, buoyed by well-established insurance schemes, a dense orthodontist network, and early-mover companies like Align Technology that continue to set clinical benchmarks. DSO consolidation fuels equipment orders, while Canada’s publicly funded system is broadening orthodontic reimbursement, lifting penetration in mid-income brackets. Mexico, meanwhile, draws cross-border dental tourism, channelling patients into aligner treatment bundled with cosmetic restorations.
Asia Pacific is forecast to deliver a 21.11% CAGR to 2031, the fastest anywhere, as large, untreated populations in China, India, and Southeast Asia move into the middle-income band. Chinese clear aligner adoption stands at only 11% of orthodontic case starts, versus 33.1% in the United States, highlighting white-space potential. Domestic challengers, bolstered by hundreds of millions of USD in venture funding, are scaling automated lines and localising software interfaces to lower entry prices. Japan and South Korea maintain premium pricing tiers thanks to high discretionary income, while India’s vast urban clusters underpin long-run volume growth.
Europe shows steady gains as regulatory harmonisation under the EU Medical Device Regulation tightens quality standards and elevates the profile of clinically validated brands. Germany, the United Kingdom, and France lead case volumes, each supported by partial insurance coverage for minor malocclusions in adolescents. Sustainability directives push material innovation; consequently, several Nordic start-ups are piloting biodegradable aligner foils. Elsewhere, the Middle East & Africa and South America are gradually opening through private insurance and government oral-health initiatives, though adoption remains aligned with urban, higher-income demographics.

Competitive Landscape
Competition in the clear aligners market is intensifying as early patents lapse and capital flows freely into new entrants. Align Technology remains the reference brand, yet its USD 58.5 million antitrust settlement in 2024-2025 shows regulators’ willingness to police market dominance. The company responded by raising US list prices roughly 3% while eliminating processing fees, signalling confidence in product stickiness. Dentsply Sirona’s supervised Byte relaunch illustrates how incumbents pivot to comply with tele-dentistry rules without surrendering DTC reach. These dynamics collectively shape the strategic direction of the Clear Aligner market.
Strategically, three clusters are emerging. Premium innovators emphasise AI-assisted treatment planning, complex-case protocols, and proprietary polymers to justify higher average selling prices. Cost leaders, often in China and India, leverage fully automated production and local supply chains to offer aligners at less than half the US price points. Hybrid channel players integrate virtual onboarding, physical scan hubs, and affiliated dentists to combine convenience with oversight, thereby hedging regulatory risk.
Private equity continues to consolidate regional lab networks and DSO platforms, bundling them with software start-ups to form vertically integrated ecosystems. This roll-up strategy promises scale but also raises the bar for independent clinics that lack negotiating leverage. Technology plays a pivotal role: AI wear-tracking, remote refinement logistics, and print-farm automation are becoming table stakes. As a result, small labs focused solely on manufacturing risk obsolescence unless they pivot to value-added digital services.
Clear Aligners Industry Leaders
Align Technology, Inc.
Angelalign Technology Inc.
SmileDirectClub Inc.
Straumann Group
Envista Holdings Corporation
- *Disclaimer: Major Players sorted in no particular order

Recent Industry Developments
- January 2026: Align Technology launched a clinician-only beta of Cubicure-based chair-side printers for same-day aligner delivery in the United States.
- October 2025: LuxCreo received strategic investment from Angelalign to co-develop high-performance 3D-printing materials for orthodontics.
- October 2025: Smartee Denti-Technology entered a strategic partnership with Straumann Group encompassing next-generation platform development and a minority equity investment by Straumann.
- May 2025: Align Technology received NMPA approval in China for the Invisalign Palatal Expander System, broadening early-intervention capabilities.
- April 2025: Align Technology launched the Invisalign System with Mandibular Advancement for Class II corrections.


Global Clear Aligners Market Report Scope
As per the scope of the report, clear aligners are a type of invisible braces that are used to straighten the teeth. The aligners are made up of strong plastics and are designed to fit perfectly into a person's mouth. These are customized clear braces achieved by digitally capturing impressions and processing the information using specialized software.
The clear aligners market is segmented by age, end-user, material type, manufacturing workflow, distribution channel, and geography. By age, the market is segmented into adults and teens. By end user, the market is segmented into hospitals, stand-alone, group practices, and other. By material, type, and market, the product is segmented into multilayer medical-grade polyurethane, PET-G (polyethylene terephthalate glycol), and other material types. By distribution channel, the market is segmented into offline and online. By geography, the market is segmented into North America, Europe, Asia-Pacific, the Middle East, Africa, and South America. The report offers the value (in USD) for the above segments. The market report also covers the estimated market sizes and trends for 17 different countries across major regions globally.
| Adults |
| Teens |
| Hospitals |
| Stand-alone Practices |
| Group Practices |
| Other End Users |
| Multilayer Medical-grade Polyurethane |
| PET-G (Polyethylene Terephthalate Glycol) |
| Other Material Types |
| Centralised Lab-manufactured |
| In-office Chair-side 3D-printed |
| Online |
| Offline |
| North America | United States |
| Canada | |
| Mexico | |
| Europe | Germany |
| United Kingdom | |
| France | |
| Italy | |
| Spain | |
| Rest of Europe | |
| Asia-Pacific | China |
| India | |
| Japan | |
| Australia | |
| South Korea | |
| Rest of Asia-Pacific | |
| Middle East and Africa | GCC |
| South Africa | |
| Rest of Middle East and Africa | |
| South America | Brazil |
| Argentina | |
| Rest of South America |
| By Age | Adults | |
| Teens | ||
| By End-User | Hospitals | |
| Stand-alone Practices | ||
| Group Practices | ||
| Other End Users | ||
| By Material Type | Multilayer Medical-grade Polyurethane | |
| PET-G (Polyethylene Terephthalate Glycol) | ||
| Other Material Types | ||
| By Manufacturing Workflow | Centralised Lab-manufactured | |
| In-office Chair-side 3D-printed | ||
| By Distribution Channel | Online | |
| Offline | ||
| By Geography | North America | United States |
| Canada | ||
| Mexico | ||
| Europe | Germany | |
| United Kingdom | ||
| France | ||
| Italy | ||
| Spain | ||
| Rest of Europe | ||
| Asia-Pacific | China | |
| India | ||
| Japan | ||
| Australia | ||
| South Korea | ||
| Rest of Asia-Pacific | ||
| Middle East and Africa | GCC | |
| South Africa | ||
| Rest of Middle East and Africa | ||
| South America | Brazil | |
| Argentina | ||
| Rest of South America | ||


Key Questions Answered in the Report
What is the projected size of the clear aligners market by 2031?
The market is expected to reach USD 13.65 billion by 2031, growing at a 19.59% CAGR.
Which region will grow fastest in the clear aligners market over the next five years?
Asia Pacific is set to register a 21.11% CAGR through 2031 due to large unmet demand and expanding dental infrastructure.
How dominant are adults compared with teens in current clear aligner demand?
Adults accounted for 74.58% revenue in 2025, although the teen segment is accelerating at 21.58% CAGR and will narrow the gap.
Why is chair-side 3D printing important for the clear aligners industry?
In-office printing cuts treatment lead times, reduces material waste, and allows real-time adjustments, driving a 22.05% CAGR for the workflow segment.
What role do DSOs play in shaping the future of clear aligner distribution?
DSOs pool purchasing power, reduce per-site technology costs, and are forecast to handle more than half of global aligner case starts by 2035, streamlining access and pricing.
Are clear aligners effective for complex Class III malocclusions?
Current evidence suggests aligners still trail fixed appliances for severe skeletal discrepancies, limiting penetration in those high-complexity cases and tempering overall market growth.
Page last updated on:


