
Clean Room Recovery Market Size and Share
Market Overview
| Study Period | 2020 - 2031 |
|---|---|
| Market Size (2026) | USD 0.64 Billion |
| Market Size (2031) | USD 1.9 Billion |
| Growth Rate (2026 - 2031) | 24.53 % |
| Fastest Growing Market | Asia-Pacific |
| Largest Market | North America |
| Market Concentration | Low |
Major Players *Disclaimer: Major Players sorted in no particular order Image © Mordor Intelligence. Reuse requires attribution under CC BY 4.0. | |
Clean Room Recovery Market Analysis by Mordor Intelligence
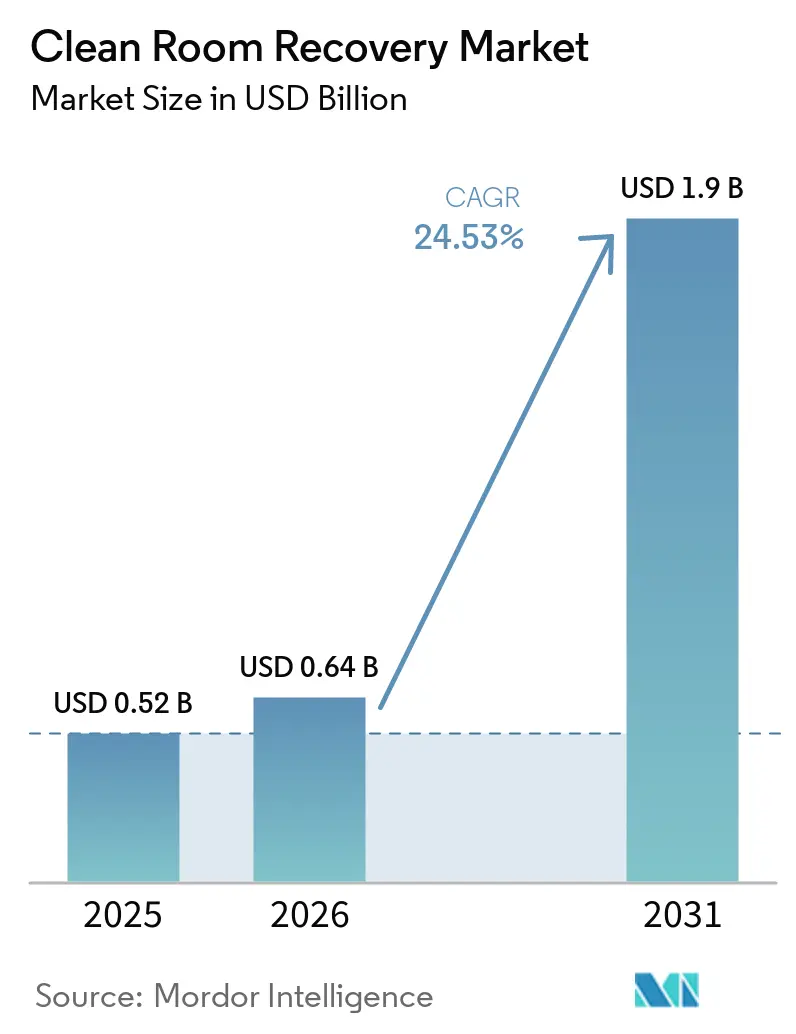
The Clean Room Recovery Market size is projected to be USD 0.52 billion in 2025, USD 0.64 billion in 2026, and reach USD 1.90 billion by 2031, growing at a CAGR of 24.53% from 2026 to 2031. Tighter contamination-control rules are making recovery planning a routine requirement for pharmaceutical and semiconductor facilities. New cleanroom construction also expands the number of sites that need recovery systems, trained responders, and documented restart procedures. Digital platforms are becoming increasingly important because facilities need environmental records that can be reviewed during incidents and after operations restart. Providers are responding by linking monitoring software, validation records, and field services into broader offerings. These conditions create opportunities for vendors to help operators restore controlled environments while meeting documentation requirements.
Key Report Takeaways
- By component, software and recovery platforms held 71.56% of the Clean Room Recovery Market share in 2025, while services are projected to expand at a CAGR of 26.42% through 2031.
- By recovery environment deployment, cloud held 67.18% of the Clean Room Recovery Market share in 2025, while hybrid deployment is projected to expand at a CAGR of 25.89% through 2031.
- By organization size, large enterprises held 72.16% of the Clean Room Recovery Market share in 2025, while SMEs are projected to expand at a CAGR of 26.15% through 2031.
- By industry vertical, BFSI held 22.31% of the Clean Room Recovery Market share in 2025, while healthcare and life sciences are projected to expand at a CAGR of 25.06% through 2031.
- By geography, North America held 37.49% of the Clean Room Recovery Market share in 2025, while Asia-Pacific is projected to expand at a CAGR of 25.35% through 2031.
Note: Market size and forecast figures in this report are generated using Mordor Intelligence’s proprietary estimation framework, updated with the latest available data and insights as of January 2026.
Global Clean Room Recovery Market Trends and Insights
Drivers Impact Analysis*
| Driver | (~) % Impact on CAGR Forecast | Geographic Relevance | Impact Timeline |
|---|---|---|---|
| Stricter Contamination-Control Requirements | +4.5% | Global, led by North America and Europe | Short term (≤ 2 years) |
| Semiconductor Fab and Advanced Packaging Expansion | +4.2% | Asia-Pacific, with spillover to North America | Medium term (2-4 years) |
| Higher Yield Loss and Downtime Costs | +3.8% | Global, concentrated in fab regions | Short term (≤ 2 years) |
| Cell, Gene, and Sterile Manufacturing Growth | +3.5% | North America, Europe, and emerging Asia-Pacific sites | Medium term (2-4 years) |
| Outsourced Specialist Recovery Support | +3.0% | Global, with higher penetration in North America and Europe | Long term (≥ 4 years) |
| Extreme Weather and Water-Intrusion Events | +2.3% | Asia-Pacific, North America, and Europe | Short term (≤ 2 years) |
| Source: Mordor Intelligence | |||
Stricter Contamination-Control Requirements in Regulated Manufacturing
Regulators increasingly expect facilities to show continuous contamination control rather than isolated compliance checks. ISO 14644-5:2025 sets requirements for operations control programs, impact assessments, personnel management, and special cleaning procedures. The standard replaced the 2004 first edition and raised documentation expectations for cleanroom operations. EU GMP Annex 1 also requires sterile sites to maintain an integrated contamination control strategy across design, utilities, people, and monitoring.[1] Recovery teams must therefore produce evidence that control measures worked during the restart process. This requirement favors platforms that preserve environmental data and validation records in an audit-ready format. The Clean Room Recovery Market benefits because recovery work has become tied to documented operating control. Facilities cannot treat a contamination event as a simple cleaning task when regulated production must resume. Digital logging supports particle-count records, cleaning evidence, and review of corrective actions. ISO 14644-5:2025 also places operations procedures within the cleanroom control framework. Semiconductor requirements are also becoming more formal as the SEMI S12 decontamination standard undergoes revision. This creates recurring demand for recovery software and specialist services.
Expansion of Semiconductor Fabs and Advanced Packaging Capacity
New fabs create more controlled space, more process tools, and more sites that must recover quickly after a disruption. UMC announced a phased expansion in Singapore and the construction of a new fab in Tainan during July 2026. The projects were intended to support demand linked to artificial intelligence and edge computing. Micron broke ground on a Singapore wafer fabrication facility in January 2026. The planned investment is USD 24 billion over 10 years, and the project targets 700,000 square feet of cleanroom space. Each new site adds a need for environmental monitoring, decontamination procedures, and requalification capability. Advanced facilities face risks from particles, chemical leaks, water intrusion, and equipment excursions. Replacement tools can take more than 12 months to obtain, which makes in-place recovery important for production continuity. Providers with trained technicians can reduce the time needed to assess affected areas. Digital monitoring can also retain baseline information that supports the recovery decision. The Clean Room Recovery Market, therefore, gains from the scale and value density of newer fabs. Vendors that combine SEMI-aligned practices with monitoring integration can address fab operators' needs. This is especially relevant in Japan, South Korea, Taiwan, Singapore, and North America.
Rising Cost of Yield Loss and Extended Production Downtime
Contamination can cause direct production losses for semiconductor and pharmaceutical operators. A deferred HEPA filter change in an ISO 4 lithography bay was associated with a rise in defect rates from 1.2% to 4.8% in one documented case. The same case required a 72-hour remediation effort and involved USD 1.2 million in scrapped product and lost revenue. Such incidents show why operators place value on rapid assessment and controlled remediation. Recovery planning can protect process yields during disruptions. It can also reduce the risk that a restart introduces another deviation. The cost of downtime changes how operators assess recovery spending. Semiconductor and pharmaceutical facilities increasingly treat recovery arrangements as part of facility readiness. Documented response procedures help teams coordinate cleaning, testing, and quality review. The resulting demand extends beyond emergency labor to software that keeps records available. The Clean Room Recovery Market is strengthened when recovery contracts are established before a facility experiences an incident. Providers can differentiate by pairing emergency response with digital validation workflows. This approach also helps customers manage restart documentation.
Growth in Cell, Gene, and Sterile Manufacturing Capacity
Cell and gene therapy facilities operate in environments with high sensitivity to contamination. Johnson and Johnson announced a more than USD 1 billion investment in a cell therapy manufacturing facility in Pennsylvania in February 2026. UCB’s Genesis gene therapy facility in Wallonia began operations in April 2026 after an investment exceeding USD 216 million. Kincell Bio also added 2 ISO 7 cleanroom suites at its Research Triangle Park facility in April 2026. These additions increase the installed base of sensitive production environments. Aseptic fill-finish and cell therapy suites need extensive validation after a contamination event. Facilities may need to complete particle testing, surface checks, microbiological sampling, and airflow verification before production resumes. EU GMP Annex 1 emphasizes contamination control and the need for documented evidence throughout sterile manufacturing activities. This supports demand for record management and remote quality review. The Clean Room Recovery Market has an opening for providers that combine physical remediation with these digital functions. Such systems can help teams organize recovery records while work is underway.
Restraints Impact Analysis*
| Restraint | (~) % Impact on CAGR Forecast | Geographic Relevance | Impact Timeline |
|---|---|---|---|
| Limited Availability of ISO-Qualified Recovery Technicians | -2.8% | Global, most acute in North America and emerging in Asia-Pacific | Short term (≤ 2 years) |
| High Validation Burden Before Production Restart | -1.9% | Global, strongest in pharmaceutical and semiconductor facilities | Medium term (2-4 years) |
| Chemical Compatibility Risks for Sensitive Equipment | -1.1% | Global | Medium term (2-4 years) |
| Fragmented Incident Data and Recovery Specifications | -0.8% | Global, with greater effect in less standardized settings | Long term (≥ 4 years) |
| Source: Mordor Intelligence | |||
Limited Availability of ISO-Qualified Recovery Technicians
The Clean Room Recovery Market faces a limited supply of trained recovery workers. A 2026 workforce study cited a possible shortfall of 180,000 qualified workers across pharmaceutical and biotechnology manufacturing by 2028. The draft also reported annual technician turnover near 28%. Recovery workers need specialized knowledge of ISO 14644, cGMP, validation, and contamination control. Training can take 12-18 months beyond general manufacturing preparation. A provider may have to maintain long-term staffing arrangements or accept slower response times. The shortage is most pressing where new pharmaceutical, biotechnology, and semiconductor sites compete for the same skills. Slow deployment can increase a customer’s downtime when an incident affects production. Workforce programs are beginning to develop the pipeline for cleanroom roles. BioTalent Canada has introduced a Cleanroom Ready Certification program focused on cleanroom work in biomanufacturing. However, training capacity takes time to keep pace with facility expansion. Service firms may face limits on rapid geographic expansion until more qualified workers are available.
High Validation Burden Before Production Restart
A contaminated cleanroom requires a regulated restart process instead of a basic cleaning response. Facilities must collect particle counts, surface swab results, microbial results, and airflow verification before resuming affected operations. EU GMP Annex 1 requires a facility to demonstrate that its contamination control strategy worked as intended. This process can delay restart by days or weeks in multi-suite aseptic facilities. Teams unfamiliar with a site’s procedures can also create deviations that require further investigation. These requirements can make recovery work more complex and costly. Digital documentation can reduce some administrative pressure during physical remediation. Remote quality review can allow validation tasks to proceed alongside decontamination work. Recovery providers that bundle documentation tools may reduce the chance of missing records. The Clean Room Recovery Market remains constrained, with customers relying on fragmented incident records and inconsistent recovery specifications. Chemical compatibility also remains important because cleaning agents can affect sensitive equipment and surfaces. These factors favor providers that can offer site-specific procedures and auditable records.
*Our forecasts treat driver/restraint impacts as directional, not additive. The impact forecasts reflect baseline growth, mix effects, and variable interactions.
Segment Analysis
By Component: Software Platforms Anchor Revenue While Services Expand
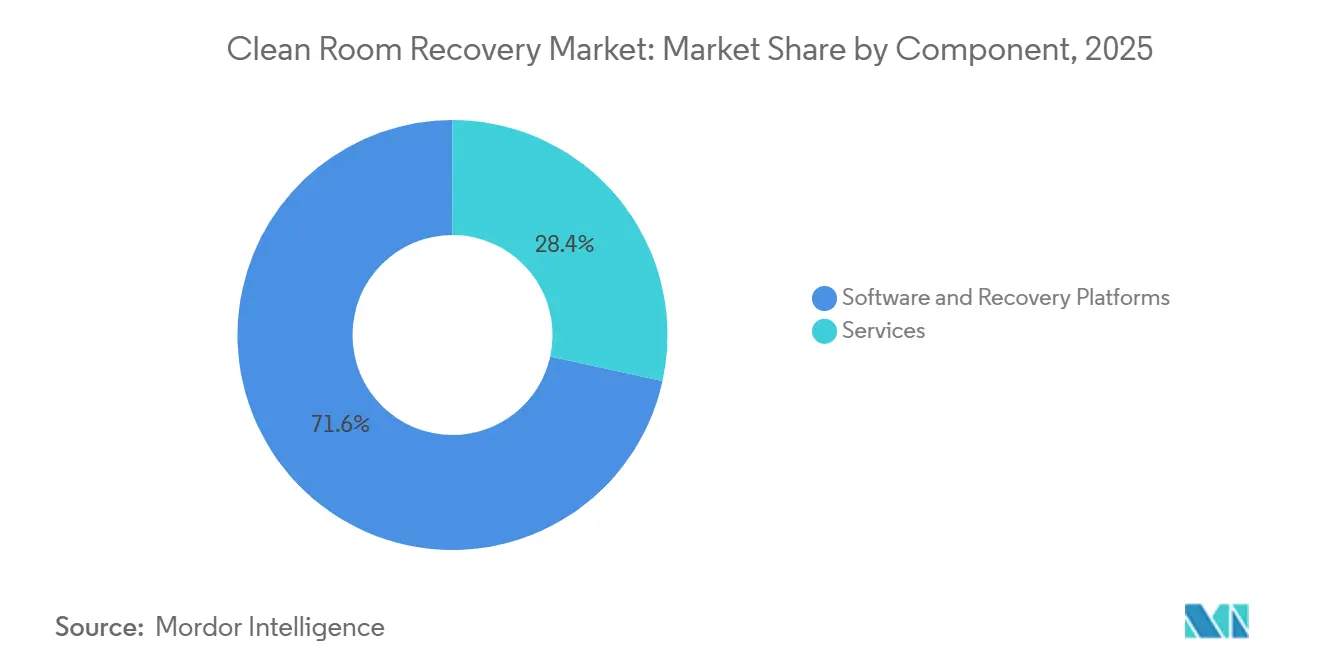
Software and recovery platforms held 71.56% of the Clean Room Recovery Market share in 2025. The position reflects demand for digital contamination monitoring, environmental data logging, and cloud-based compliance management. Facilities increasingly purchase licenses for ongoing oversight rather than only after an incident. These systems retain validation records that can be used during audits and recovery reviews. CURIS System reported expanded integration of its automated biodecontamination systems across pharmaceutical manufacturing and BSL laboratory environments in January 2026. The company linked this work to faster validation cycles and cGMP-ready audit documentation. Software’s leading share shows the value placed on continuous evidence of control. Physical remediation remains necessary when an event affects a controlled space. The platform model provides customers with a reliable source of environmental and validation data.
Services are projected to expand at a CAGR of 26.42% from 2026 to 2031. Service demand rises as semiconductor and cell therapy facilities add new cleanroom capacity. These customers need emergency response and post-incident requalification support. Controlled Contamination Services and Sasser Restoration compete through response speed and sector-specific GMP experience. AES Clean Technology offers cleanroom design, cleaning services, and contamination-control strategy work. Providers can use service engagements to introduce clients to recurring platform subscriptions. Platform-integrated vendors can also offer audit-ready documentation during remediation. Pure service firms may face a wider capability gap as documentation expectations increase. The clean room recovery industry is moving toward lifecycle support that combines technology with field execution.
By Recovery Environment Deployment: Hybrid Models Address Compliance Needs
Cloud deployment held 67.18% share in 2025. It supports centralized monitoring, digital validation records, and remote quality review across multiple sites. Cloud platforms can reduce customers' infrastructure needs by adding recovery tools to existing technology systems. They also allow enterprise operators to compare environmental information across facilities. The Clean Room Recovery Market size for cloud deployment reflects the role of software in ongoing compliance management. Cloud tools are particularly useful for large operators with sites in several jurisdictions. They support centralized analytics and standardized record handling. These functions can help operators manage recovery procedures across their network.
Hybrid deployment is projected to expand at a CAGR of 25.89% through 2031. Pharmaceutical and semiconductor operators use hybrid systems to balance cloud analysis with local control of process-critical records. On-premises storage can remain important where data residency rules are restrictive. Local environmental baseline data can also remain available during a network disruption or facility emergency. Hybrid-ready platforms can support offline-capable data logging and local alerts. Operators are upgrading cloud-only systems to add edge computing features. Embedded sensor networks can feed both local nodes and cloud dashboards. This configuration is relevant for APAC fabs that face seismic and weather-related disruptions. Vendors with hybrid architectures can address resilience and documentation requirements within a single deployment model.
By Organization Size: Large Enterprises Lead While SMEs Gain Access
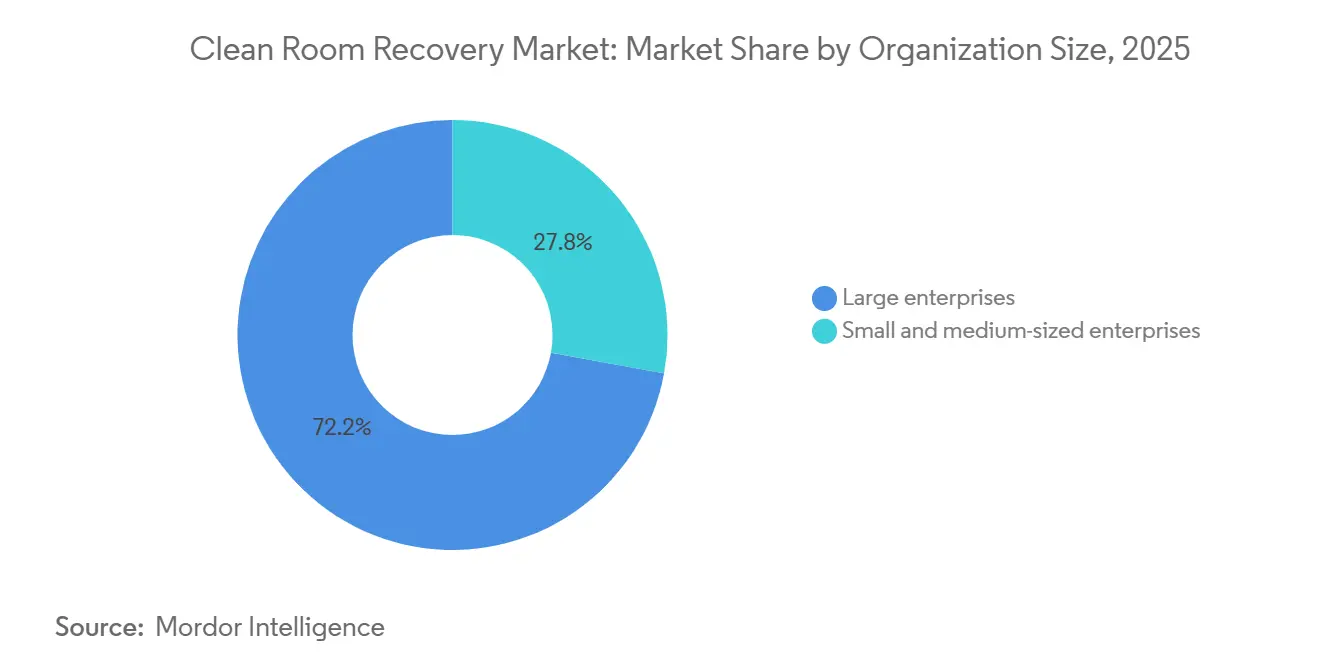
Large enterprises held 72.16% of the Clean Room Recovery Market share in 2025. Their position reflects the cost of enterprise software, multi-site operations, and formal audit requirements. Large pharmaceutical and semiconductor companies can invest in integrated monitoring and recovery systems. Micron’s Singapore facility represents a planned USD 24 billion investment over 10 years.[2] Projects of this scale create anchor accounts for recovery platform providers. Enterprise customers often need validated systems that connect environmental monitoring with quality records. They can also maintain wider internal teams for compliance and continuity planning. This supports demand for integrated solutions across several facility types.
SMEs are projected to expand at a CAGR of 26.15% from 2026 to 2031. Cloud-delivered software reduces the upfront investment needed for contamination monitoring and validation tools. CDMOs and developing biotechnology companies are important adopters because their compliance requirements are high. Kincell Bio’s expansion in North Carolina added 2 ISO 7 cleanroom suites for late-stage and commercial cell therapy programs. Smaller sites may focus on a practical documentation trail when they lack dedicated validation teams. Modular licenses, preconfigured templates, and remote quality review can reduce operating pressure. SMEs also value fast response commitments because they have less spare production capacity. Providers can differentiate by linking software access to a credentialed response network.
By Industry Vertical: BFSI Leads While Healthcare and Life Sciences Expand
BFSI held 22.31% share of the Clean Room Recovery Market size in 2025. The sector operates extensive data-center infrastructure and requires operational resilience. Controlled environments support trading systems, secure document processing, and critical information technology functions. These sites need incident records and recovery procedures after environmental disruptions or water intrusion. Financial institutions have the budgets to adopt monitoring and recovery platforms across their operations. Their demand broadens the customer base beyond pharmaceutical and semiconductor facilities. The leading position also reflects the role of controlled environments in business continuity planning. Vendors serving BFSI need to meet expectations for secure records and reliable recovery support.
Healthcare and life sciences are projected to expand at a CAGR of 25.06% through 2031. New cell and gene therapy facilities require sensitive ISO 5 and ISO 7 environments. UCB’s Wallonia facility began operations in April 2026 following an investment exceeding EUR 200 million (USD 216 million). Government and public administration, industrial manufacturing, IT and telecommunication, energy and utilities, and oil and gas also create demand. These users operate controlled environments for defense electronics, precision manufacturing, data infrastructure, turbine components, and subsea electronics. Retail and e-commerce users add smaller subscription volumes through automation infrastructure. Transportation and logistics firms also use precision-sensor supply chains. The broader set of users supports demand for providers with experience across multiple regulated environments.
Geography Analysis
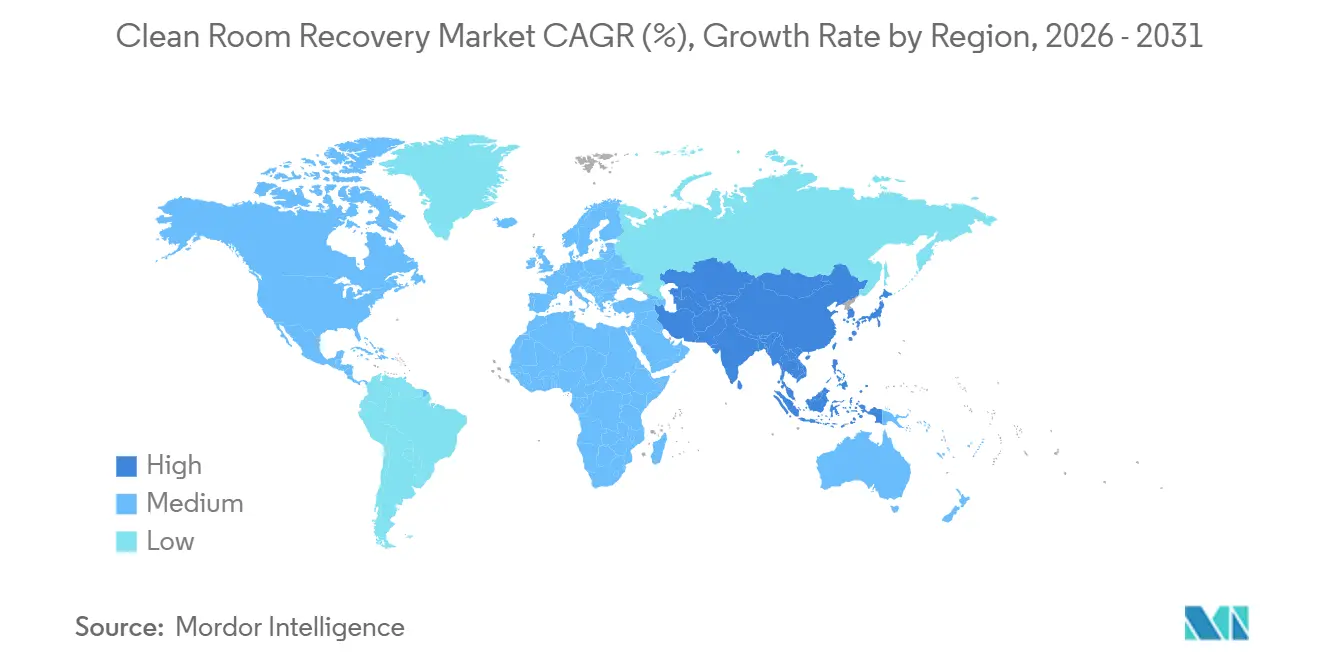
North America held 37.49% of the Clean Room Recovery Market share in 2025. The region combines pharmaceutical manufacturing, semiconductor facilities, and financial services data-center infrastructure. More than USD 38 billion in United States pharmaceutical manufacturing investment was announced from the start of 2025 through June 2026. FDA cGMP requirements make environmental control and contamination documentation important purchasing factors. United States facilities also face scrutiny of cross-contamination and environmental control risks. Canada’s biomanufacturing expansion adds to regional demand for recovery support. Mexico’s medical-device manufacturing corridor extends the regional base. Its connection to the United States supply chain may require cross-border coordination for multinational operators.
Asia-Pacific is projected to expand at a CAGR of 25.35% from 2026 to 2031. Growth in the semiconductor and pharmaceutical sectors supports demand across China, Japan, South Korea, India, Taiwan, and Singapore. UMC announced expansion plans in Singapore and Taiwan in July 2026. SK hynix announced a KRW 54 trillion commitment for its Yongin Y2 and Cheongju M17 fabs in 2026.[3] At the 2026 IRS annual average rate, the commitment was equivalent to USD 39.4 billion. Japan, South Korea, and Taiwan have more established adoption of recovery platforms. India and Southeast Asia are seeing demand growth driven by CDMO capacity additions and first-time platform buyers.
The implementation shapes the EU GMP Annex 1 in Europe and the adoption of ISO 14644-5:2025. Germany, the United Kingdom, France, Belgium, and the BENELUX countries are key locations for pharmaceutical manufacturing. UCB’s Genesis facility in Belgium illustrates demand for advanced software and emergency-response capability. South America has emerging demand in Brazil’s pharmaceutical sector and Argentina’s biotechnology activity. Market penetration is lower because facility scales and regulatory enforcement remain less extensive. Adoption in the Middle East and Africa is in its early stages. Demand is concentrated in the Gulf Cooperation Council's pharmaceutical manufacturing and data-center infrastructure.
Competitive Landscape
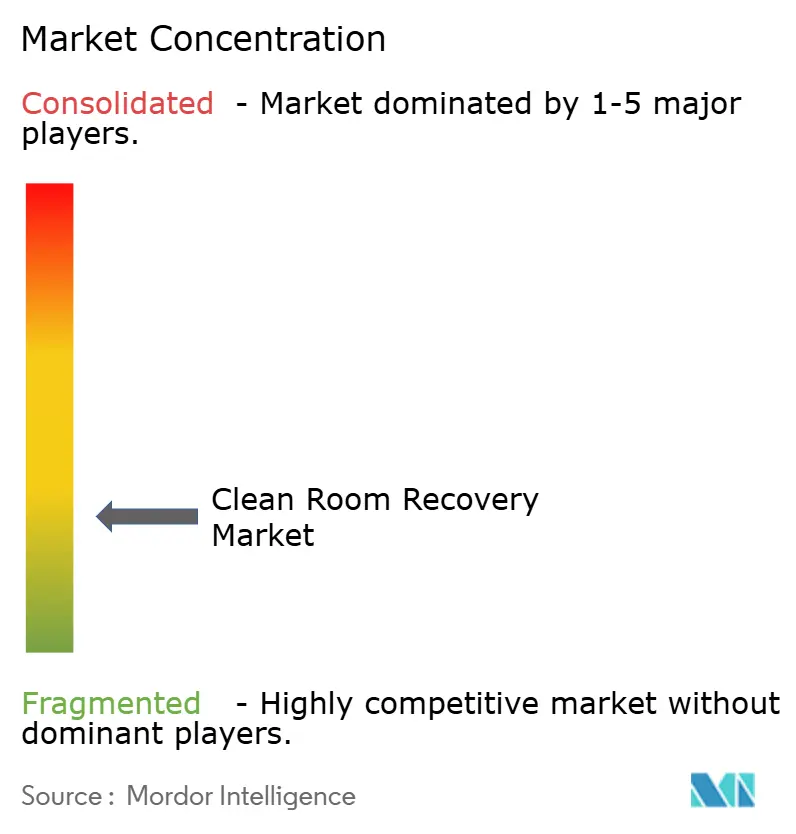
The Clean Room Recovery Market is moderately fragmented, with no provider holding a dominant position across software and field recovery services. BELFOR Property Restoration has a broad footprint in semiconductor and pharmaceutical decontamination. The company operates under SEMI S12 decontamination procedures and has experience in wafer fabrication recovery across Asia, Europe, and North America. The CURIS System competes through automated decontamination equipment and services. Its BMS Link System, launched in August 2026, connected a portable CURIS 3 device to building management system communications.[4] The system uses Hybrid Hydrogen Peroxide technology with an EPA-registered 6-log sporicidal kill claim. These capabilities can reduce cycle time and limit operator variation during biodecontamination.
Exyte has pursued an end-to-end position through engineering, cleanroom construction, and lifecycle support. In 2026 integration of Pharmaplan added biopharma process expertise to its broader delivery model. Exentec, an Exyte company, introduced Cleanroom Envelope in February 2026. The product combined architectural and ventilation elements for cleanroom construction. Exyte’s 300,000-square-foot facility in Nampa, Idaho, supports its component role in the recovery supply chain. Controlled Contamination Services and GMP Technical Solutions compete through sector experience and local response. The shortage of qualified technicians can constrain their ability to scale.
The main opportunity lies in joining software integration with emergency service delivery. Many platform suppliers lack credentialed response networks, while many service firms lack digital validation record systems. Vendors that combine monitoring, audit trails, and service-level commitments can address the needs of enterprises and CDMOs. Stäubli Robotics presented an enhanced Sterimove mobile cleanroom robot at INTERPHEX 2026 in April. The robot was designed for Grade A through Grade D sterile environments. MicronView also announced a robot for automated vaporized H₂O₂ decontamination in 2026. Automation can reduce manual handling and labor intensity in recovery work.
Clean Room Recovery Industry Leaders
-
RecoveryPro Co., Ltd.
-
CURIS System, Inc.
-
Controlled Contamination Services, LLC
-
AES Clean Technology, Inc.
-
ABN Cleanroom Technology NV
- *Disclaimer: Major Players sorted in no particular order
Recent Industry Developments
- September 2026: Amkor Technology announced Phase 2 of its Arizona Advanced Packaging and Test Campus, expanding the total planned investment to USD 12 billion and adding 60,000 square meters of cleanroom space. The campus capacity reached 93,000 square meters, exceeding the 33,000 square meters planned for Phase 1.
- July 2026: United Microelectronics Corporation announced a phased expansion with cleanroom installation at its Phase 4 Singapore facility and new fab construction at its Tainan campus. The projects expanded silicon photonics capacity and added a cleanroom area that requires integration with an environmental monitoring and recovery platform.
- April 2026: UCB’s Genesis gene therapy manufacturing facility in Braine l’Alleud, Wallonia, Belgium, began operations. The site represented an investment of over USD 216 millionan and covered 17,000 square meters for aseptic gene therapy production.
- February 2026: Johnson & Johnson announced an investment of over USD 1 billion in a cell therapy manufacturing facility in Montgomery County, Pennsylvania. The facility was designed to support CAR-T and immune-mediated therapy candidates and required continuous environmental monitoring from the time of commissioning.
Global Clean Room Recovery Market Report Scope
The Clean Room Recovery Market comprises software platforms, recovery environments, and related services that enable organizations to securely restore critical systems, applications, identities, endpoints, and data following cyberattacks, ransomware incidents, destructive malware events, or other cyber disruptions. Clean room recovery solutions provide isolated, trusted, and validated recovery environments that allow organizations to rebuild and recover business operations while minimizing the risk of reinfection and ensuring cyber resilience, business continuity, and operational recovery.
The Clean Room Recovery Market Report is Segmented by Component (Software and Recovery Platforms, and Services), Recovery Environment Deployment (Cloud, On-Premises, and Hybrid), Organization Size (Small and Medium-Sized Enterprises, and Large Enterprises), Industry Vertical (Government and Public Administration, Industrial Manufacturing, Retail and E-Commerce, Transportation and Logistics, Energy and Utilities, Oil and Gas, IT and Telecommunication, Media and Entertainment, Education and Research Institutions, Healthcare and Life Sciences, Banking, Financial Services, and Insurance [BFSI], and Other Industry Verticals), and Geography (North America, South America, Europe, Asia-Pacific, and Middle East and Africa). The Market Forecasts are Provided in Terms of Value (USD).
| Software and Recovery Platforms |
| Services |
| Cloud |
| On-Premises |
| Hybrid |
| Small and medium-sized enterprises |
| Large enterprises |
| Government and Public Administration |
| Industrial Manufacturing |
| Retail and E-Commerce |
| Transportation and Logistics |
| Energy and Utilities |
| Oil and Gas |
| IT and Telecommunication |
| Media and Entertainment |
| Education and Research Institutions |
| Healthcare and Life Sciences |
| Banking, Financial Services, and Insurance (BFSI) |
| Other Industry Verticals |
| North America | United States | |
| Canada | ||
| Mexico | ||
| South America | Brazil | |
| Argentina | ||
| Rest of South America | ||
| Europe | Germany | |
| United Kingdom | ||
| France | ||
| Italy | ||
| BENELUX | ||
| Rest of Europe | ||
| Asia-Pacific | China | |
| Japan | ||
| India | ||
| South Korea | ||
| Australia | ||
| Rest of Asia-Pacific | ||
| Middle East and Africa | Middle East | United Arab Emirates |
| Saudi Arabia | ||
| Rest of Middle East | ||
| Africa | South Africa | |
| Nigeria | ||
| Egypt | ||
| Rest of Africa | ||
| By Component | Software and Recovery Platforms | ||
| Services | |||
| By Recovery Environment Deployment | Cloud | ||
| On-Premises | |||
| Hybrid | |||
| By Organization Size | Small and medium-sized enterprises | ||
| Large enterprises | |||
| By Industry Vertical | Government and Public Administration | ||
| Industrial Manufacturing | |||
| Retail and E-Commerce | |||
| Transportation and Logistics | |||
| Energy and Utilities | |||
| Oil and Gas | |||
| IT and Telecommunication | |||
| Media and Entertainment | |||
| Education and Research Institutions | |||
| Healthcare and Life Sciences | |||
| Banking, Financial Services, and Insurance (BFSI) | |||
| Other Industry Verticals | |||
| By Geography | North America | United States | |
| Canada | |||
| Mexico | |||
| South America | Brazil | ||
| Argentina | |||
| Rest of South America | |||
| Europe | Germany | ||
| United Kingdom | |||
| France | |||
| Italy | |||
| BENELUX | |||
| Rest of Europe | |||
| Asia-Pacific | China | ||
| Japan | |||
| India | |||
| South Korea | |||
| Australia | |||
| Rest of Asia-Pacific | |||
| Middle East and Africa | Middle East | United Arab Emirates | |
| Saudi Arabia | |||
| Rest of Middle East | |||
| Africa | South Africa | ||
| Nigeria | |||
| Egypt | |||
| Rest of Africa | |||
Key Questions Answered in the Report
What is the Clean Room Recovery Market size?
The Clean Room Recovery Market is projected to be USD 0.64 billion in 2026 and reach USD 1.90 billion by 2031, at a CAGR of 24.53%.
What is driving demand for clean room recovery solutions?
Tighter contamination-control requirements, new semiconductor fabs, and growing sterile manufacturing capacity are increasing demand.
Which component leads clean room recovery spending?
Software and recovery platforms held 71.56% share in 2025 because operators need continuous monitoring and documented validation records.
Which deployment model is growing fastest?
Hybrid deployment is projected to expand at a CAGR of 25.89% through 2031 as operators combine cloud analytics with local data control.
Which end-use sector has the fastest projected growth?
Healthcare and life sciences are projected to expand at a CAGR of 25.06% through 2031, supported by cell and gene therapy capacity.
Which region is expected to grow fastest?
Asia-Pacific is projected to expand at a CAGR of 25.35% through 2031, supported by semiconductor and pharmaceutical facility additions.