Clean Hydrogen Market Size and Share
Market Overview
| Study Period | 2021 - 2031 |
|---|---|
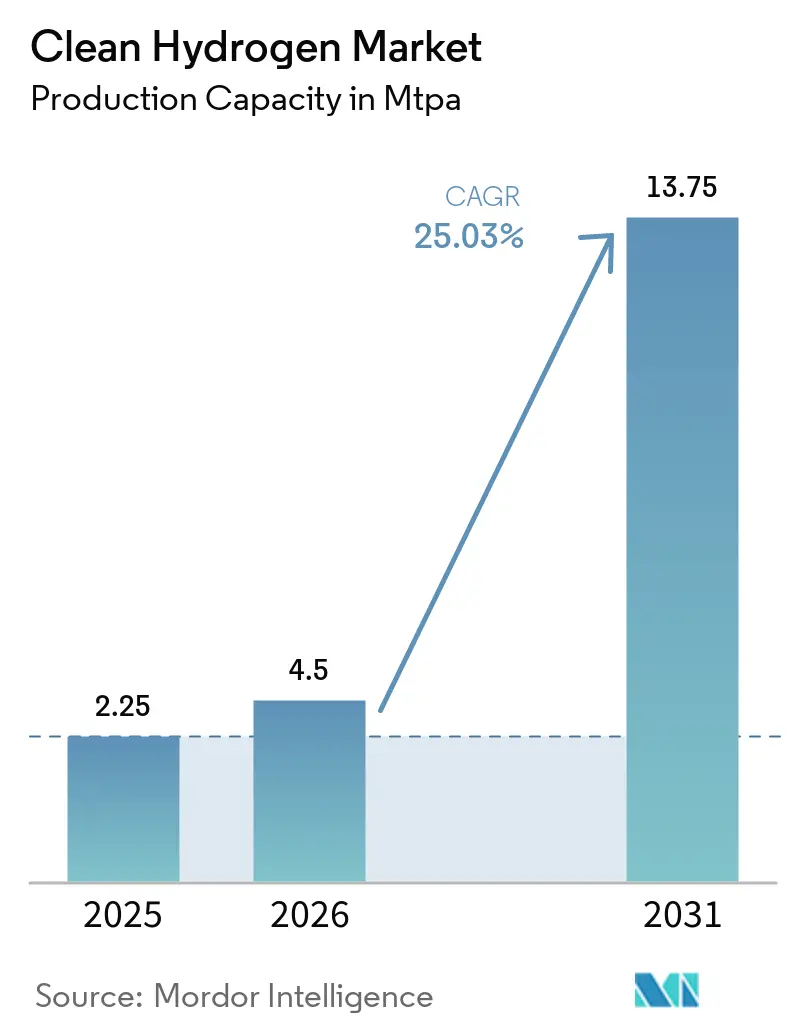
| Market Volume (2026) | 4.5 MTPA |
| Market Volume (2031) | 13.75 MTPA |
| Growth Rate (2025 - 2030) | 25.03% CAGR |
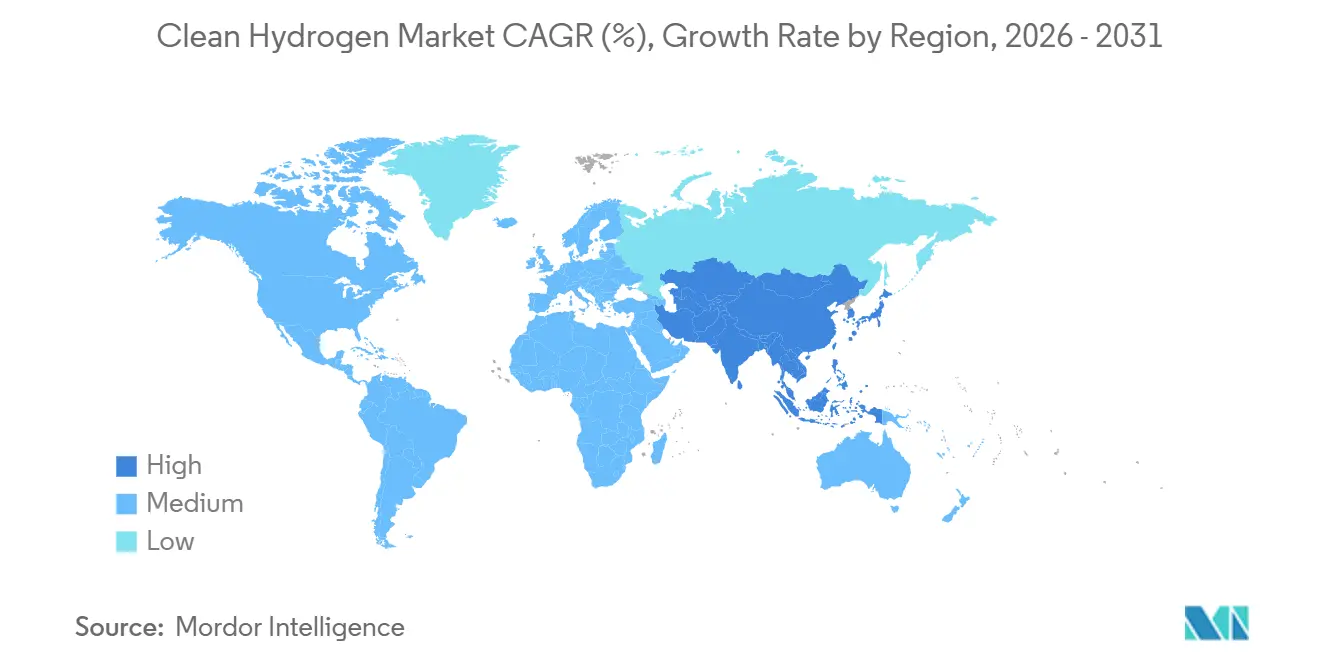
| Fastest Growing Market | Asia Pacific |
| Largest Market | Asia Pacific |
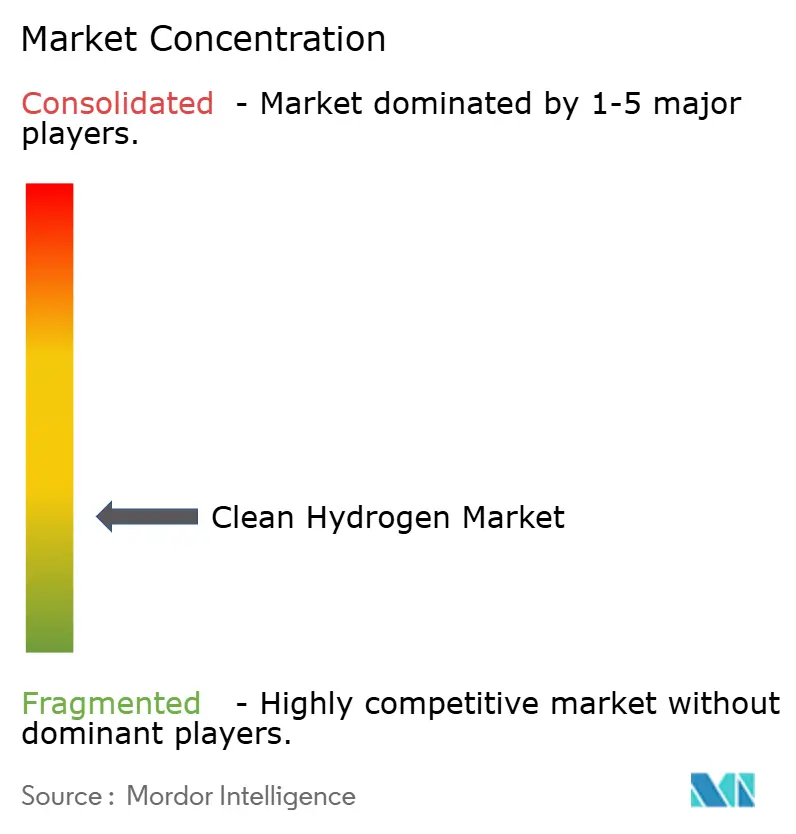
| Market Concentration | Low |
Major Players *Disclaimer: Major Players sorted in no particular order Image © Mordor Intelligence. Reuse requires attribution under CC BY 4.0. | |
Clean Hydrogen Market Analysis by Mordor Intelligence
The Clean Hydrogen Market size in terms of production capacity is expected to grow from 2.25 MTPA in 2025 to 4.5 MTPA in 2026 and is forecast to reach 13.75 MTPA by 2031 at 25.03% CAGR over 2026-2031. Rapid scale-up of electrolyzer factories, generous production tax credits, and mandatory green-procurement schemes are lowering the delivered cost of hydrogen toward fossil parity, placing the clean hydrogen market on an accelerated growth curve. Blue hydrogen retained cost leadership in 2025, yet falling electrolyzer prices below USD 2457 per kilowatt in Europe and below USD 500 per kilowatt from Chinese suppliers are shifting project pipelines toward renewable-powered electrolysis. Industrial gas majors are repurposing pipeline grids to lock in long-term contracts, while new entrants chase modular, containerized electrolyzer orders that shorten construction schedules. At the same time, governments are channeling more than USD 20 billion in combined subsidies into gigawatt-scale projects, crowding in private debt at investment-grade terms.
Key Report Takeaways
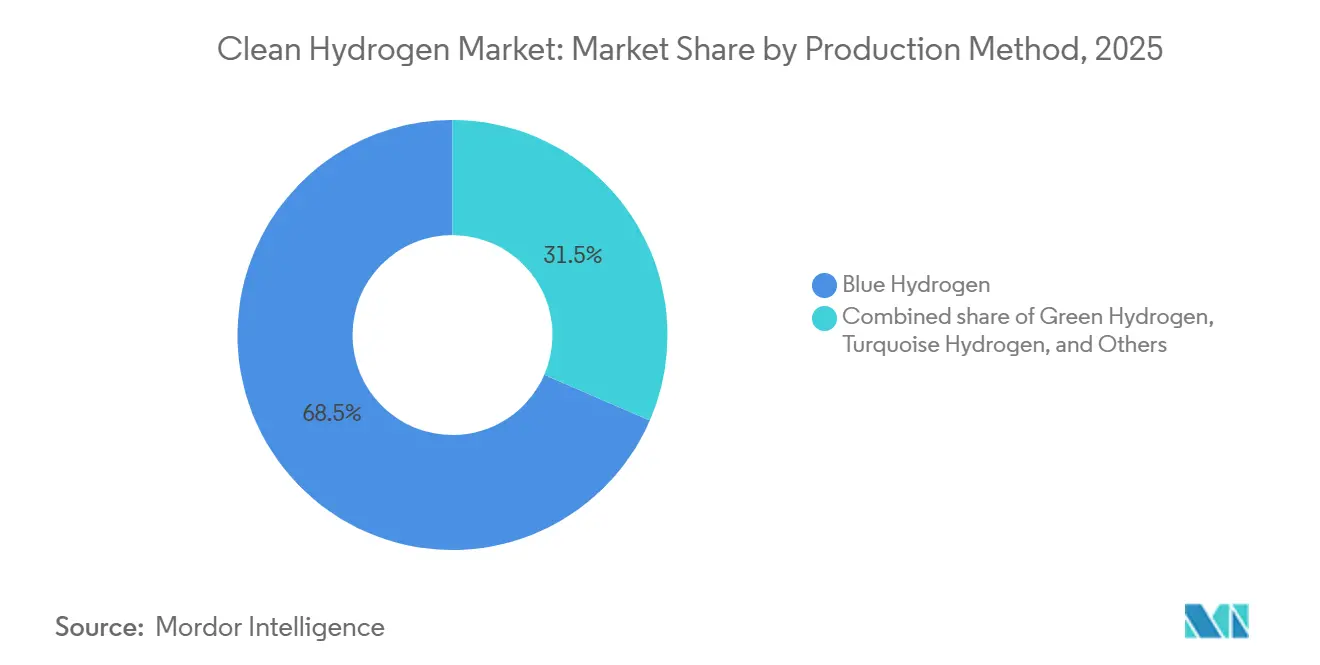
- Blue hydrogen commanded 68.5% of the clean hydrogen market share in 2025, whereas green hydrogen is forecast to grow the fastest at a 34.6% CAGR to 2031.
- Alkaline electrolyzers held 58.9% of the clean hydrogen market size in 2025; the PEM segment is projected to post the highest CAGR at 32.3% between 2026 and 2031.
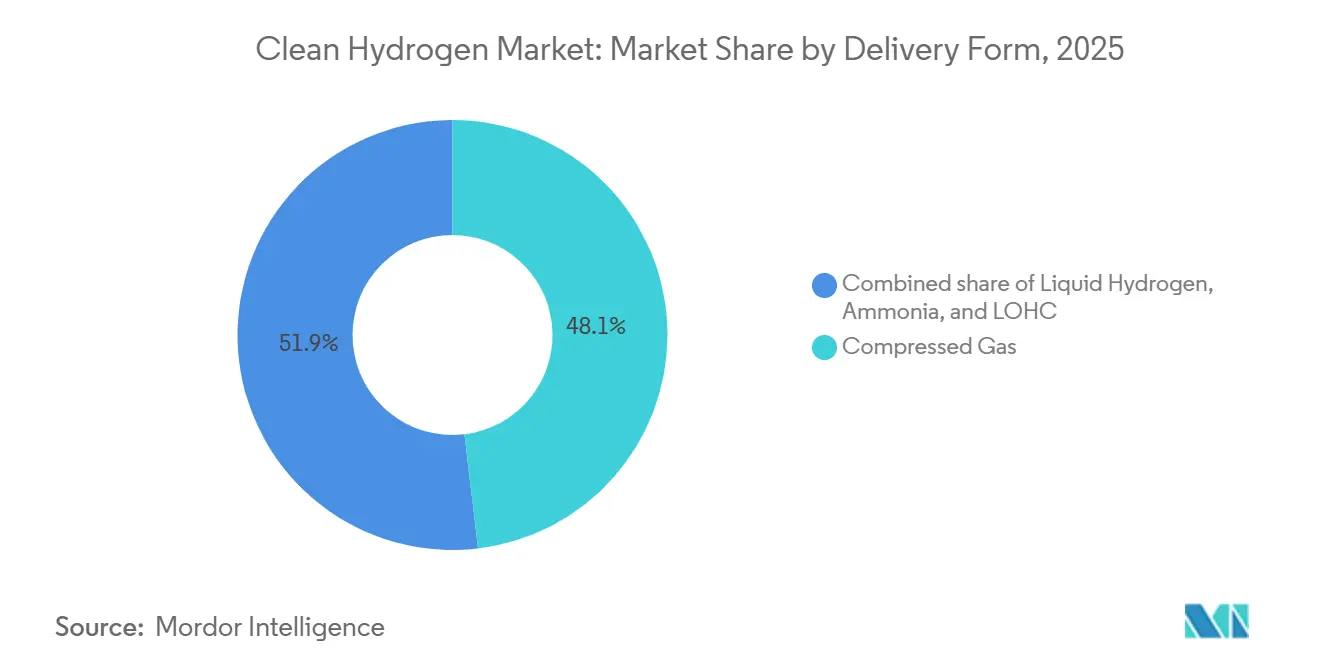
- Compressed gas distribution captured 48.1% of the clean hydrogen market share in 2025, while liquid hydrogen is expected to advance at a 30.9% CAGR through 2031.
- Industrial uses represented 53.8% of the clean hydrogen market size in 2025; transportation demand will expand the quickest at 35.7% CAGR to 2031.
- Asia-Pacific accounted for 43.7% of the 2025 volume, and the region is projected to record the highest regional CAGR at 27.4% over 2026-2031.
Note: Market size and forecast figures in this report are generated using Mordor Intelligence’s proprietary estimation framework, updated with the latest available data and insights as of January 2026.
Global Clean Hydrogen Market Trends and Insights
Drivers Impact Analysis*
| Driver | (~) % Impact on CAGR Forecast | Geographic Relevance | Impact Timeline |
|---|---|---|---|
| Soaring electrolyzer manufacturing overcapacity drives price collapse post-2026 | +6.2% | Global; strongest in Europe and China | Short term (≤ 2 years) |
| IRA-style production tax credits replicated in EU, India, Brazil | +5.8% | North America, EU, India, Brazil | Medium term (2-4 years) |
| Rise of green-premium procurement mandates by steel and ammonia buyers | +4.1% | EU, India, Japan, South Korea | Medium term (2-4 years) |
| Development of H₂ pipeline corridors in EU, U.S. Gulf, Middle East | +3.7% | EU, North America (Gulf Coast), Middle East | Long term (≥ 4 years) |
| Corporate PPAs bundling renewable power with H₂ offtake | +2.9% | Global; early traction in EU and Middle East | Medium term (2-4 years) |
| Breakthrough in solid-oxide electrolysis efficiency > 85% | +1.6% | Global; pilot sites in India and Europe | Long term (≥ 4 years) |
| Source: Mordor Intelligence | |||
Soaring electrolyzer manufacturing over-capacity drives price collapse post-2026
Global nameplate electrolyzer capacity hit 61-63 GW per year in 2025, but only 2.15 GW was operating, creating an oversupply that forced European alkaline prices down to USD 2,407 per kilowatt and PEM to USD 2,547per kilowatt.[1]HYDROGEN-CENTRAL, “Electrolyzer Manufacturing Overcapacity 2026 Price War,” hydrogen-central.com Chinese vendors control more than half of the installed factory capacity and are exporting modules below cost to maintain their share, impairing Western manufacturers’ margins. As hardware deflates, the unsubsidized levelized cost of green hydrogen is projected to fall toward USD 1.50–2.50 per kilogram in high-solar regions by 2030, overtaking blue hydrogen ranges burdened by escalating carbon-capture charges. The price war is accelerating final-investment decisions across the Middle East and India, two locations with abundant low-priced renewable electricity. However, plummeting module prices are squeezing working-capital lines for smaller OEMs, raising the prospect of sector consolidation over the next two years.
IRA-style production tax credits replicated in EU, India, Brazil
The U.S. Inflation Reduction Act’s 45V credit of up to USD 3 per kilogram for low-carbon hydrogen has become a global benchmark that Europe’s Hydrogen Bank, India’s SIGHT scheme, and Brazil’s pending incentive framework now mirror.[2]FINANCIAL TIMES, “IRA 45V Final Rules January 2025,” ft.com These subsidies establish predictable revenue floors, permitting developers to secure non-recourse debt at lower spreads. India alone earmarked USD 2.4 billion for electrolysis manufacturing and production incentives, triggering a 1 MTPA green-ammonia FID by AM Green.[3]FINANCIAL TIMES, “IRA 45V Final Rules January 2025,” ft.com Yet an accelerated sunset clause in the One Big, Beautiful Bill Act, which requires U.S. projects to start construction before January 1, 2028, prompted cancellations exceeding 4.9 MTPA in 2025, underscoring persistent policy risk.[4]BLOOMBERG, “Germany Renewable Curtailment 2024 Grid Fees,” bloomberg.com
Rise of green-premium procurement mandates by steel and ammonia buyers
European policymakers are weighing rules that oblige 25% low-carbon steel content from 2029 onward, forcing mills to lock in renewable hydrogen contracts well before spot markets mature. ArcelorMittal’s USD 1.16 billion Sestao DRI-EAF plant and H2 Green Steel’s 5 MTPA Boden complex embody this transition, each demanding up to 250,000 tonnes of hydrogen annually. Long-term offtake deals, such as Reliance-Samsung Engineering’s USD 3 billion, 15-year green ammonia contract, shift price exposure from producers to buyers. India’s Green Steel Taxonomy, defining compliant output at < 2.2 tCO₂/t-steel, provides a domestic demand pull.
Development of H₂ pipeline corridors in EU, U.S. Gulf and Middle East
The South2 Corridor, a 3,300 km network linking North Africa to Germany with 65% repurposed gas lines, targets an early-2030s start-up and 4 MTPA capacity. Europe’s Hydrogen Backbone envisages 39,700 km by 2040, pushing transport tariffs down to USD 0.13–0.24 per kg-km versus USD 0.52–0.75 for new pipelines. In the U.S., the HyVelocity Hub secured USD 1.2 billion in DOE grants to integrate more than 1,000 miles of legacy hydrogen lines on the Gulf Coast. Pipeline delivery can slash end-user costs by up to 50% beyond 200 km, anchoring new industrial clusters.
Restraints Impact Analysis*
| Restraint | (~) % Impact on CAGR Forecast | Geographic Relevance | Impact Timeline |
|---|---|---|---|
| 2030-onwards renewable power curtailment penalties | -2.4% | EU (Germany, Spain, Denmark) and spillover to UK | Medium term (2-4 years) |
| CCS cost inflation undermines blue-H₂ competitiveness | -3.1% | U.S. Gulf Coast, Canada, UAE, Saudi Arabia | Short term (≤ 2 years) |
| Delay in global H₂ certification interoperability | -1.8% | Global; acute on EU-Asia routes | Medium term (2-4 years) |
| Geopolitical risk around critical minerals for PEM stacks | -1.3% | Global; supply concentrated in South Africa | Long term (≥ 4 years) |
| Source: Mordor Intelligence | |||
2030-onwards renewable-power curtailment penalties (grid fees)
Germany curtailed 8.2 TWh of green power in 2024 and is introducing time-of-use tariffs that charge electrolyzers USD 5.8-17.4/MWh during surplus periods, undercutting assumptions of zero-cost energy. Similar dynamic-fee pilots are underway in Spain and Denmark. Because alkaline electrolyzers need 5-15 minutes to ramp, they cannot absorb volatility as quickly as lithium-ion storage, prompting regulators to favor batteries for grid balancing. EU rules also force hourly matching between renewable output and hydrogen production, limiting developers’ ability to arbitrage cheap imports across bidding zones. From 2030, grid penalties could add USD 0.20-0.50/kg to hydrogen costs, eroding competitiveness versus blue hydrogen in gas-rich regions.
CCS cost inflation undermines blue-H₂ competitiveness
Carbon-capture costs have climbed from USD 50-100/tCO₂ in 2025 toward an expected USD 80-150/tCO₂ by 2030 as equipment, permitting, and well-drilling expenses surge. CF Industries’ USD 4 billion Blue Point ammonia project illustrates the expense—CCS accounts for up to 40% of the capital stack. Lengthy approval cycles for U.S. Class VI wells and competition for pore space delay project timelines. As sequestration costs rise, blue hydrogen’s delivered price converges with subsidy-free green hydrogen in sunny geographies, narrowing the rationale for plants relying solely on reforming plus capture.
*Our forecasts treat driver/restraint impacts as directional, not additive. The impact forecasts reflect baseline growth, mix effects, and variable interactions.
Segment Analysis
By Production Method: Policy Arbitrage Favors Green Over Blue
Blue hydrogen retained 68.5% of the clean hydrogen market share in 2025, underscoring the early-mover advantage of reforming natural gas paired with carbon capture. Yet the green pathway is on a faster cadence, expanding at 34.6% CAGR through 2031 as falling electrolyzer costs compress the delivered price gap to less than USD 0.20 per kilogram in high-solar regions. That swing reduces the blue premium that once placed steam-reforming projects ahead on project finance models, especially where government incentives for captured carbon have begun to taper. Developers, therefore, continue to break ground on gigawatt-scale electrolysis clusters, such as the 219,000-tonne-per-year NEOM complex, which will anchor large export volumes into Asia.
From 2026 onward, the clean hydrogen market size attached to green projects eclipses blue in announced capacity, even though blue still dominates volumes in operation. CCS cost escalation, running from USD 50-100 per tonne in 2025 toward USD 80-150 per tonne by 2030, erodes blue’s price edge, while renewable energy additions, land-leasing reforms, and tax credits speed up electrolysis pipelines. Turquoise hydrogen and biomass gasification has low share of the clean hydrogen market size because of unproven carbon monetization and logistics barriers. Unless CCS price curves flatten, policy risk is expected to dilute further blue project pipelines, opening room for green to become the reference pathway in procurement tenders.


By Electrolyzer Technology: Alkaline Incumbency Faces PEM Disruption
Alkaline systems captured 58.9% of the clean hydrogen market size in 2025, benefiting from lower capital intensity and decades of deployment in the chlor-alkali industry. European module quotations slipped below USD 2,436 per kilowatt during 2025 as Chinese suppliers triggered a price war, widening their reach in export tenders. The PEM segment, however, is closing the gap, helped by iridium-loading reductions from 2-3 grams per kilowatt in 2020 to as low as 0.3-0.5 grams per kilowatt in 2025, cutting catalyst bills by more than 70%. Faster ramp rates and partial-load flexibility, reaching 10% of nameplate capacity in sub-second response, make PEM the preferred option for co-located wind-solar hybrids.
Solid-oxide electrolysis commands a smaller market share, yet pilot runs have logged 72% electrical efficiency and aim for stack-level efficiencies above 85% once industrial waste heat is harvested. That translates into a potential USD 0.30-0.80 per kilogram saving in markets where power costs exceed USD 40 per megawatt-hour, positioning SOEC for steel and ammonia complexes. Meanwhile, anion-exchange membrane prototypes promise PEM-like dynamics without noble metals, but lifetime validation past 40,000 hours is still lacking. Overall, the technology mix is tilting from cost-driven alkaline dominance toward a more balanced profile in which PEM and, later, SOEC carve out applications tied to flexible renewables and high-grade heat integration.
By Delivery Form: Compressed Gas Dominance Yields to Liquid & Ammonia Carriers
Compressed gas held 48.1% of 2025 volumes because tube-trailer logistics fit industrial clusters that sit within a few hundred kilometers of production sites. Even so, the clean hydrogen market size tied to liquid hydrogen is forecast to grow at 30.9% CAGR through 2031 as intercontinental trade takes shape. Japan’s 50,000-cubic-meter Ogishima terminal and Kawasaki’s 40,000-cubic-meter carrier, both under construction, will push delivered costs to below USD 2.32 per kilogram by the mid-2030s, unlocking Australia-to-Asia and Middle-East-to-Asia corridors.
Ammonia, with established maritime fleets and cracking technology, already accounts for a significant share of traded hydrogen equivalents. It stays attractive for fertilizer and marine fuel applications, even though synthesis adds an energy penalty. Liquid organic carriers, meanwhile, remain a niche share because the hydrogenation-dehydrogenation loop absorbs 30-40% of the original energy content. Over longer distances, pipeline delivery will still beat both liquid options on cost, provided repurposed natural-gas rights-of-way succeed in lowering tariff structures.
By Application: Transportation surges while industrial leads
Industrial segments dominated at 53.8% share in 2025, driven by ammonia and steel decarbonization. Direct-reduced iron plants such as ArcelorMittal’s Sestao and H2 Green Steel’s Boden facilities each need upward of 80,000 tonnes per year, anchoring baseload offtake. Power generation used a smaller share of volumes and faces battery competition, but gas turbines that burn 100% hydrogen are entering commercial trials as grid stability assets.
Transportation demand stands niche volumes but leads growth at 35.7% CAGR, propelled by heavy-duty trucking, rail, and early marine deployments. Hyundai logged more than 1,800 fuel-cell trucks worldwide by end-2025, and rail units such as Alstom’s Coradia iLint have proven competitive where catenary electrification costs exceed USD 10 million per kilometer. Aviation and long-haul shipping remain in demonstration because of volumetric density limits, yet policy incentives for zero-emission ports and airports could accelerate adoption after 2030. By then, the clean hydrogen market share for mobility may climb into low-double-digit territory, diversifying revenues beyond the industrial core.
Geography Analysis
Asia-Pacific led with 43.7% of 2025 volumes and should post the highest regional CAGR at 27.4% through 2031. China alone commissioned 25 of the 59 global projects that came online in 2025, including Sinopec’s 20,000-tonne-per-year Kuqa electrolyzer complex. India’s National Green Hydrogen Mission, backed by USD 2.05 billion in incentives, has seeded more than 1 MTPA of committed capacity across ammonia and mobility pilots. Japan is building import infrastructure that targets 3 MTPA by 2030 and 20 MTPA by 2050, signalling a structural pull on regional exports. Across ASEAN, Indonesia and Vietnam eye low-cost hydropower sites, though execution hinges on port permitting and bankable offtake deals.
Europe accounted for a significant share of the 2025 output but faces challenges due to increasing renewable curtailment penalties and strict temporal matching regulations. Germany curtailed 8.2 TWh of green power in 2024 and is rolling out dynamic grid fees that add USD 0.20-0.50 per kilogram to hydrogen costs. Still, the continent is knitting a pipeline backbone: the 3,300 km SoutH₂ Corridor and an 11,600 km first-phase Hydrogen Backbone by 2030. Major clusters in the Netherlands and Spain pair offshore-wind PPAs with 200-250 MW electrolyzers, anchoring refinery supply and export ambitions.
In North America, the U.S. Gulf Coast benefits from 1,000 miles of existing hydrogen pipelines and USD 1.2 billion in hub grants, but the accelerated 45V sunset forces projects to reach FID before 2028, triggering more than 4.9 MTPA of cancellations in 2025. Saudi Arabia’s NEOM complex leverages solar resources to deliver green ammonia at USD 1.50-2.50 per kilogram, advancing the region as an export powerhouse. Brazil expects to finalize incentives in 2026 and focus on ammonia export corridors, while South Africa’s platinum and iridium mines supply critical PEM catalysts, raising geopolitical stakes for material security.

Competitive Landscape
The market is fragmented in terms of consolidation standards. Industrial gas leaders Air Liquide, Linde, and Air Products continue to steer long-term offtake via their proprietary pipeline grids and refinery contracts. Air Liquide has earmarked USD 9.36 billion for low-carbon hydrogen and expects to triple hydrogen revenue to over USD 7.02 billion by 2035, leveraging Siemens-Energy stacks in its ELYgator project. Linde remains the lowest-cost supplier on the U.S. Gulf, pairing its nitrogen-hydrogen pipeline with CCS hubs to defend blue volumes until green methods are priced in.
Electrolyzer pure-plays Plug Power, Nel ASA, ITM Power, thyssenkrupp nucera, and Cummins compete on throughput and cost curves. Plug Power shipped 185 MW of PEM units in 2025 but still posted negative gross margins of –30%, highlighting the working-capital squeeze in a deflationary hardware cycle. Thyssenkrupp Nucera secured a 300 MW alkaline order for Moeve’s Onuba project, lifting its order backlog to USD 643.5-994.5 million for fiscal 2026. Nel ASA is doubling its Herøya factory capacity to lower U.S.-delivered costs below USD 400 per kilowatt once scale economies kick in.
Start-ups Enapter and Versogen chase anion-exchange membrane breakthroughs to cut noble-metal dependence, though commercial units beyond 10 MW are still two years out. Solid-oxide trailblazers Ceres Power and Bloom Energy bank on efficiency highs to offset higher stack prices, aiming at steel and process-heat verticals. Consolidation is likely as price wars widen; weaker balance sheets could trigger mergers or strategic exits, while incumbents may absorb specialist IP to secure supply-chain resilience.
Clean Hydrogen Industry Leaders
Air Liquide
Linde plc
Air Products
Shell
Engie
- *Disclaimer: Major Players sorted in no particular order

Recent Industry Developments
- March 2026: thyssenkrupp nucera won a 300 MW alkaline electrolyzer contract for Moeve’s Onuba project in Spain, slated to produce 45,000 tpa of green hydrogen and cut 250,000 tpa of CO₂.
- March 2026: bp - Iberdrola’s Castellón JV reached 90% completion of a 25 MW PEM electrolyzer that will supply 2,800 tpa of green hydrogen to bp’s refinery.
- February 2026: Air Liquide and Holcim agreed on a project to capture 1.1 million tpa of CO₂ at a Belgian cement plant using Cryocap OXY technology.
- November 2025: Kawasaki broke ground on the 50,000 m³ Ogishima liquid-hydrogen terminal, anchoring Japan’s 3 MTPA import target for 2030.


Global Clean Hydrogen Market Report Scope
Clean hydrogen refers to hydrogen produced with minimal or no greenhouse gas emissions, characterized by a low lifecycle carbon intensity. It is mainly generated through electrolysis powered by renewable energy sources (green hydrogen) or through the use of fossil fuels combined with carbon capture technologies.
The Clean Hydrogen Market is segmented into production method, electrolyzer technology, delivery form, application, and geography. By production method, the market is segmented into green hydrogen, blue hydrogen, turquoise hydrogen, and other production methods. By electrolyzer technology, the market is segmented into alkaline, PEM, solid-oxide, and anion-exchange electrolyzers. By delivery form, the market is segmented into compressed gas, liquid hydrogen, ammonia, and LOHC. By application, the market is segmented into transportation, industrial, power generation, and other applications. The report also covers the market size and forecasts for the clean hydrogen market across major regions, including North America, Europe, Asia-Pacific, South America, and the Middle East and Africa. For each segment, the market sizing and forecasts have been done on the basis of volume (tons).
| Green Hydrogen |
| Blue Hydrogen |
| Turquoise (Pyrolysis) Hydrogen |
| Others |
| Alkaline |
| PEM |
| Solid-Oxide |
| Anion-Exchange |
| Compressed Gas |
| Liquid Hydrogen |
| Ammonia |
| LOHC |
| Transportation (FCEV, Rail, Marine, Aviation) |
| Industrial (Ammonia Production, Methanol Production, Steelmaking, etc) |
| Power Generation |
| Others |
| North America | United States |
| Canada | |
| Mexico | |
| Europe | Germany |
| United Kingdom | |
| France | |
| Italy | |
| NORDIC Countries | |
| Russia | |
| Rest of Europe | |
| Asia-Pacific | China |
| India | |
| Japan | |
| South Korea | |
| ASEAN Countries | |
| Rest of Asia-Pacific | |
| South America | Brazil |
| Argentina | |
| Rest of South America | |
| Middle East and Africa | Saudi Arabia |
| United Arab Emirates | |
| South Africa | |
| Egypt | |
| Rest of Middle East and Africa |
| By Production Method | Green Hydrogen | |
| Blue Hydrogen | ||
| Turquoise (Pyrolysis) Hydrogen | ||
| Others | ||
| By Electrolyzer Technology | Alkaline | |
| PEM | ||
| Solid-Oxide | ||
| Anion-Exchange | ||
| By Delivery Form | Compressed Gas | |
| Liquid Hydrogen | ||
| Ammonia | ||
| LOHC | ||
| By Application | Transportation (FCEV, Rail, Marine, Aviation) | |
| Industrial (Ammonia Production, Methanol Production, Steelmaking, etc) | ||
| Power Generation | ||
| Others | ||
| By Geography | North America | United States |
| Canada | ||
| Mexico | ||
| Europe | Germany | |
| United Kingdom | ||
| France | ||
| Italy | ||
| NORDIC Countries | ||
| Russia | ||
| Rest of Europe | ||
| Asia-Pacific | China | |
| India | ||
| Japan | ||
| South Korea | ||
| ASEAN Countries | ||
| Rest of Asia-Pacific | ||
| South America | Brazil | |
| Argentina | ||
| Rest of South America | ||
| Middle East and Africa | Saudi Arabia | |
| United Arab Emirates | ||
| South Africa | ||
| Egypt | ||
| Rest of Middle East and Africa | ||


Key Questions Answered in the Report
How large will global demand for clean hydrogen be by 2031?
The clean hydrogen market size is forecast to reach 13.75 MTPA by 2031, expanding at a 25.03% CAGR from 2026 levels.
Which production pathway is growing the fastest?
Green hydrogen, powered by renewable electrolysis, is projected to grow at 34.6% CAGR through 2031 as incentives and falling hardware prices narrow the cost gap with blue hydrogen.
What region leads current consumption?
Asia-Pacific held 43.7% of 2025 volumes and is expected to keep the lead with a 27.4% CAGR, driven by China, India, and Japans import build-out.
Which electrolyzer technology will gain share by 2031?
PEM units are set to gain share thanks to modular container designs and swift ramp rates, growing at 32.3% CAGR, although alkaline systems still anchor baseload projects.
What is the biggest short-term cost driver?
A global oversupply of electrolyzer manufacturing capacity is forcing module prices lower, compressing green hydrogen costs toward USD 1.50-2.50 per kilogram in sunny regions by the decades end.
How fragmented is the supplier landscape?
With the top five companies controlling about 45% of shipped capacity, the market is moderately fragmented, leaving room for new entrants and consolidation alike.
Page last updated on:


