Market Overview
| Study Period | 2021 - 2031 |
|---|---|
| Forecast Data Period | 2026 - 2031 |
| Historical Data Period | 2021 - 2024 |
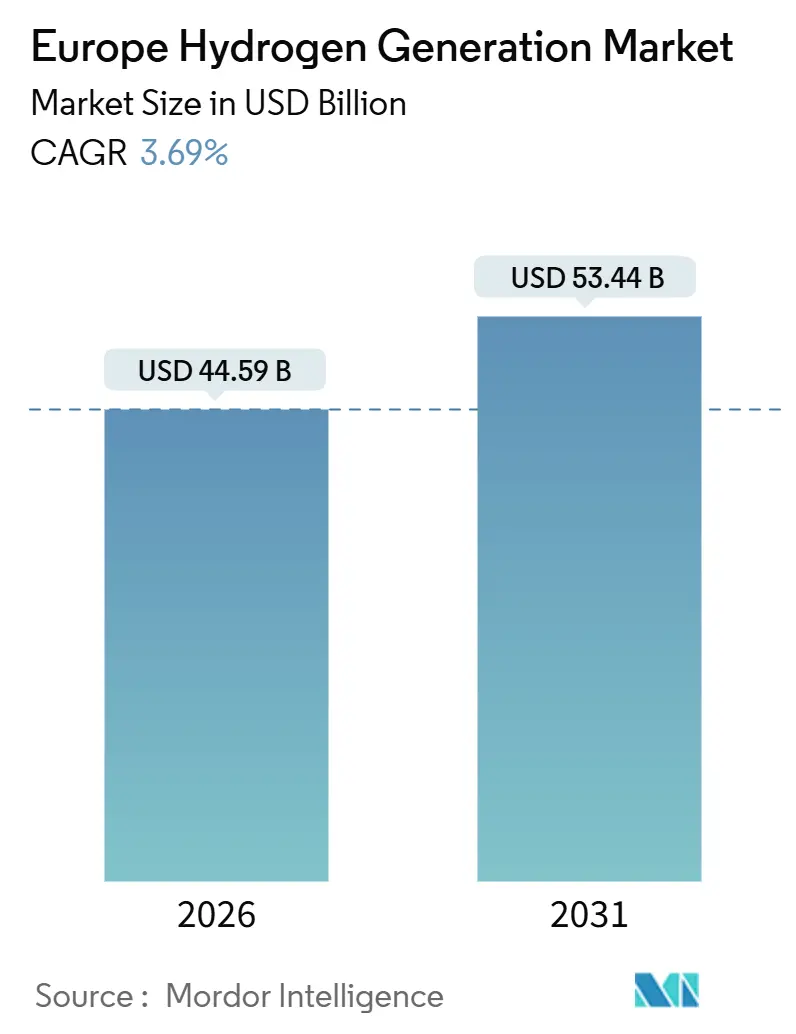
| Market Size (2026) | USD 44.59 Billion |
| Market Size (2031) | USD 53.44 Billion |
| Growth Rate (2026 - 2031) | 3.69% CAGR |
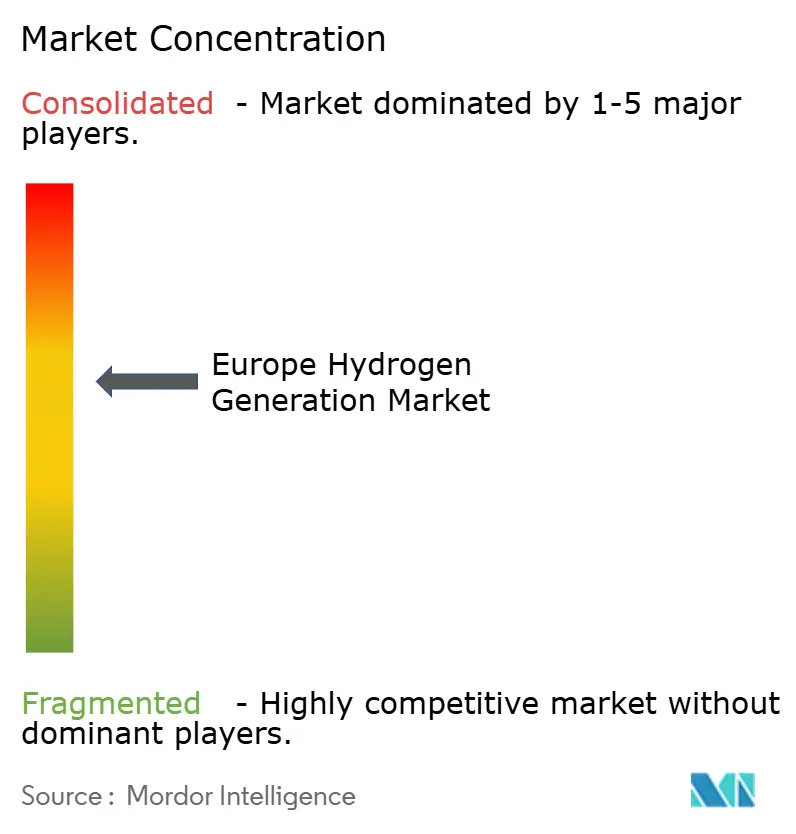
| Market Concentration | Medium |
Major Players *Disclaimer: Major Players sorted in no particular order Image © Mordor Intelligence. Reuse requires attribution under CC BY 4.0. | |
Europe Hydrogen Generation Market Analysis by Mordor Intelligence
The Europe Hydrogen Generation Market size is estimated at USD 44.59 billion in 2026, and is expected to reach USD 53.44 billion by 2031, at a CAGR of 3.69% during the forecast period (2026-2031).
Near-term growth stays measured because additionality and hourly-matching rules under the 2025 RFNBO delegated act force developers to pair electrolysers with new renewable capacity instead of existing grid power, slowing commissioning schedules yet safeguarding long-run emissions integrity.[1]European Commission, “Renewable Energy Targets,” energy.ec.europa.eu Even so, the European Hydrogen Generation Market is pivoting structurally as green hydrogen capacity scales 25.5% annually, propelled by falling electrolyser capital costs, expanding corporate net-zero commitments, and Build-Back-Green funding windows that offset the EUR 2-3 per kilogram cost premium over grey supply.[2]International Energy Agency, “Global Hydrogen Review 2024,” iea.org Offshore-wind-rich Denmark, Iberia, and the Netherlands now treat hydrogen as a flexible offtake for curtailed renewables, while Germany counts on its Wasserstoffkernetz pipeline to import volumes and stabilize domestic demand.[3]FNB Gas, “Hydrogen Core Network,” fnb-gas.de Competitive dynamics are fragmenting: industrial-gas majors hold scale advantages in legacy steam-methane-reforming (SMR) assets, yet electrolyser specialists and integrated utilities are winning gigawatt orders that accelerate the green transition.[4]Air Liquide, “Normandy Electrolyser,” airliquide.com
Key Report Takeaways
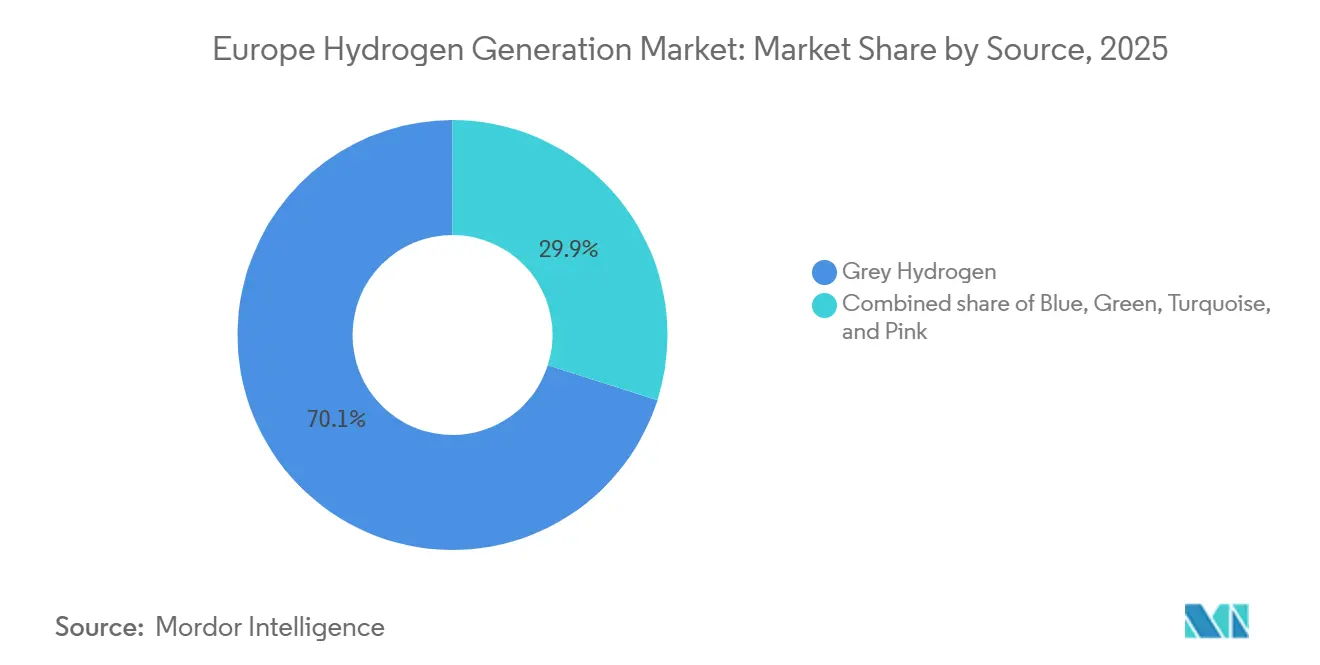
- By source, grey hydrogen held 70.1% of the European hydrogen generation market share in 2025, while green hydrogen is advancing at a 25.5% CAGR through 2031.
- By technology, steam-methane reforming accounted for 60.9% of the European hydrogen generation market size in 2025, whereas electrolysis is projected to expand at a 22.9% CAGR by 2031.
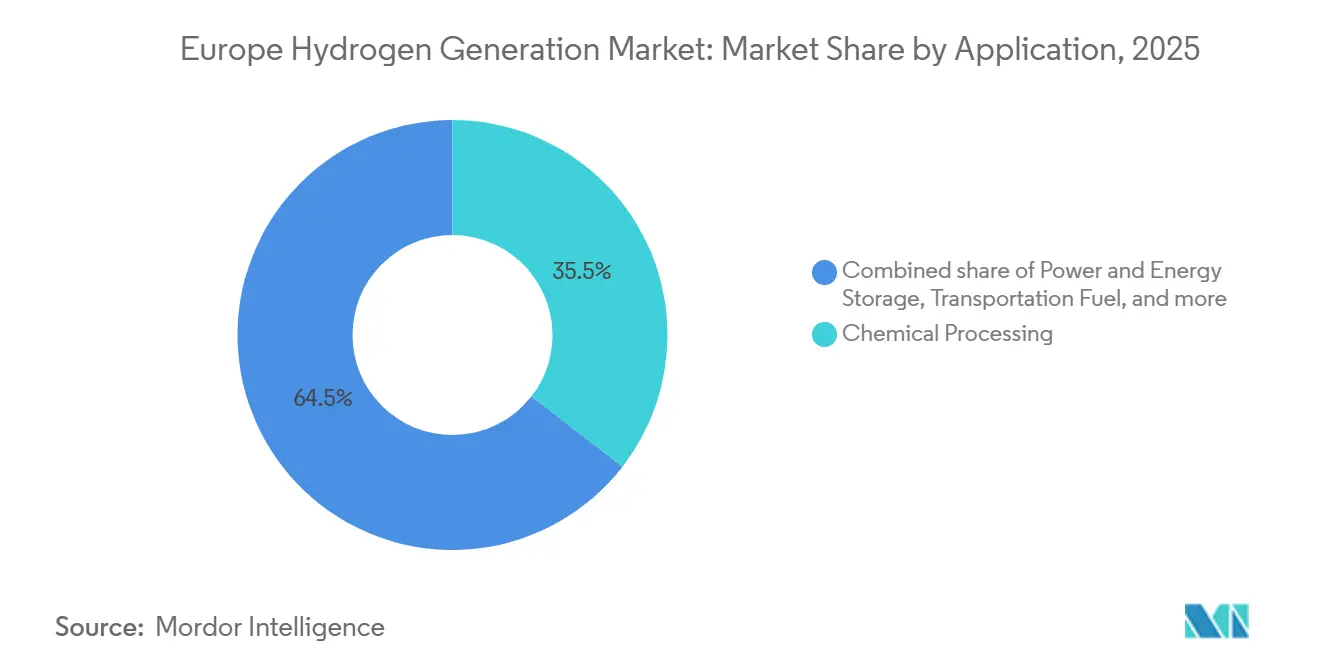
- By application, chemical processing captured 35.5% of 2025 revenue; transportation fuel demand is forecast to grow at a 30.1% CAGR to 2031.
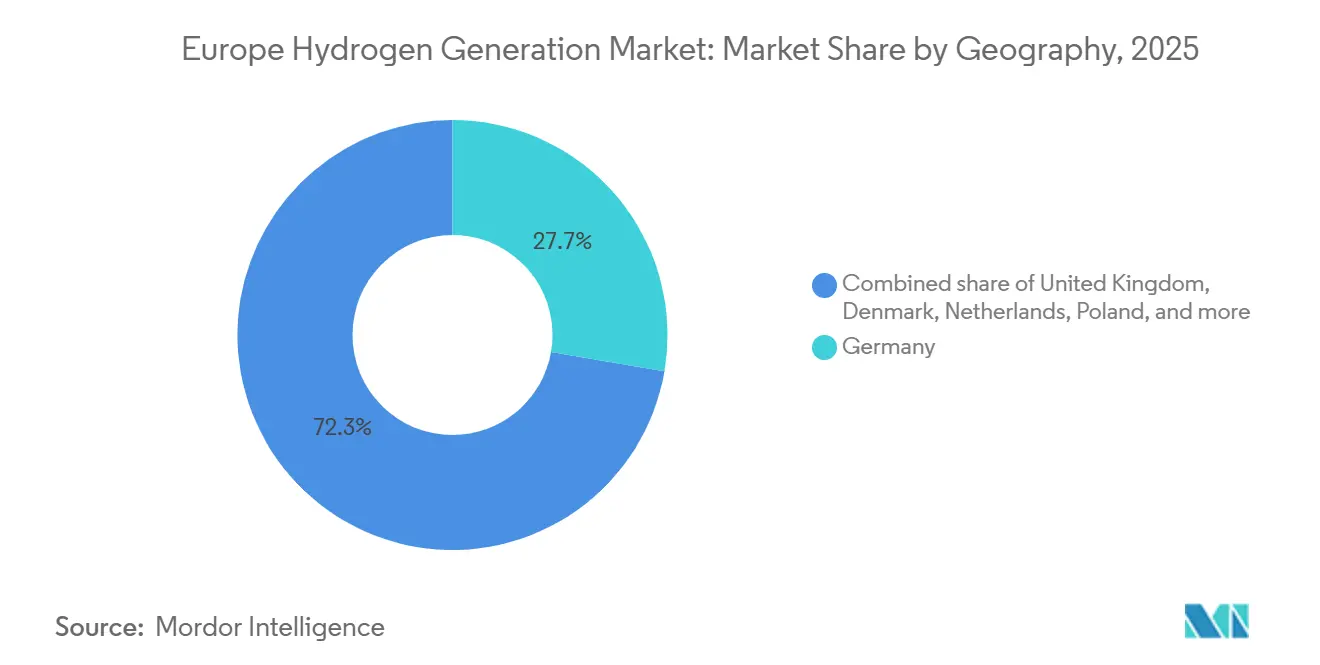
- By geography, Germany commanded 27.7% of 2025 consumption, while Denmark is the fastest-growing country with a 14.8% CAGR through 2031.
Note: Market size and forecast figures in this report are generated using Mordor Intelligence’s proprietary estimation framework, updated with the latest available data and insights as of January 2026.
Europe Hydrogen Generation Market Trends and Insights
Drivers Impact Analysis*
| Driver | (~) % Impact on CAGR Forecast | Geographic Relevance | Impact Timeline |
|---|---|---|---|
| EU “Fit-for-55” & Green Deal mandates | 1.20% | EU-27, UK, Norway | Medium term (2-4 years) |
| Electrolyser cost decline (scale & learning curves) | 0.90% | Germany, Netherlands, Denmark, Spain | Long term (≥ 4 years) |
| Corporate net-zero commitments (heavy industry & mobility) | 0.70% | Germany, France, Italy, Sweden | Medium term (2-4 years) |
| EU funding: IPCEI, Horizon Europe, CEF, ETS Innovation Fund | 0.60% | Pan-EU, led by Germany, France, Netherlands | Short term (≤ 2 years) |
| North-Sea offshore-wind curtailment delivering near-zero-cost power | 0.40% | Denmark, Netherlands, UK, Germany (coastal) | Medium term (2-4 years) |
| Repurposing gas grid into “Hydrogen Backbone” | 0.30% | Germany, Netherlands, Belgium, France | Long term (≥ 4 years) |
| Source: Mordor Intelligence | |||
EU “Fit-for-55” & Green Deal Mandates
Binding EU targets of 10 million tonnes of domestic renewable hydrogen and 10 million tonnes of imports by 2030 elevate demand certainty despite near-term cost headwinds. Germany’s 2023 strategy earmarked USD 8.1 billion across electrolysis and import corridors, while France allocated USD 7.9 billion through 2030 for industrial decarbonization. July 2025 RFNBO rules introduced additionality and hourly matching, deliberately slowing deployment yet locking in carbon integrity that derisks private capital. Member-state auctions, H₂Global in Germany and France’s “Hydrogène décarboné” tenders, guarantee offtake prices for ten years, narrowing the grey-green cost gap. Collectively, these measures push the European Hydrogen Generation Market toward structurally lower emissions pathways while providing bankability for first-mover projects.
Electrolyser Cost Decline (Scale & Learning Curves)
Alkaline system prices fell from EUR 1,300 per kW in 2020 to EUR 600-800 per kW by late 2025 as gigafactories came online, achieving parity with imported Chinese stacks. thyssenkrupp nucera’s 20 MW modules and Nel’s 3.5 MW stacks now ship at sub-EUR 700 per kW, while Sunfire’s SOEC pilots show 10-15 percentage-point efficiency gains, albeit at higher capex. Learning curves of 18-22% per capacity doubling suggest that announced gigafactories in Hungary and Berlin will drive alkaline costs below EUR 400 per kW by 2029, positioning green hydrogen for parity in wind-rich zones. Falling equipment prices translate directly into project-level levelized cost reductions, compressing the time needed for the European Hydrogen Generation Market to decouple from subsidies.
Corporate Net-Zero Commitments (Heavy Industry & Mobility)
ArcelorMittal’s Hamburg DRI-H₂ plant, operational since September 2025, soaks up 100,000 tonnes of hydrogen yearly, proving that steel can switch from blast furnaces when hydrogen clears below EUR 3.50 kg. Thyssenkrupp Steel Europe secured USD 2.2 billion in German aid for twin 500 MW electrolysers by 2028, targeting 3 million tonnes of low-carbon steel by 2030. In mobility, Daimler Truck and Volvo’s cellcentric JV ordered 1 GW of fuel-cell systems in 2025, anchoring demand for trucking corridors across Germany and the Netherlands. These corporate procurement signals underpin long-term offtake contracts that lend project-finance credibility to new green-hydrogen capacity.
EU Funding: IPCEI, Horizon Europe, CEF, ETS Innovation Fund
Across three hydrogen IPCEI waves, Brussels cleared USD 5.9 billion in state aid for 41 projects by December 2025, clustering capital around German, French, and Dutch industrial hubs. The ETS Innovation Fund’s 2025 call disbursed USD 3.5 billion to build 17 projects, including H2 Green Steel’s 800 ktpa plant in Sweden and Air Liquide’s 200 MW electrolyser in Normandy. Horizon Europe’s Clean Hydrogen Partnership invested USD 1.2 billion in next-gen membranes and ammonia cracking R&D during 2024-2025, shortening the path-to-market for catalyst-light electrolysers. Meanwhile, the Connecting Europe Facility set aside USD 812 million for cross-border pipelines, cementing midstream economics that broaden the reachable market for Iberian and North Sea volumes.
Restraints Impact Analysis*
| Restraint | (~) % Impact on CAGR Forecast | Geographic Relevance | Impact Timeline |
|---|---|---|---|
| High LCOH gap versus grey H₂ without robust carbon price | -0.80% | EU-wide, acute in Germany, Poland, Italy | Short term (≤ 2 years) |
| Renewable-power availability constraints for large-scale electrolysis | -0.50% | Germany, Poland, France, Southern Europe | Medium term (2-4 years) |
| Iridium/Pt metal shortages limiting PEM electrolyser scaling | -0.30% | Global, affecting EU PEM manufacturers | Medium term (2-4 years) |
| Public opposition to CCS infrastructure for blue hydrogen | -0.20% | Netherlands, UK, Norway | Long term (≥ 4 years) |
| Source: Mordor Intelligence | |||
High LCOH Gap vs. Grey H₂ Without Robust Carbon Price
Green hydrogen averaged EUR 4.50-6.50 kg in 2025 against EUR 1.80-2.30 kg for grey, leaving a EUR 2.70-4.20 gap that sub-EUR 75 t ETS prices do not yet close. Germany’s 2024 carbon contracts-for-difference pay a EUR 4.00 kg strike price but covered only 1.2 GW in the first auction, well below the 10 GW 2030 target. The European Hydrogen Bank’s fixed-premium auctions offer EUR 0.40-0.48 kg for ten years; while helpful, reliance on public finance exposes projects to shifting fiscal priorities after 2027. Until EUA prices clear EUR 90-110 t, merchants will hedge but delay large free-market purchases, capping the expansion speed of the European Hydrogen Generation Market.
Renewable-Power Availability Constraints for Large-Scale Electrolysis
Germany generated 295 TWh of renewable electricity in 2025, yet congestion and seasonality limited electrolysers to 3,200-3,800 full-load hours, inflating levelized hydrogen cost by EUR 0.80-1.50 kg. Poland’s coal phase-out extends to 2049, delaying renewable build-out needed for gigawatt electrolysis. France’s nuclear-driven pink hydrogen strategy confines volumes to regional clusters, while limited interconnections keep Iberian surplus locked south of the Pyrenees until pipelines are completed in 2030. Underutilized electrolysers degrade project IRRs and postpone some capacity additions within the European Hydrogen Generation Market.
*Our forecasts treat driver/restraint impacts as directional, not additive. The impact forecasts reflect baseline growth, mix effects, and variable interactions.
Segment Analysis
By Source – Transition Dynamics Accelerate
Europe's hydrogen generation market size for grey hydrogen equaled USD 31.0 billion in 2025, representing 70.1% of volume, but its share slips below 55% by 2031 as renewable-powered routes outpace legacy. Green output grows 25.5% a year, leveraging falling capex and Fit-for-55 demand guarantees; this surge elevates green hydrogen value to USD 12.6 billion by 2031, translating into notable Europe hydrogen generation market share gains for electrolytic producers. Blue hydrogen rises modestly on projects with ≥90% CO₂ capture but remains capped by public resistance to CCS infrastructure, while turquoise and pink routes fill niche needs in polymer and nuclear-anchored clusters. Altogether, the shifting source mix confirms a managed glidepath rather than an abrupt switch, smoothing cash-flow risk for incumbent gas suppliers yet opening room for new entrants with RFNBO-compliant volumes.
Second-order effects appear in gas-market hedging and ammonia trade flows. Refiners sign three- to five-year bridge contracts for blue hydrogen while awaiting green parity, whereas chemical majors lean into green-ammonia exports that monetize RFNBO premium credits. As a result, optionality across source routes becomes a hedge strategy, allowing corporate buyers to straddle compliance deadlines without disrupting core operations.


By Technology – Electrolysis Leads New Capex
Steam-methane reforming still anchors 60.9% of installed capacity in 2025 but sees minimal net additions because the EU taxonomy flags unabated units as non-sustainable. Alkaline electrolysis commands 55% of new orders on the lowest capex, whereas PEM captures high-dynamic applications tied to offshore wind and heavy-duty mobility. Solid-oxide systems promise 75-85% round-trip efficiency when integrated with industrial waste-heat streams, but commercial scale materializes only after 2028. Across the forecast window, electrolysis technology advances raise cumulative electrolyser shipments to 55 GW, equating to USD 23 billion of equipment revenue and firmly embedding the European hydrogen generation market within the broader clean-tech manufacturing race.
Competitive overlap widens: industrial-gas incumbents integrate captive electrolysers to shield downstream distribution, utilities co-develop balance-of-plant with OEMs to extract margin along the value chain, and OEMs pursue pay-for-performance service contracts to offset hardware commoditization. Patent filings for low-iridium PEM stacks and nickel-based AEM designs underscore this technology arms race and set up future market-share realignments.
By Application – Mobility Surges, Chemicals Hold Base Load
Chemical processing retained 35.5% of demand in 2025 and grows steadily as fertilizer and methanol producers decarbonize feedstock. Yet transportation fuels register the fastest compound growth at 30.1% through 2031, led by fuel-cell trucks, e-methanol bunkering, and power-to-liquid aviation blends. Iron and steel follow, climbing 18.5% annually as direct-reduced-iron projects ramp in Germany and Sweden. Refinery use declines in both absolute and relative terms due to plant closures and renewable-diesel blending mandates. Power-storage pilots and district-heating trials remain marginal until 2030, when curtailed wind and nuclear-flex programs may unlock gigawatt-scale demand.
The application split therefore hedges sectoral risk: steady chemical offtake underpins baseline revenues, while mobility and steel provide upside volume to accelerate electrolyser learning curves inside the European hydrogen generation market.
Geography Analysis
Germany’s market share leadership rests on heavy industrial demand yet faces renewable bottlenecks that curb electrolyser load factors; the Wasserstoffkernnetz mitigates those limits after 2028. Denmark’s outsized CAGR is a function of export-oriented mega-projects that monetize curtailed offshore wind, but revenue relies on stable German and Dutch offtake contracts. The Netherlands balances import terminal scale with domestic refineries and chemicals, keeping utilization robust even before cross-border tariffs harmonize.
France’s pink pathway lowers carbon intensity quickly but may struggle to meet EU RFNBO labels unless additionality rules evolve for nuclear. Spain and Italy convert solar advantage into hydrogen derivatives destined for shipping and aviation, contingent upon pipeline and ammonia-carrier logistics. The United Kingdom moves on blue clusters backed by CCS subsidies, while Norway exports blue volumes and CO₂ storage services, anchoring North-Sea integration. Poland’s late start defers volume but positions it for post-2035 acceleration once coal retirements free capacity.
Competitive Landscape
Industrial-gas majors, Air Liquide, Linde, and Air Products, still control nearly half of total nameplate capacity by leveraging decades-old SMR and pipeline networks. Electrolyser OEMs, Nel, thyssenkrupp nucera, ITM Power, Plug Power, dominate new green-hydrogen orders yet scramble to secure catalyst supply. Utilities (RWE, Engie, Iberdrola) and oil majors (TotalEnergies, Shell, Equinor) deploy integrated models that couple renewables, electrolysers, and large offtake deals, compressing margins for pure-play equipment vendors. Technology differentiation is narrowing at 60-70% system efficiency and EUR 600-900 kW price points, shifting rivalry toward balance-sheet strength, offtake contracting, and RFNBO certification expertise. Emerging disruptors, Enapter (AEM), Sunfire (SOEC), Haldor Topsoe (ammonia cracking), target specific pain points like iridium scarcity and derivative storage.
The European hydrogen generation market thus reflects a mid-level concentration where the top five players hold just under 50%, encouraging both cooperation on infrastructure and rivalry on technology roadmaps.
Europe Hydrogen Generation Industry Leaders
Linde PLC
Air Liquide
Engie SA
Air Products
Plug Power
- *Disclaimer: Major Players sorted in no particular order

Recent Industry Developments
- January 2026: Keele University has established an on-campus green hydrogen hub to produce, store, and utilize renewable hydrogen for heat, power, and transport. The project integrates electrolysers with renewable electricity, serving as a living laboratory to demonstrate scalable hydrogen production while fostering skills, research, and regional hydrogen ecosystem development in the UK.
- December 2025: Spain allocated EUR 126.4 million to two renewable hydrogen projects through its first national auction-as-a-service scheme, supporting approximately 160 MW of electrolyser capacity. This funding enhances domestic green hydrogen production for industrial and fuel applications, aiding decarbonization in hard-to-abate sectors and solidifying Spain’s role as a leading European hydrogen producer.
- May 2025: The European Commission approved a EUR 400 million Spanish State aid scheme under the European Hydrogen Bank to support renewable hydrogen production. The initiative funds new electrolysers, facilitates large-scale hydrogen output, and reduces CO₂ emissions, aligning with EU climate goals, industrial decarbonization, and energy security through competitive production-based mechanisms.
- April 2025: The EU is supporting a EUR 400 million Spanish initiative to expand renewable hydrogen production via the European Hydrogen Bank’s auction mechanism. The funding will enable hundreds of megawatts of electrolyser capacity, attract private investment, and accelerate green hydrogen deployment for industry and transport, strengthening Spain’s role in Europe’s clean energy transition.


Europe Hydrogen Generation Market Report Scope
Hydrogen generation is defined as the process by which hydrogen is manufactured in commercial volumes for usage in various industrial and consumer end-user applications.
The European hydrogen generation market is segmented by source, technology, application, and geography. By source, the market is segmented into blue, green, grey, turquoise, and pink hydrogen. By technology, the market is segmented into steam methane reforming (SMR), coal gasification, ATR, POX, and electrolysis. By application, the market is segmented into oil refining, chemical processing, iron & steel, transportation fuel, power & energy storage, and residential & commercial heating. By geography, the market is segmented into Germany, the Netherlands, Poland, Spain, Italy, and the rest of Europe. For each segment, the market sizing and forecasts for each segment are based on the revenue generated (in USD).
By Source
| Grey Hydrogen |
| Blue Hydrogen |
| Green Hydrogen |
| Turquoise Hydrogen |
| Pink Hydrogen |
By Technology
| Steam Methane Reforming (SMR) |
| Coal Gasification |
| Auto-Thermal Reforming (ATR) |
| Partial Oxidation (POX) |
| Electrolysis (Alkaline Electrolysis, Proton Exchange Membrane (PEM), Solid Oxide Electrolysis (SOE)) |
By Application
| Oil Refining |
| Chemical Processing (Ammonia, Methanol) |
| Iron and Steel (DRI, H₂-BF) |
| Transportation Fuel (FCEV, Marine, Aviation) |
| Power and Energy Storage |
| Residential and Commercial Heating |
By Geography
| Germany |
| France |
| United Kingdom |
| Netherlands |
| Spain |
| Italy |
| Norway |
| Denmark |
| Poland |
| Russia |
| Rest of Europe |
| By Source | Grey Hydrogen |
| Blue Hydrogen | |
| Green Hydrogen | |
| Turquoise Hydrogen | |
| Pink Hydrogen | |
| By Technology | Steam Methane Reforming (SMR) |
| Coal Gasification | |
| Auto-Thermal Reforming (ATR) | |
| Partial Oxidation (POX) | |
| Electrolysis (Alkaline Electrolysis, Proton Exchange Membrane (PEM), Solid Oxide Electrolysis (SOE)) | |
| By Application | Oil Refining |
| Chemical Processing (Ammonia, Methanol) | |
| Iron and Steel (DRI, H₂-BF) | |
| Transportation Fuel (FCEV, Marine, Aviation) | |
| Power and Energy Storage | |
| Residential and Commercial Heating | |
| By Geography | Germany |
| France | |
| United Kingdom | |
| Netherlands | |
| Spain | |
| Italy | |
| Norway | |
| Denmark | |
| Poland | |
| Russia | |
| Rest of Europe |


Key Questions Answered in the Report
How large is the Europe hydrogen generation market in 2026?
The market is valued at USD 44.59 billion in 2026, on track for USD 53.44 billion by 2031.
What CAGR is expected for hydrogen generation in Europe to 2031?
A compound annual growth rate of 3.69% is forecast for 2026-2031.
Which technology segment is growing fastest?
Electrolysis, led by alkaline and PEM systems, is expanding at 22.9% a year.
Which country shows the highest growth?
Denmark posts a 14.8% CAGR owing to large offshore wind-to-hydrogen export projects.
What constrains rapid green hydrogen adoption?
The cost gap with grey hydrogen and limited renewable-power availability are key restraints.
Who are the leading industry players?
Air Liquide, Linde, Air Products, Nel, thyssenkrupp nucera, and ITM Power dominate current capacity and project pipelines.
Page last updated on:


