Market Overview
| Study Period | 2021 - 2031 |
|---|---|
| Forecast Data Period | 2026 - 2031 |
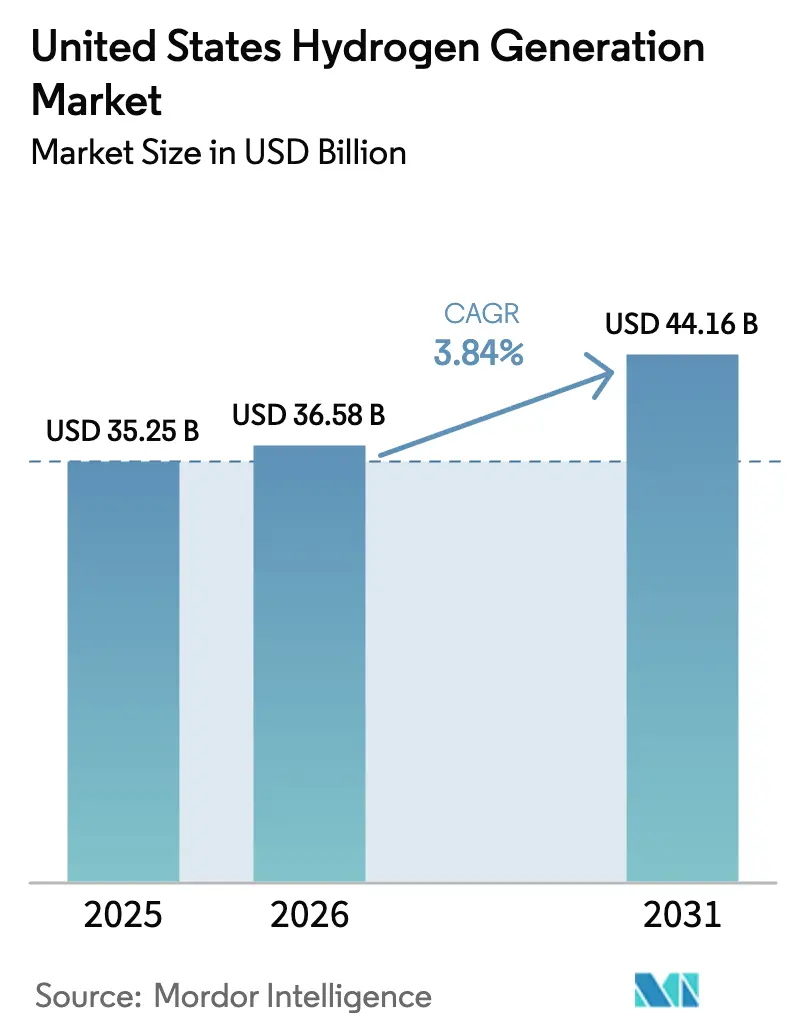
| Base Year Market Size (2025) | USD 35.25 Billion |
| Market Size (2026) | USD 36.58 Billion |
| Market Size (2031) | USD 44.16 Billion |
| Growth Rate (2026 - 2031) | 3.84% CAGR |
| Market Concentration | Medium |
Major Players *Disclaimer: Major Players sorted in no particular order Image © Mordor Intelligence. Reuse requires attribution under CC BY 4.0. | |
United States Hydrogen Generation Market Analysis by Mordor Intelligence
The United States Hydrogen Generation Market size is projected to expand from USD 35.25 billion in 2025 and USD 36.58 billion in 2026 to USD 44.16 billion by 2031, registering a CAGR of 3.84% between 2026 to 2031.
This steady topline masks a sharp change in composition, as green hydrogen from electrolysis benefits from Section 45V tax credits, while incumbent grey hydrogen producers face shrinking margins when offtakers demand verified carbon-intensity disclosures. The Department of Energy’s (DOE) seven Regional Clean Hydrogen Hubs, funded with USD 7 billion, are bundling production and demand clusters that lower delivered costs by 20–30% compared with merchant trucking.[1]U.S. Department of Energy, “Regional Clean Hydrogen Hubs,” Energy.gov, energy.gov Industrial gas leaders are pairing legacy steam-methane-reforming (SMR) assets with carbon capture to qualify for mid-tier 45V incentives, while electrolyzer specialists are exploiting negative-price renewable power windows, especially in Texas and California. Infrastructure constraints remain significant: fewer than 1,600 miles of dedicated hydrogen pipelines add USD 2–4 per kg in logistics costs beyond 150 miles, and water-use permitting for 100 MW electrolysis projects can delay schedules 12–18 months in arid states.[2]U.S. Environmental Protection Agency, “Water Permits,” EPA, epa.gov
Key Report Takeaways
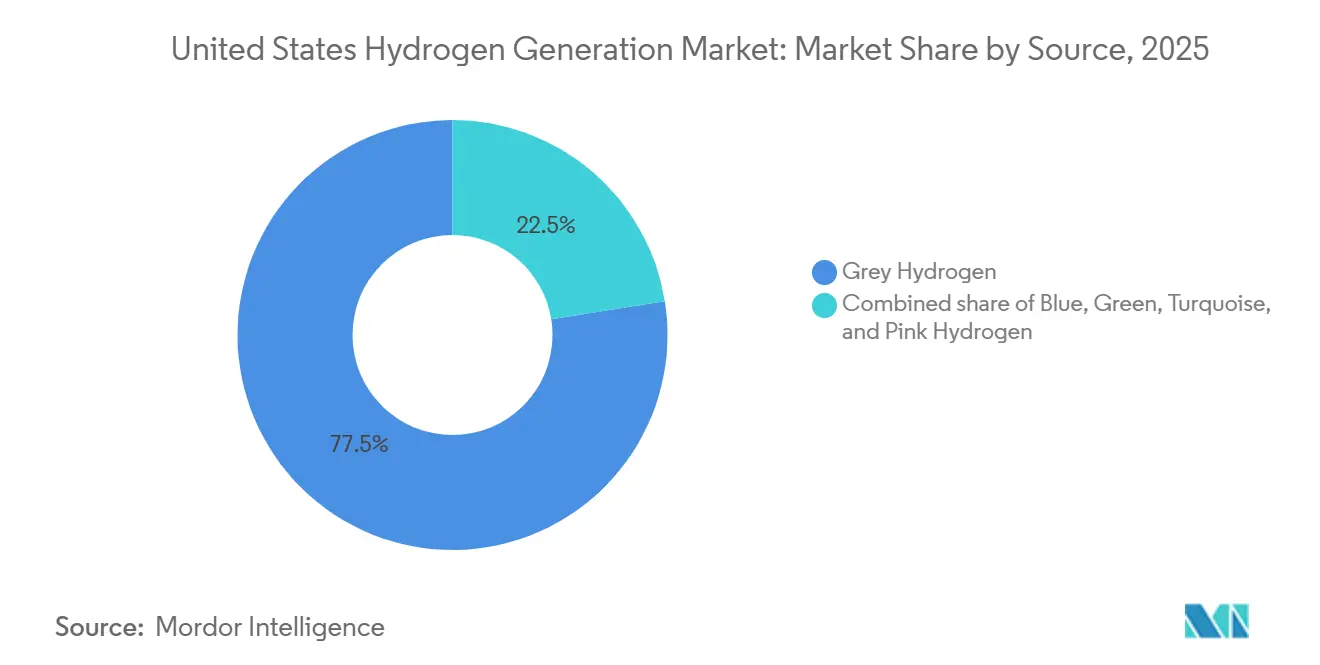
- By source, grey hydrogen held 77.5% of the United States hydrogen generation market share in 2025, while green hydrogen is projected to expand at a 32.9% CAGR through 2031.
- By technology, steam methane reforming (SMR) commanded 72.9% of 2025 capacity, whereas electrolysis is forecast to grow at 29.5% CAGR to 2031.
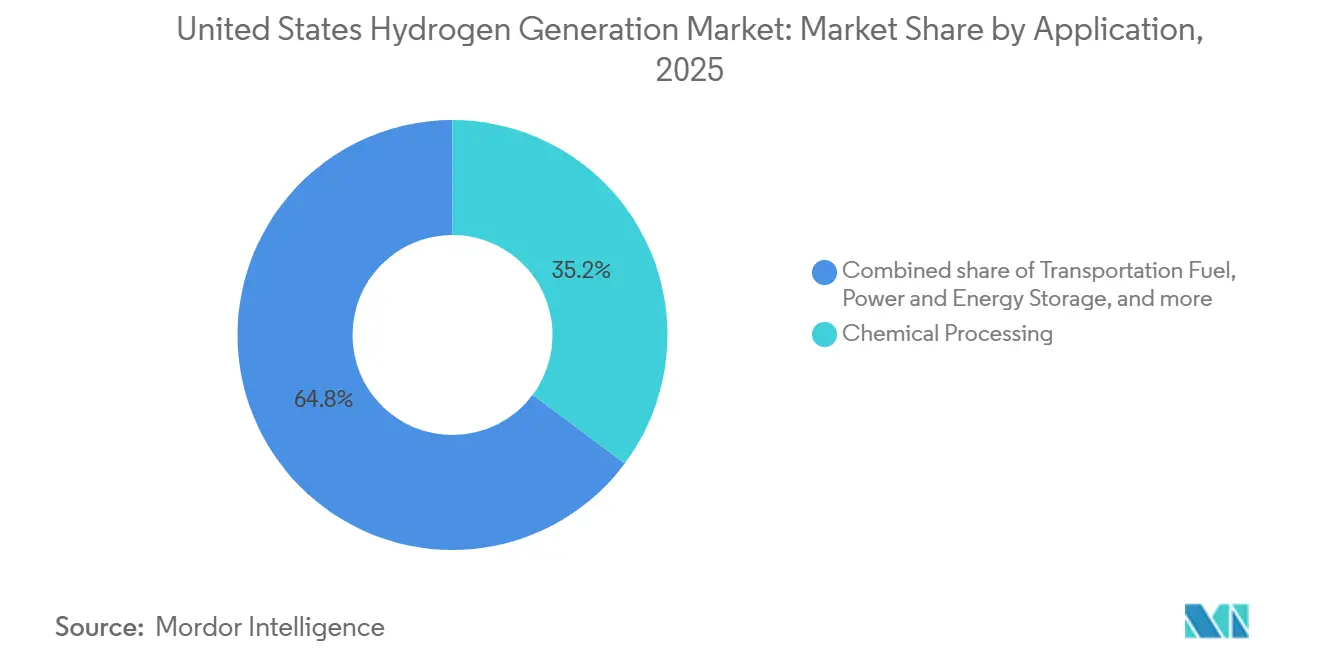
- By application, chemical processing accounted for 35.2% of demand in 2025, whereas transportation fuels are advancing at a 30.4% CAGR through 2031.
Note: Market size and forecast figures in this report are generated using Mordor Intelligence’s proprietary estimation framework, updated with the latest available data and insights as of January 2026.
United States Hydrogen Generation Market Trends and Insights
Drivers Impact Analysis*
| Driver | (~) % Impact on CAGR Forecast | Geographic Relevance | Impact Timeline |
|---|---|---|---|
| Inflation Reduction Act production tax credits | +1.2% | Gulf Coast, California, Midwest hubs | Medium term (2–4 years) |
| U.S. decarbonization mandates in hard-to-abate sectors | +0.8% | States with carbon pricing or low-carbon fuels (CA, WA, OR) | Long term (≥ 4 years) |
| Refinery and ammonia retrofits for blue hydrogen | +0.6% | Gulf Coast and Midwest ammonia belt | Short term (≤ 2 years) |
| DOE Regional Clean Hydrogen Hubs funding | +0.7% | Seven hub regions nationwide | Medium term (2–4 years) |
| Curtailment-driven offtake for stranded renewables | +0.5% | Texas (ERCOT), California (CAISO), Midwest wind corridors | Short term (≤ 2 years) |
| Source: Mordor Intelligence | |||
Inflation Reduction Act Production Tax Credits
Section 45V, effective January 2025, offers up to USD 3 per kg for hydrogen with lifecycle emissions below 0.45 kg CO₂e per kg H₂, verified through the GREET model.[3]Internal Revenue Service, “Section 45V – Clean Hydrogen Production Credit,” IRS, irs.gov The credit is transferable for 10 years, cutting the project's weighted-average cost of capital by roughly 150 basis points. To qualify, developers must co-locate electrolyzers with new renewable assets and match electricity hourly, a requirement that raises capital by 20–30% but guarantees the carbon-intensity threshold. The incentive has prompted dozens of gigawatt-scale electrolyzer announcements, yet progress to final investment decision remains selective as developers navigate procurement bottlenecks and long interconnection queues. The credit’s certainty is enabling structured power-purchase agreements where off-peak wind and solar are monetized into low-carbon fuel rather than spilled on the grid.
U.S. Decarbonization Mandates Across Hard-to-Abate Sectors
State policies such as California’s 2024 Low Carbon Fuel Standard amendment award compliance credits worth USD 1.20–1.50 per kg for green hydrogen in heavy-duty transport.[4]California Air Resources Board, “Low Carbon Fuel Standard,” CARB, arb.ca.gov Steelmakers are testing hydrogen injection in blast furnaces to replace up to 30% of coking coal; Cleveland-Cliffs expects its Indiana Harbor pilot to start in 2026 under a USD 150 million retrofit. Similar trials are underway in cement and glass, reinforcing hydrogen’s role where electrification is impractical. Federal procurement guidelines finalized in 2026 now favor low-carbon inputs, nudging public-works contractors toward certified hydrogen. Absent a nationwide carbon price, adoption clusters in coastal and Great Lakes states that combine renewable overbuild with explicit carbon-intensity targets.
Rising Refinery & Ammonia Retrofit Demand for Blue Hydrogen
Gulf Coast refineries processed about 8 million bbl/d in 2025 and are adding carbon capture to legacy SMR units. ExxonMobil’s Baytown project will remove 90% of CO₂ from a 1.5 million t/yr hydrogen plant by late 2026, unlocking mid-tier 45V credits. CF Industries is engineering carbon capture for 2 million t/yr CO₂ at its Donaldsonville ammonia site, with blue ammonia exports planned for 2028. These upgrades extend the life of depreciated assets while aligning with European carbon-border tariffs coming into force in 2026. The retrofit pathway is capital-light compared with greenfield electrolysis, but hinges on access to pipeline and saline sequestration storage concentrated in Texas and Louisiana.
DOE Hydrogen Hub Funding Unlocking Regional Projects
The DOE disbursed USD 1–1.5 billion in 2024–2025 for Phase 1 of seven Regional Clean Hydrogen Hubs, covering front-end engineering and permitting. The Gulf Coast hub targets 1.2 million t/yr of blue and green hydrogen by 2030, leveraging existing pipelines and salt-dome storage. The Appalachian hub pairs SMR with carbon sequestration in depleted gas fields to supply fertilizer and metals plants at delivered costs below USD 2 per kg. Timelines have slipped 6–12 months because of National Environmental Policy Act reviews and tight electrolyzer supply lines, pushing first volumes into 2028–2029. Even with delays, the program de-risks first-of-a-kind projects by pooling offtake and providing federal credit enhancement that trims financing spreads by up to 150 basis points.
Restraints Impact Analysis*
| Restraint | % Impact on CAGR Forecast | Geographic Relevance | Impact Timeline |
|---|---|---|---|
| High levelized cost of hydrogen vs. grey | -0.9% | Regions without carbon pricing or low-carbon fuel standards | Short term (≤ 2 years) |
| Sparse pipeline and storage infrastructure | -0.6% | Nationwide except Gulf Coast petrochemical corridor | Medium term (2–4 years) |
| Volatile natural-gas prices for SMR producers | -0.4% | Highest in Northeast and California | Short term (≤ 2 years) |
| Water-use permitting for electrolysis | -0.3% | Southwest, Great Plains, and other arid or water-restricted states | Medium term (2–4 years) |
| Source: Mordor Intelligence | |||
High LCOH Versus Incumbent Gray Hydrogen
Unabated SMR delivers hydrogen to Gulf Coast buyers at USD 1.00–1.50 per kg, whereas grid-connected electrolysis costs USD 4.00–6.00 per kg prior to incentives. Even with the full USD 3 credit, delivered green hydrogen often sits at USD 1.50–2.50 per kg, a 50–100% premium that most ammonia and refinery offtakers cannot absorb without explicit carbon pricing. Blue hydrogen narrows the gap at USD 2.00–2.50 per kg before credits but requires available sequestration sites and durable CO₂ offtake contracts. Declining electrolyzer capex, now USD 800–900 per kW for PEM, will compress the delta, yet parity with grey hydrogen is generally expected closer to 2030, absent further policy support.
Sparse Hydrogen Pipeline & Storage Infrastructure
The nation’s hydrogen network totals less than 1,600 miles, forcing most producers to rely on tube trailers that add USD 2–4 per kg for trips longer than 150 miles. Air Products is constructing a USD 500 million, 100-mile pipeline from its Louisiana complex to Baton Rouge, the first greenfield line of the decade. Low-cost salt-cavern storage at USD 0.10–0.20 per kg is limited to Gulf Coast domes, leaving many hubs dependent on compressed or liquefied tanks costing USD 1.00–2.00 per kg. The absence of common-carrier access raises merchant price volatility and adds 200–300 basis points to project hurdle rates, slowing investment outside established industrial corridors.
*Our forecasts treat driver/restraint impacts as directional, not additive. The impact forecasts reflect baseline growth, mix effects, and variable interactions.
Segment Analysis
By Source: Grey Dominance Meets Green Acceleration
Grey hydrogen controlled 77.5% of 2025 output due to more than 100 aging SMR facilities clustered around Gulf Coast refineries and Midwest ammonia plants. These units, many long since depreciated, deliver product below USD 1 per kg when natural gas remains near USD 3 per MMBtu, maintaining viability absent federal carbon fees. Blue hydrogen capacity is rising as operators bolt carbon capture onto existing reformers; ExxonMobil’s Baytown upgrade will sequester 1.3 million t/yr CO₂ from 2026, and CF Industries’ Donaldsonville scheme targets 2 million t/yr by 2028. Turquoise hydrogen via methane pyrolysis remains niche, Monolith Materials’ Nebraska facility produces 14,000 t/yr, but could scale if the solid carbon black by-product wins long-term tire-industry contracts. Pink hydrogen pilots from Exelon and Constellation illustrate nuclear-powered electrolysis potential, yet licensing frameworks for coupling nuclear plants and hydrogen offtake are still evolving.
Green hydrogen occupied only 3–4% of 2025 volumes, yet its 32.9% CAGR positions it to reach 15–20% penetration by 2031. Plug Power’s 120 MW hydropower-backed plant in Rochester, online since December 2025, produces 50 t/day at roughly USD 2.50 per kg pre-credit. California’s mandate for 100% zero-emission drayage trucks by 2035 underpins a dozen refueling stations planned by Air Liquide and Shell around the Los Angeles basin. Overall, the United States hydrogen generation market size for green pathways could exceed USD 9 billion by 2031 if announced projects reach nameplate capacity, while grey revenues plateau amid tightening disclosure rules.


By Technology: Electrolysis Gains Despite SMR Incumbency
Steam methane reforming held 72.9% market share in 2025 and remains the benchmark for capital efficiency, with build costs of USD 500–700 per daily kilogram versus USD 1,200–1,500 for electrolysis. Nonetheless, electrolysis is expanding at a 29.5% CAGR as Section 45V narrows the cost gap and renewable overbuild accelerates. Cummins’ 1 GW alkaline electrolyzer factory in Minnesota underpins Heartland hub demand, while Plug Power’s PEM technology enables rapid cycling for frequency regulation markets in Amazon logistics centers. Solid oxide electrolysis could lift system efficiency to 80–85% by harnessing waste heat; Bloom Energy’s 2 MW pilot with Idaho National Laboratory is testing integration with nuclear generation at target costs of USD 1.50–2.00 per kg.
Auto-thermal reforming (ATR) is the favored route for new blue projects because integrated oxygen feed lifts pressures and improves carbon capture rates above 90%. Air Products’ 750,000 t/yr ATR facility in Louisiana aims for 95% CO₂ removal and commissioning in 2027. Coal gasification and partial oxidation, prominent in older Appalachian installations, are declining as operators retire high-emission assets rather than retrofit carbon capture. As electrolyzer costs head toward DOE’s USD 400 per kW 2030 goal, the United States hydrogen generation market share attributable to electrolysis could overtake ATR and partial oxidation combined within the decade.
By Application: Chemical Processing Anchors, Transportation Accelerates
Chemical processing consumed 35.2% of hydrogen in 2025, heavily weighted toward ammonia synthesis of roughly 8 million t/yr and methanol at 3 million t/yr. Ammonia exporters face EU carbon border tariffs beginning in 2026, propelling blue hydrogen retrofits to secure market access. Oil refining represents a similar magnitude of demand and is retrofitting desulfurization trains to cut sulfur emissions while minimizing disruption to crude-throughput economics. Marathon Petroleum’s Garyville refinery committed USD 300 million in 2025 to add carbon capture, underscoring the trend.
Transportation is the fastest-growing end use, expanding at a 30.4% CAGR as Class 8 fuel-cell trucks roll out nationally. Hyundai delivered 50 Xcient trucks in 2024, and Nikola and Daimler expect to launch series production by 2027. California already operates 55 public stations, but early utilization sits below 40%, suggesting upside as heavy-duty fleets scale. Iron and steel demand remains below 5% but could surge if Cleveland-Cliffs scales its Indiana Harbor pilot; full conversion would require up to 1 million t/yr hydrogen by 2030. Power-generation trials, such as Los Angeles Department of Water and Power’s 250 MW hydrogen-capable turbine from Mitsubishi, illustrate hydrogen’s role in long-duration storage, though round-trip efficiency penalties currently confine deployment to strategic grid applications.
Geography Analysis
The Gulf Coast, encompassing Texas and Louisiana, supplied more than half of 2025 production thanks to abundant low-cost gas, 1,600 miles of hydrogen pipelines, and offshore sequestration geology. The DOE-backed Gulf Coast hub targets 1.2 million t/yr by 2030, anchored by Air Products’ USD 4 billion green complex and ExxonMobil’s Baytown blue upgrade. Average delivered costs hover near USD 1.50 per kg for grey hydrogen and USD 2 per kg for blue, underpinning a robust export platform for ammonia and liquefied hydrogen.
California and the Pacific Northwest form the second cluster, driven by renewable curtailment, stringent vehicle mandates, and low-carbon fuel credits worth USD 1.20–1.50 per kg. The Pacific Northwest hub leverages hydropower and prospective offshore wind to supply port operations in Seattle and Portland. Electrolysis projects in these states routinely qualify for the top-tier 45V incentive, lifting internal rates of return above 12% despite higher capex.
The Midwest, stretching from Iowa through the Dakotas, is emerging as a blue-and-green node anchored by the Heartland hub. Wind capacity factors exceeding 45% support low-cost electrolytic hydrogen for fertilizer plants, while depleted gas formations offer CO₂ storage for blue projects. Hydrogen delivery still relies on truck or rail as pipelines remain sparse, but planned blended-gas repurposing could unlock 500 miles of corridor by 2029.
The Northeast and Mid-Atlantic grapple with high natural-gas prices and limited sequestration geology, steering developers toward small green hydrogen projects. Plug Power’s Niagara Falls plant sells directly to material-handling fleets, bypassing pipeline bottlenecks. The Mid-Atlantic hub focuses on aviation and maritime decarbonization, with airport fuel contracts that justify higher delivered prices of USD 3 per kg post-credit.
Competitive Landscape
Industrial gas majors, Air Products, Linde (including Praxair), Air Liquide, and Messer, collectively control roughly 60–65% of the 2025 United States hydrogen generation market supply through integrated SMR plants, pipeline networks, and take-or-pay contracts. They defend their share by retrofitting carbon capture to qualify for blue hydrogen credits and by leveraging long relationships with refinery and chemical customers. Air Products reached a final investment decision on a USD 4 billion Louisiana green hydrogen complex in January 2026, illustrating the scale incumbents can marshal.
Challengers concentrate on electrolysis. Plug Power combines PEM stack manufacturing with project development; 300 MW of capacity commissioned in 2025 positions the firm to sell USD 1 billion worth of hydrogen by 2028. Cummins’ Fridley gigafactory supplies alkaline stacks to Heartland hub projects, while Nel ASA and ITM Power partner with utilities for California and Texas deployments. Utilities such as NextEra Energy are integrating hydrogen into solar-plus-battery portfolios, pursuing 200 MW of electrolysis in Florida to soak up curtailed generation.
Niche opportunities arise in distributed 10–50 MW plants serving data centers and industrial parks that cannot access Gulf Coast pipelines. Bloom Energy’s high-temperature solid-oxide technology co-locates with combined heat-and-power systems, offering 80-plus % efficiency where waste heat is available. Methane pyrolysis start-ups Monolith Materials and C-Zero market turquoise hydrogen that avoids CO₂ emissions and water consumption; scalability depends on contracting the solid carbon by-product into tires and specialty chemicals.
Patent activity is intensifying around membrane-electrode-assembly materials. Linde filed a 2024 patent for titanium-coated bipolar plates that lower PEM stack cost by 15%, while Air Liquide focuses on advanced ionomer chemistry. The step-change in innovation signals a move toward mass-manufactured stacks, widening the field beyond traditional gas suppliers.
United States Hydrogen Generation Industry Leaders
Linde Plc
Air Liquide SA
Air Products and Chemicals Inc.
Plug Power Inc.
Cummins Inc.
- *Disclaimer: Major Players sorted in no particular order


Recent Industry Developments
- January 2026: Duke Energy Florida introduced the DeBary Hydrogen Production Storage System, the first U.S. facility to produce, store, and combust 100% green hydrogen. Powered by on-site solar and electrolyzers, the project enhances grid flexibility and demonstrates utility-scale hydrogen integration, supporting clean energy initiatives in Florida.
- January 2026: Honda announced the closure of its U.S. fuel cell production facility as part of a strategic shift in its hydrogen business. This decision reflects the slower adoption of fuel-cell vehicles and redirects investment toward next-generation hydrogen technologies and partnerships, signaling a reevaluation of hydrogen commercialization in the U.S. market.
- October 2025: Scientists in the U.S. have created a method to produce hydrogen from wastewater through advanced electrochemical and catalytic processes. This innovation converts organic waste into clean hydrogen, reducing treatment costs and providing renewable fuel, offering a sustainable approach to hydrogen generation and circular-economy solutions.
- August 2025: NextChem, a subsidiary of Maire, obtained a U.S. contract to license and engineer its NX eBlue technology for low-carbon hydrogen production. The project aims to decarbonize industrial hydrogen supply and expand domestic capacity for blue and low-carbon hydrogen applications using proprietary processes.


United States Hydrogen Generation Market Report Scope
Hydrogen generation is an industrial process for generating hydrogen gas from diverse domestic resources, including fossil fuels, biomass, and water electrolysis with electricity. There are several processes to produce hydrogen, such as natural gas reforming/gasification, electrolysis, renewable liquid reforming, and fermentation.
The United States hydrogen generation market is segmented by source, technology, application, and geography. By source, the market is segmented into blue, green, grey, turquoise, and pink hydrogen. By technology, the market is segmented into steam methane reforming (SMR), coal gasification, auto-thermal reforming (ATR), partial oxidation (POX), and electrolysis (alkaline electrolysis, proton exchange membrane (PEM), and solid oxide electrolysis (SOE)). By application, the market is segmented into oil refining, chemical processing, iron & steel, transportation fuel, power & energy storage, and residential & commercial heating. The report also covers the market size and forecasts for the United States hydrogen generation market across major countries. For each segment, the market sizing and forecasts have been done based on revenue (USD Billion).
By Source
| Grey Hydrogen |
| Blue Hydrogen |
| Green Hydrogen |
| Turquoise Hydrogen |
| Pink Hydrogen |
By Technology
| Steam Methane Reforming (SMR) |
| Coal Gasification |
| Auto-Thermal Reforming (ATR) |
| Partial Oxidation (POX) |
| Electrolysis (Alkaline Electrolysis, Proton Exchange Membrane (PEM), Solid Oxide Electrolysis (SOE)) |
By Application
| Oil Refining |
| Chemical Processing (Ammonia, Methanol) |
| Iron and Steel (DRI, H₂-BF) |
| Transportation Fuel (FCEV, Marine, Aviation) |
| Power and Energy Storage |
| Residential and Commercial Heating |
| By Source | Grey Hydrogen |
| Blue Hydrogen | |
| Green Hydrogen | |
| Turquoise Hydrogen | |
| Pink Hydrogen | |
| By Technology | Steam Methane Reforming (SMR) |
| Coal Gasification | |
| Auto-Thermal Reforming (ATR) | |
| Partial Oxidation (POX) | |
| Electrolysis (Alkaline Electrolysis, Proton Exchange Membrane (PEM), Solid Oxide Electrolysis (SOE)) | |
| By Application | Oil Refining |
| Chemical Processing (Ammonia, Methanol) | |
| Iron and Steel (DRI, H₂-BF) | |
| Transportation Fuel (FCEV, Marine, Aviation) | |
| Power and Energy Storage | |
| Residential and Commercial Heating |


Key Questions Answered in the Report
How large is the United States hydrogen generation market in 2026?
The United States hydrogen generation market size is USD 36.58 billion in 2026 and is forecast to reach USD 44.16 billion by 2031.
Which source type holds the biggest share of U.S. hydrogen output?
Grey hydrogen from unabated steam-methane reforming held 77.5% of production in 2025, mainly in Gulf Coast refineries and Midwest ammonia plants.
What policy is driving green hydrogen economics in the U.S.?
Section 45V of the Inflation Reduction Act pays up to USD 3 per kg for hydrogen with lifecycle emissions below 0.45 kg CO2e, sharply improving project returns.
Where are hydrogen pipeline networks most extensive?
More than half of U.S. hydrogen pipelines, including a 1,600-mile network, are concentrated along the Texas and Louisiana Gulf Coast industrial corridor.
Which application segment is growing fastest?
Transportation fuels, especially heavy-duty fuel-cell trucks and buses, are expanding at 30.4% CAGR on the back of California and federal zero-emission mandates.
Who are the leading companies in U.S. hydrogen generation?
Air Products, Linde (including Praxair), Air Liquide, and Messer dominate merchant supply, while Plug Power and Cummins are rapidly scaling green hydrogen projects.
Page last updated on:


