
China Solid Waste Management Market Size and Share
Market Overview
| Study Period | 2020 - 2031 |
|---|---|
| Forecast Data Period | 2026 - 2031 |
| Base Year Market Size (2025) | USD 150.38 Billion |
| Market Size (2026) | USD 158.99 Billion |
| Market Size (2031) | USD 209.57 Billion |
| Growth Rate (2026 - 2031) | 5.68 % |
| Market Concentration | Medium |
Major Players *Disclaimer: Major Players sorted in no particular order Image © Mordor Intelligence. Reuse requires attribution under CC BY 4.0. | |
China Solid Waste Management Market Analysis by Mordor Intelligence
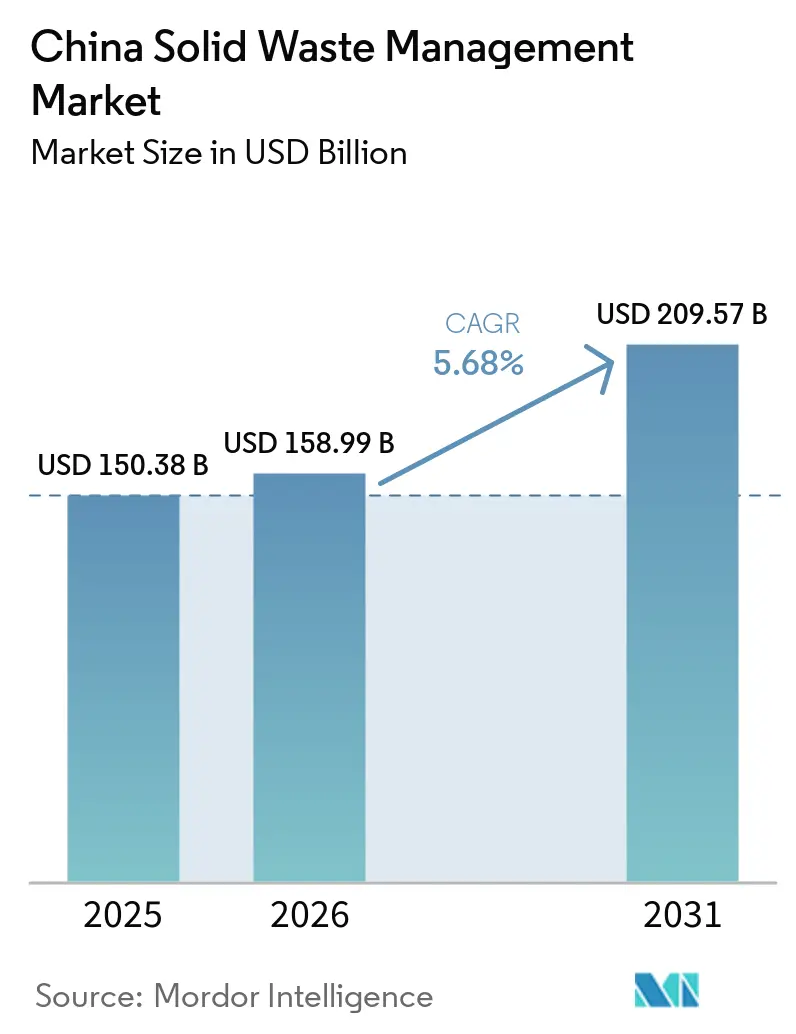
The China Solid Waste Management Market size is expected to grow from USD 150.38 billion in 2025 to USD 158.99 billion in 2026 and is forecast to reach USD 209.57 billion by 2031 at 5.68% CAGR over 2026-2031.
The market is supported by rapid urbanization, broader mandatory waste classification coverage across prefecture-level cities, and a more complex industrial base that is increasing both the volume and risk profile of waste streams. The circular economy agenda under recent national policy has shifted capital toward recycling, hazardous waste treatment, and digital oversight, steadily reducing the role of basic landfill disposal in the formal system. Policy direction has also become more explicit, with the February 2024 State Council opinions establishing a target of CNY 5 trillion (USD 701.4 billion) in annual output for the resource recycling industry by 2025, while the January 2026 action plan extended resource utilization targets through 2030. Urban environmental infrastructure spending reached CNY 521.0 billion (USD 7 billion) in 2024, underscoring the depth of state support for near-term treatment, collection, and remediation projects. In contrast, larger operators with stronger balance sheets and broader service portfolios are better positioned to absorb compliance and technology upgrade costs than smaller rivals.
Key Report Takeaways
- By service type, Treatment and Disposal accounted for 40% of China's solid waste management market share in 2025, while Waste-to-Energy is forecast to grow at a 12.1% CAGR through 2031.
- By waste type, Municipal Solid Waste accounted for 47% of the China solid waste management market share in 2025, while Medical Waste is projected to expand at a 10.8% CAGR through 2031.
- By source, Residential held 60% of revenue in 2025, while Industrial is forecast to grow at a 7.3% CAGR through 2031.
Note: Market size and forecast figures in this report are generated using Mordor Intelligence’s proprietary estimation framework, updated with the latest available data and insights as of January 2026.
China Solid Waste Management Market Trends and Insights
Drivers Impact Analysis*
| Driver | (~) % Impact on CAGR Forecast | Geographic Relevance | Impact Timeline |
|---|---|---|---|
| "Zero-Waste City" Pilot Program Accelerating Integrated Waste Management Infrastructure | +1.5% | National, concentrated in 113 prefecture-level cities and 8 special regions. | Short term (≤ 2 years) |
| Rapid Urbanization and Mega-City Expansion Driving Municipal Solid Waste Generation | +1.2% | Central and Southern China, with spillover into Western tier-2 and tier-3 cities | Medium term (2-4 years) |
| Strong Government Support for Waste-to-Energy Capacity Expansion and Energy Recovery | +0.9% | Nationwide, concentrated in Eastern and Southern coastal provinces | Short term (≤ 2 years) |
| Mandatory Waste Classification Policies Expanding Source Segregation Across Major Cities | +0.7% | National, including prefecture-level cities and county-level jurisdictions | Short term (≤ 2 years) |
| Growth of Electric Vehicle and Electronics Manufacturing Increasing Industrial and Hazardous Waste Treatment Demand | +0.5% | Eastern coastal manufacturing hubs and Central provinces | Medium term (2-4 years) |
| National Circular Economy Strategy Boosting Recycling of Plastics, Metals, and Construction Waste | +0.4% | National, with priority in industrial corridors and urban agglomerations | Long term (≥ 4 years) |
| Source: Mordor Intelligence | |||
"Zero-Waste City" Pilot Program Accelerating Integrated Waste Management Infrastructure
The Zero-Waste City program supports integrated treatment systems across China's solid waste management market. The 14th Five-Year Plan designated 113 prefecture-level cities and 8 special regions as construction sites, supporting over 3,700 demonstration projects with cumulative investment exceeding CNY 1 trillion (USD 140 billion). These projects cover community sorting, industrial by-product recovery, and regional recycling facilities. The framework connects waste reduction with resource recovery and lower emissions. Local governments must secure financing to accelerate implementation in financially stronger coastal municipalities. The program expands concession operators’ role beyond disposal. Integrated facilities can combine collection, sorting, recycling, energy recovery, and treatment of industrial by-products. This model increases the value recovered from each waste stream when collection quality remains sufficient. The June 2026 circular economy framework is expected to extend this policy direction through 2030, supporting a longer pipeline of infrastructure and service contracts across China's solid waste management market.
Rapid Urbanization and Mega-City Expansion Driving Municipal Solid Waste Generation
Urban growth is increasing demand for collection and processing services in China's solid waste management market. Kitchen waste continues to account for about 57.8% of urban and rural domestic waste, requiring anaerobic digestion, composting, leachate management, and treatment of residual waste streams. This highlights the need for operators capable of managing multiple treatment routes. Expansion into tier-3 and tier-4 cities is widening the addressable service base as per-capita waste generation continues to converge with that of major metropolitan areas. New facilities require reliable logistics networks and sufficient waste volumes to operate advanced treatment assets efficiently. Diversified operators can integrate wet-waste processing, recyclable-waste sorting, and residual-waste incineration, while single-technology facilities face increasingly variable feedstocks as source separation and recycling improve. Urbanization continues to create new concession opportunities while also changing the operational requirements of existing waste management facilities.
Strong Government Support for Waste-to-Energy Capacity Expansion and Energy Recovery
Waste-to-energy remains a key non-landfill treatment route in the Chinese solid waste management market. By the end of 2025, China had 1,137 waste incineration facilities with a processing capacity of 1.18 million tons per day. Feed-in tariffs, carbon-credit eligibility, and construction support have helped build this capacity. Policy now favors higher thermal efficiency and more market-based revenue. Operators are upgrading boilers, implementing combined heat and power, and utilizing fly ash. Eastern and Southern China have a higher concentration of advanced plants. However, 38% of waste-to-energy plants function mainly as disposal facilities rather than energy generators. These sites need efficiency gains as subsidies decline. The national 2030 goal of a 76% urban waste recycling utilization rate will also change the calorific content reaching incinerators. These conditions favor operators that improve plant performance and use multiple revenue streams.
Mandatory Waste Classification Policies Expanding Source Segregation Across Major Cities
Mandatory classification has become a core operating condition in China's solid waste management market. By the end of 2025, it is expected to cover virtually all residential communities in 297 prefecture-level cities and above. The system drives demand for separate collection, specialized transport, and material recovery capacity. Source-sorted municipal waste offers 44.7% higher energy recovery potential than mixed waste and 57.6% higher power generation potential. Therefore, sorting quality remains important to the economics of recycling and energy recovery. Shaanxi introduced a new municipal solid waste classification framework in July 2025, extending waste-sorting implementation beyond major urban centers to additional counties and smaller cities as part of the province's broader circular economy and environmental management strategy. County-level coverage expands demand for equipment, collection systems, and public engagement. However, compliance varies sharply between urban and rural areas, with smaller cities and rural areas often showing weaker enforcement and lower participation. Environmental performance measures give local governments a stronger incentive to improve classification outcomes, supporting continued spending on sorting infrastructure and community programs.
Restraints Impact Analysis*
| Restraint | (~) % Impact on CAGR Forecast | Geographic Relevance | Impact Timeline |
|---|---|---|---|
| Regional Disparities in Waste Collection and Treatment Infrastructure Between Coastal and Inland Provinces | -0.8% | Western and Central China, rural areas, and lower-density provinces | Long term (≥ 4 years) |
| High Contamination Levels in Mixed Municipal Waste Reducing Recycling Efficiency | -0.5% | National, especially smaller cities, rural areas, and tier-3 cities | Medium term (2-4 years) |
| Rising Environmental Compliance Costs for Landfills and Incineration Facilities | -0.3% | National, with higher pressure in Eastern and Southern provinces | Medium term (2-4 years) |
| Limited Processing Capacity for Emerging Waste Streams Such as Solar Panels and Lithium Batteries | -0.2% | National, concentrated in manufacturing provinces and renewable energy zones. | Long term (≥ 4 years) |
| Source: Mordor Intelligence | |||
Regional Disparities in Waste Collection and Treatment Infrastructure Between Coastal and Inland Provinces
Infrastructure remains uneven across China's solid waste management market. The January 2026 action plan calls for inter-provincial coordination to move waste from capacity-deficit areas to nearby processing facilities.[1]National Development and Reform Commission et al., “China to Ramp Up Solid Waste Management in Green Transition Push,” Qiushi Theory, en.qstheory.cn Many eastern coastal provinces operate near incineration capacity, while inland and western regions have lower collection coverage and less safe treatment capacity. Investment has focused on dense urban centers with established logistics networks, slowing infrastructure development in lower-density markets. Fifteen provincial-level regions had ended the landfilling of raw household waste, mostly in developed eastern and coastal areas. Administrative boundaries can restrict cross-regional waste transfers, and local opposition can slow the construction of facilities that receive material from neighboring areas. Closing this gap requires funding, coordination, and local approval. These constraints make western expansion more complex than mature coastal operations and sustain a two-speed pattern in the China solid waste management market.
High Contamination Levels in Mixed Municipal Waste Reduce Recycling Efficiency
Contamination remains a practical limit on recycling efficiency. Classification coverage is broad, but compliance in urban and rural areas is inconsistent.[2] X. Chen et al., “A Review of the Differential Impacts of China’s Mandatory Waste Sorting Policies on Urban and Rural Areas,” Frontiers in Sustainability, frontiersin.org. Contaminated recyclable fractions reduce the value of recovered material. Material recovery facilities may then send lower-value inputs to incineration. This weakens the financial case for standalone recycling. It also concentrates more value in the downstream thermal treatment. Formal processing plants for solar panels, wind turbine blades, and EV batteries can exceed the current waste supply. Informal-channel competition and weak formal collection reduce plant utilization. The 2030 recycling utilization target depends on stronger collection behavior and more facilities. Education programs, enforcement, and better collection points will remain necessary. Compliance improvements would increase the quality and the predictability of material supply. Until then, contamination will restrain the full value of recycling investments.
*Our forecasts treat driver/restraint impacts as directional, not additive. The impact forecasts reflect baseline growth, mix effects, and variable interactions.
Segment Analysis
By Service Type: Waste-to-Energy Redefines Treatment Infrastructure Economics
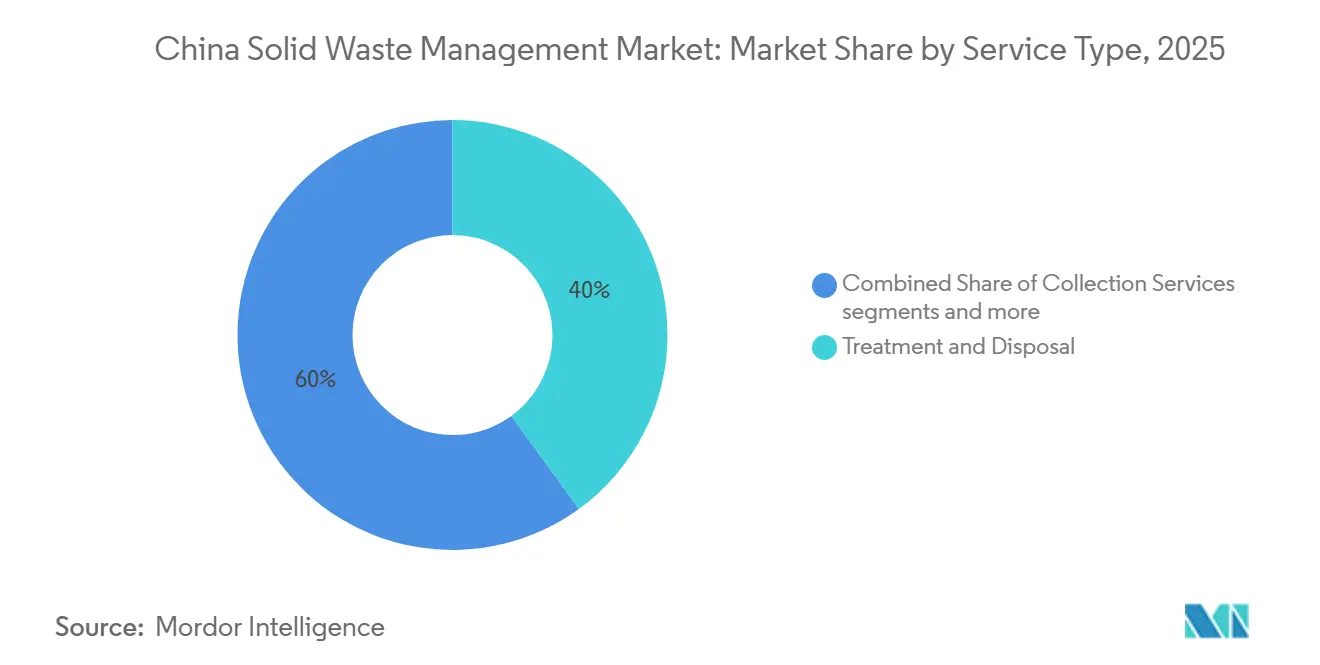
Treatment and Disposal accounted for 40% of the China solid waste management market in 2025. Its position reflected continued reliance on mixed municipal waste treatment in cities where source separation was still developing. Waste-to-Energy is forecast to grow at 12.1% CAGR through 2031. The service benefits from energy sales, steam supply, carbon credits, and fly-ash utilization. China’s 1,137 incineration plants had a capacity of 1.18 million tons per day at the end of 2025. The China solid waste management industry is shifting from basic disposal capacity toward more efficient energy and resource recovery.
Collection Services, Transportation, and Logistics remain necessary for every downstream service type. Smart routing, weight monitoring, and separate collection can reduce operating pressure and improve feedstock traceability. Recycling and Material Recovery gain support from national recycled-material targets for 2030. The policy calls for more than 300 million tons of recycled steel, 25 million tons of recycled nonferrous metals, and 19.5 million tons of recycled plastics. Other services include chemical recycling, food-waste digestion, and industrial-residue co-processing. These activities can expand as technical standards and commercial models develop under the circular economy framework.



By Waste Type: Medical and Industrial Streams Support Specialized Treatment Demand
Municipal Solid Waste accounted for 47% of China's solid waste management market in 2025. The segment reflects the broad reach of household collection and treatment systems. Urban household waste clearance reached 250 million tons in 2024. Kitchen waste represented 57.8% of domestic waste, supporting demand for digestion, composting, and leachate management.[3]Chunhui Li et al., “Current Situation and Development Trend of Solid Waste Generation, Utilization and Disposal in China,” Environmental Sanitation Engineering, srhj.org.cn. Medical Waste is forecast to grow at a 10.8% CAGR through 2031. Healthcare expansion in lower-tier cities and higher biosafety standards support that growth.
Industrial and Hazardous Waste require more specialized treatment than general municipal waste. EV assembly, semiconductor fabrication, and battery production are adding complex material streams. Construction and Demolition Waste offers a recovery opportunity in redevelopment areas. The January 2026 plan requires recyclable materials to be extracted from construction debris for reuse as building inputs. Agricultural Waste can support biogas and organic fertilizer production in high-livestock-density provinces. China had 31.4 million registered new energy vehicles at the end of 2024, creating a growing pool of future lithium battery waste.
By Source: Industrial Waste Growth Challenges the Residential Base
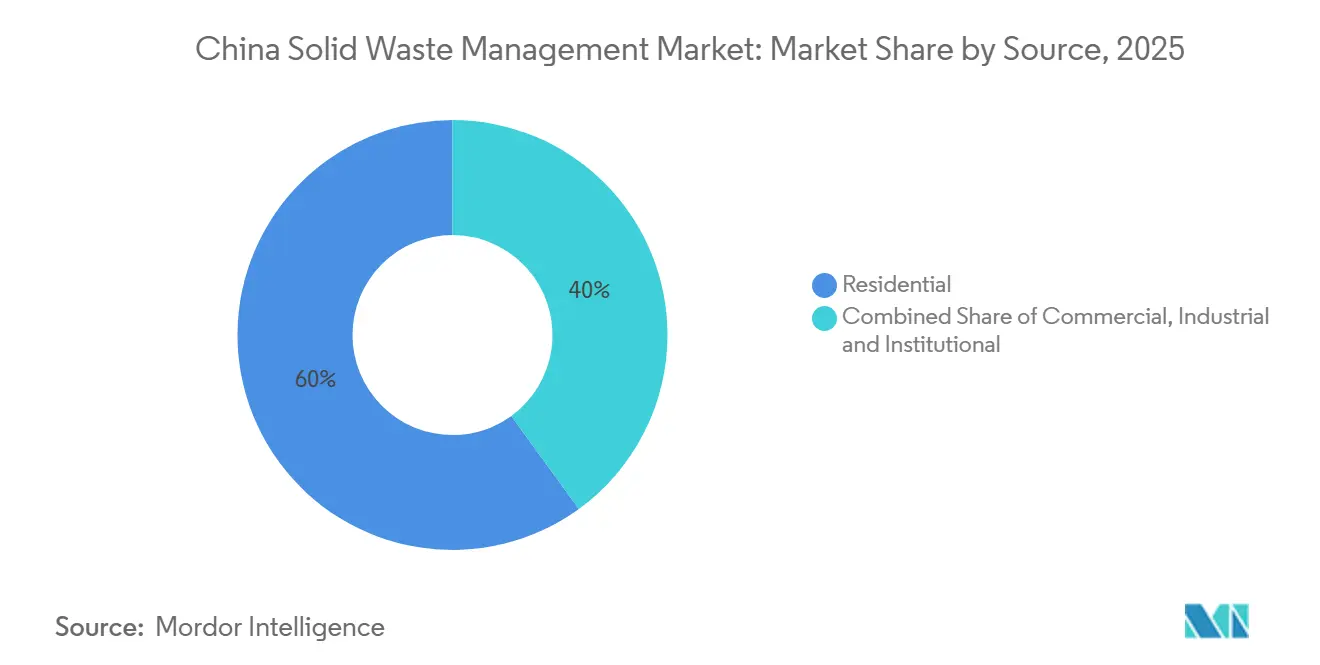
Residential accounted for 60% of the China solid waste management market in 2025. Long-term municipal service agreements and service-fee structures support steady cash flow for urban sanitation operators. These models often limit margins because services are provided under cost-oriented concession terms. Industrial is forecast to grow at a 7.3% CAGR through 2031. EV, battery, and semiconductor production generate material streams with higher treatment complexity. The China solid waste management industry, therefore, has a growing need for specialist hazardous waste and recovery operators.
The Ministry of Industry and Information Technology recognized 156 power-battery recycling companies through five approved batches. Commercial and Institutional sources also benefit from growth in logistics parks, cold-chain facilities, data centers, and retail sites. These facilities create localized collection and segregation contracts in tier-2 and tier-3 cities. GEM operated more than 140 recycling sites and worked with more than 750 vehicle and battery manufacturers and operators. It processed 10,800 tons of retired power batteries in the first quarter of 2025, up 37% year-on-year. Formal recovery capacity will become more important as early new-energy vehicle fleets reach the end of their life.
Geography Analysis
The eastern and southern coastal provinces are the most mature parts of China's solid waste management market. Fifteen provincial-level regions had achieved zero landfilling of raw household waste by the end of 2025. Guangdong, Shandong, Jiangsu, Zhejiang, and the Beijing-Tianjin-Hebei cluster have established collection and treatment networks. These markets are moving from greenfield incineration buildouts toward efficiency, fly ash utilization, and combined heat and power. The Pearl River Delta and Yangtze River Delta also have dense feedstock for chemical recycling and battery recovery. The circular economy policy places further emphasis on recycling networks in major industrial corridors.
Western and Central China form the main growth frontier. The 10 Western provinces have Waste-to-Energy treatment shortfalls relative to their population base. The national action plan supports coordination and accelerated construction in underserved inland markets. Chongqing has updated district sorting infrastructure and standardized community resource-recovery centers under the Zero-Waste City program. Hunan, Sichuan, and Anhui are also seeing more industrial and hazardous waste as manufacturing expands inland. These provinces offer new concessions but require greater tolerance for infrastructure and logistics risk.
North China has moved beyond raw household waste landfilling and is focusing more on fly ash treatment. Research identifies the utilization of fly ash as an area supported by central and provincial financing. Northeast China has a distinct profile, with legacy infrastructure and elevated waste-disposal methane emissions compared with coastal comparators. The East offers more stable, efficiency-led operating opportunities. The West offers faster growth from a lower installed base. This mix of mature and developing regions underpins the forecast expansion of the China solid waste management market through 2031.
Competitive Landscape
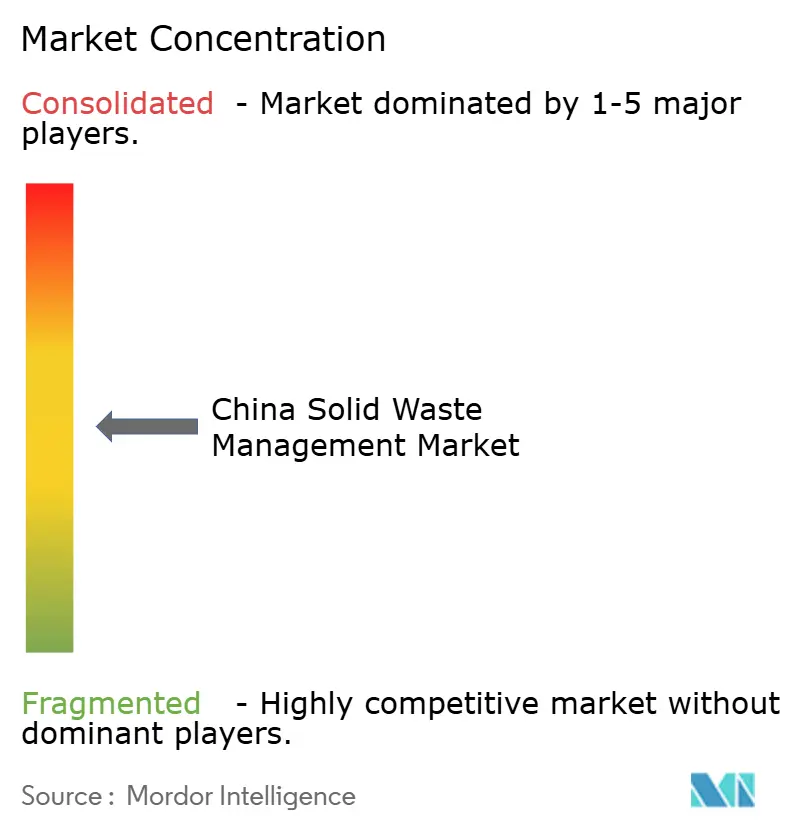
The China solid waste management market is moderately consolidated nationally and more fragmented in tier-2 and tier-3 cities. State-owned enterprises and large listed companies hold many concessions in incineration, hazardous waste, and urban sanitation. Their scale meets the capital needs of BOT projects lasting 25 to 30 years. Smaller operators compete more often for local collection logistics and service contracts. The resulting structure gives national firms an advantage in large facilities while preserving local opportunities in specialized services. Market concentration is shaped more by concession ownership and financing capacity than by a single nationwide operating model.
China Everbright Environment entered 2026 with a designed household waste processing capacity exceeding 160,000 tons per day across 24 Chinese provinces and 18 international markets. Its 2025 results included commercial biomethane production and battery recycling technology listed in a national catalog. Dynagreen reported 7.66 million tons of waste input in the first half of 2026. Its on-grid electricity rose 6.6%, while steam supply rose 28.9%. These results show why energy and heat co-products are becoming more important to operating economics. Large operators can use their asset base to develop these additional revenue sources.
Technology is becoming a stronger differentiator alongside concession scale. Canvest disclosed an AI image-recognition system for waste-and-slag crane operations in its 2025 ESG report. It also reported full-process digitalization for incineration control and flue-gas management. Compliance with emissions standards raises the barrier to entry for new incineration operators. This can favor larger companies that can fund upgrades across multiple facilities. Specialist companies continue to pursue industrial sorting, shredding, battery recycling, and processing of low-value plastics.
China Solid Waste Management Industry Leaders
China Everbright Environment Group Ltd.
Beijing Enterprises Environment Group Limited
Shanghai Chengtou Holding Co., Ltd.
Dynagreen Environmental Protection Group Co., Ltd.
Zhejiang Weiming Environment Protection Co., Ltd.
- *Disclaimer: Major Players sorted in no particular order

Recent Industry Developments
- June 2026: The NDRC released the 15th Five-Year Circular Economy Development Plan, setting a target of CNY 8 trillion (USD 1.12 trillion) in circular economy industry output by 2030, a 16% improvement in resource productivity versus 2025 baselines, 4.5 billion tons of bulk solid waste annual utilization, and 510 million tons of major secondary resource annual recycling.
- June 2026: Dynagreen Environmental Protection Group was awarded the Tiantai County Domestic Waste Incineration Power Generation and Fly Ash Landfill Operation and Maintenance Service Project in Zhejiang Province at CNY 90 per ton (USD 12.62 per ton), with a 5-year operations contract beginning in March 2027.
- March 2026: China’s Ministry of Industry and Information Technology and 5 additional departments issued Guidelines on Promoting the Comprehensive Utilization of Photovoltaic Modules, establishing classification, recycling, and reuse standards for decommissioned solar panels.
- January 2026: The State Council published the Action Plan for Comprehensive Treatment of Solid Waste, drafted jointly by the NDRC and 24 government departments, with 2030 targets for bulk solid waste utilization and renewable resource recycling.


China Solid Waste Management Market Report Scope
The China Solid Waste Management Market is Segmented by Service Type (Collection Services, Transportation & Logistics, Recycling & Material Recovery, Treatment & Disposal, Waste-to-Energy, Others), by Waste Type (Municipal Solid Waste, Industrial Waste, Hazardous Waste, Agricultural Waste, and More), by Source (Residential, Commercial, Industrial, and Institutional). The Market Forecasts are Provided in Terms of Value (USD).
| Collection Services |
| Transportation & Logistics |
| Recycling & Material Recovery |
| Treatment & Disposal |
| Waste-to-Energy |
| Others |
| Municipal Solid Waste |
| Industrial Waste |
| Hazardous Waste |
| Construction & Demolition Waste |
| Agricultural Waste |
| Medical Waste |
| Others |
| Residential |
| Commercial |
| Industrial |
| Institutional |
| By Service Type | Collection Services |
| Transportation & Logistics | |
| Recycling & Material Recovery | |
| Treatment & Disposal | |
| Waste-to-Energy | |
| Others | |
| By Waste Type | Municipal Solid Waste |
| Industrial Waste | |
| Hazardous Waste | |
| Construction & Demolition Waste | |
| Agricultural Waste | |
| Medical Waste | |
| Others | |
| By Source | Residential |
| Commercial | |
| Industrial | |
| Institutional |


Key Questions Answered in the Report
What is the projected value of China solid waste management sector by 2031?
The sector is forecast to reach USD 209.6 billion by 2031, growing at a 5.7% CAGR from 2026 to 2031. The forecast reflects policy-led treatment, recycling, and resource-recovery investment, together with continuing urban waste generation and an expanding need for compliant formal processing across municipal, industrial, and emerging waste streams.
Which service type is growing fastest in China?
Waste-to-Energy is the fastest-growing service type, with a projected 12.1% CAGR through 2031. It is supported by opportunities for electricity, heat, carbon credits, and fly ash utilization.
What waste stream has the highest revenue share?
Municipal Solid Waste held 47% of revenue in 2025. Its scale reflects the national household collection network and the continuing need for treatment in urban areas.
Why is industrial-source waste growing faster?
EV, battery, and semiconductor manufacturing are increasing the demand for specialized industrial and hazardous-waste treatment. These streams need formal collection, compliant processing, and recovery capacity.
Which regions offer the strongest new infrastructure opportunity?
Western and Central provinces offer greenfield potential, but operators face greater collection, logistics, financing, and infrastructure risk than in mature coastal provinces.
What is limiting recycling performance?
Mixed-waste contamination, uneven urban-rural participation, and informal collection channels lower the quality and supply of recoverable materials. Better sorting and formal collection are needed to improve plant utilization.
Page last updated on:


 Your data is secure and never sold or shared.


