Market Overview
| Study Period | 2018 - 2031 |
|---|---|
| Forecast Data Period | 2026 - 2031 |
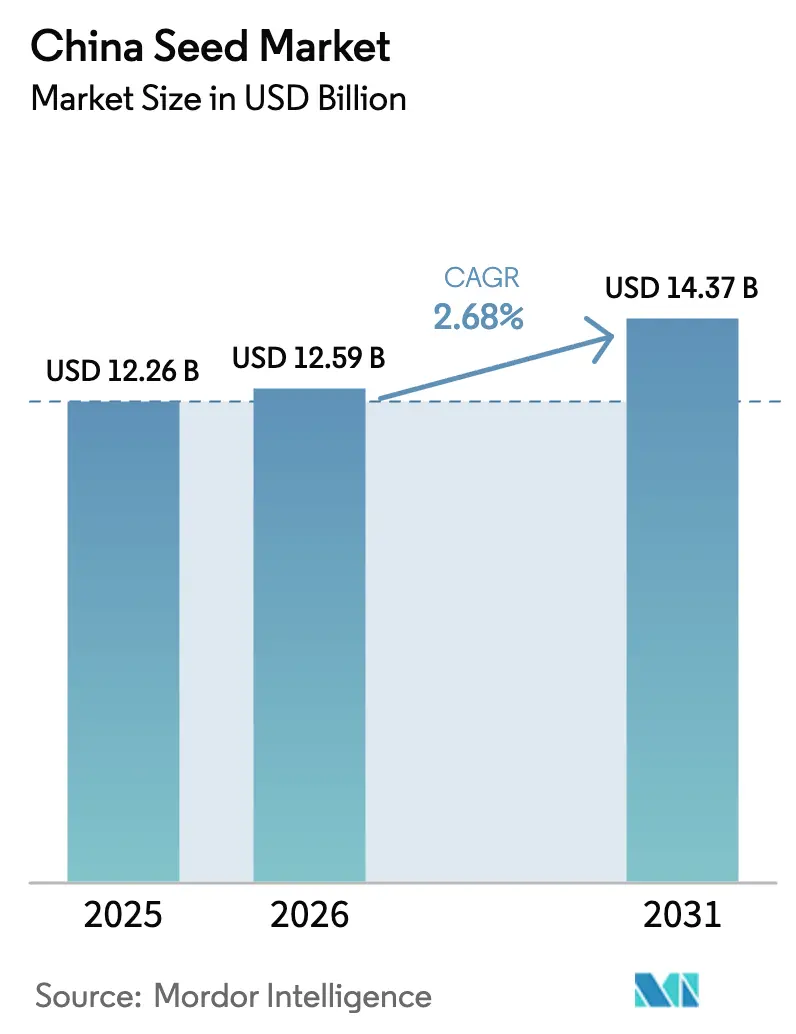
| Base Year Market Size (2025) | USD 12.26 Billion |
| Market Size (2026) | USD 12.59 Billion |
| Market Size (2031) | USD 14.37 Billion |
| Growth Rate (2026 - 2031) | 2.68% CAGR |
| Market Concentration | Low |
Major Players *Disclaimer: Major Players sorted in no particular order Image © Mordor Intelligence. Reuse requires attribution under CC BY 4.0. | |
China Seed Market Analysis by Mordor Intelligence
China seed market size in 2026 is estimated at USD 12.59 billion, growing from 2025 value of USD 12.26 billion with 2031 projections showing USD 14.37 billion, growing at 2.68% CAGR over 2026-2031. This modest yet steady pace reflects the maturing transition from subsistence farming to technologically enabled, scale-oriented agriculture. Much of the incremental value flows from genetically modified (GM) corn and soybean approvals, protected-cultivation demand for premium vegetable seed, and a broad policy mandate to raise crop self-sufficiency. Competitive intensity is high because thousands of provincial and county-level firms operate alongside global multinationals, creating a mixed landscape where technology, government ties, and regional specialization define success. Greenhouse expansion along the eastern seaboard and AI-assisted breeding platforms in Beijing and Hainan contribute fresh sources of differentiation, while climate-related risks in northwestern foundation seed bases temper growth outlooks.
Key Report Takeaways
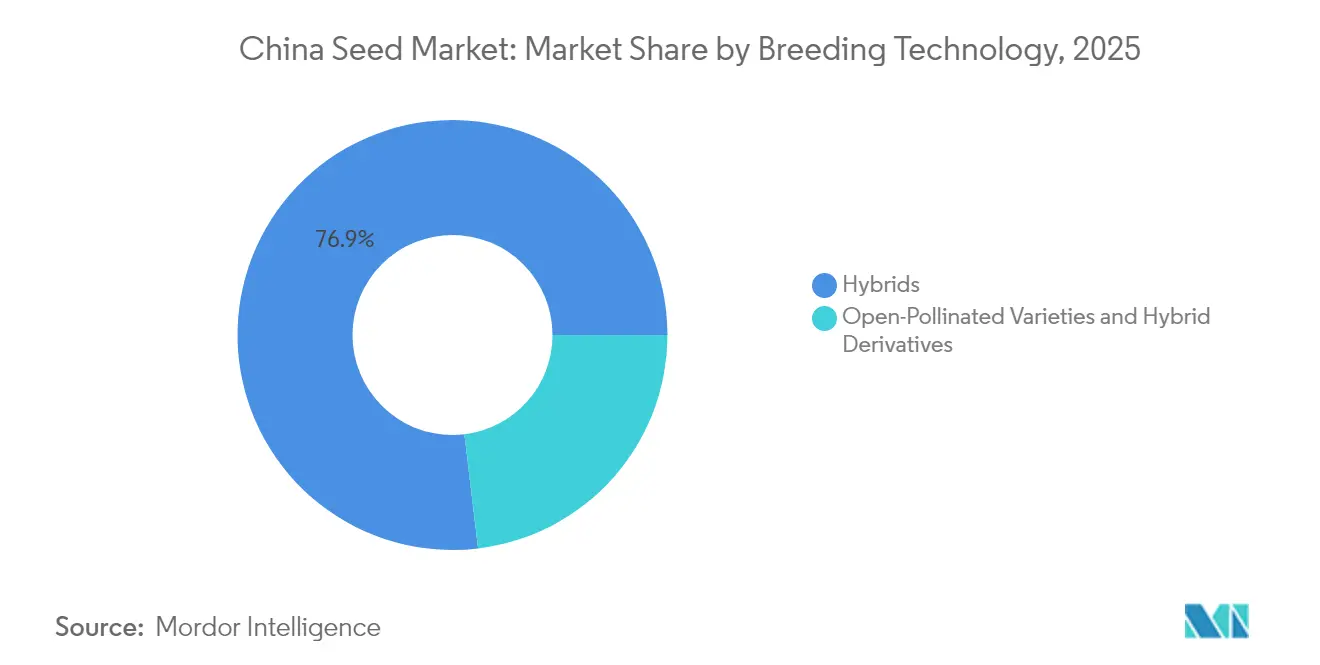
- By breeding technology, hybrids led with 76.90% revenue share in 2025, whereas open-pollinated varieties and hybrid derivatives are projected to expand at a 3.32% CAGR through 2031.
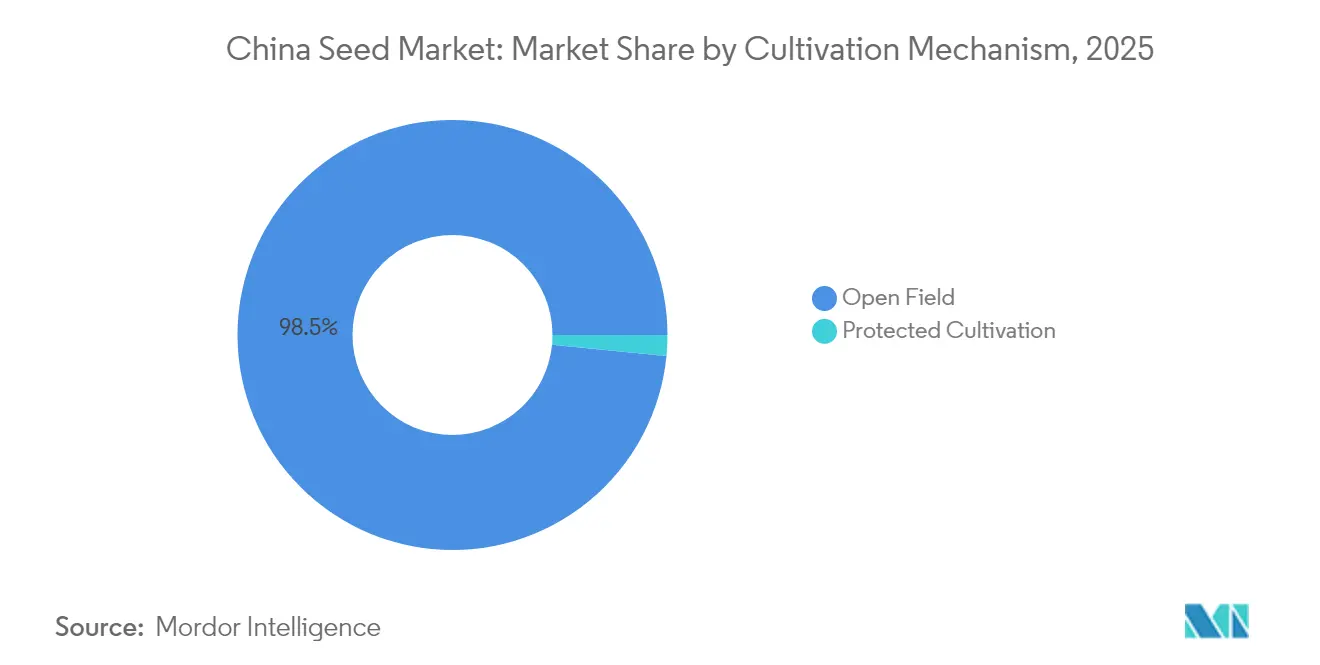
- By cultivation mechanism, the open-field segment accounted for 98.45% of the China seed market share in 2025, while protected cultivation is advancing at a 6.85% CAGR during the same period.
- By crop type, row crops commanded 91.25% of the China seed market size in 2025, and vegetables are set to grow at a 4.55% CAGR between 2026 and 2031.
Note: Market size and forecast figures in this report are generated using Mordor Intelligence’s proprietary estimation framework, updated with the latest available data and insights as of 2026.
China Seed Market Trends and Insights
Drivers Impact Analysis*
| Driver | (~) % Impact on CAGR Forecast | Geographic Relevance | Impact Timeline |
|---|---|---|---|
| China fast-tracks GM corn and soybean commercialization at unprecedented scale | +0.8% | Hebei, Jilin, Sichuan and nationwide rollout | Medium term (2-4 years) |
| Government subsidies for high-yield hybrid rice seed | +0.5% | South-central rice belts | Long term (≥ 4 years) |
| Protected-cultivation boom driving greenhouse-tailored vegetable seed | +0.4% | Coastal provinces and peri-urban clusters | Medium term (2-4 years) |
| AI-assisted breeding platforms shortening cultivar cycles | +0.3% | Beijing, Hainan, other R and D hubs | Long term (≥ 4 years) |
| Expansion of “Nanfan Seed Silicon Valley” CRO services enabling SME entry | +0.2% | Hainan and national breeding network | Medium term (2-4 years) |
| Rapid growth of fresh-eating corn segment creating premium niches | +0.3% | Northeast and southwest corn belts and peri-urban markets | Short term (≤ 2 years) |
| Source: Mordor Intelligence | |||
China fast-tracks GM corn and soybean commercialization at unprecedented scale
China’s decision to issue biosafety certificates to twenty-six domestic developers in 2024 opened the largest single national opportunity for GM seed commercialization since the technology first emerged.[1]Source: Office of Agricultural Affairs, “China: Planting Seeds Annual 2024,” Foreign Agricultural Service, USDA, fas.usda.gov Provincial pilots that once covered 670,000 hectares of GM corn will scale to more than 3.3 million hectares in 2025, creating immediate demand for certified seed and setting a precedent for soybeans. Yield lifts of 5-8% versus conventional hybrids translate into material revenue upside for firms holding licensed traits. Trait stacking will gain traction as herbicide-tolerant and insect-resistant genes combine to address labor cost inflation and evolving pest spectrums. Domestic players that received early approvals gain first-mover advantage on pricing and farmer loyalty, while multinationals secure margin through technology licensing.
Government subsidies for high-yield hybrid rice seed
The Agricultural Development Bank of China disbursed CNY 120 billion (USD 16.9 billion) in seed-industry credit since 2021, earmarking hybrid rice varieties that support food-security goals. Subsidies reduce breeding payback periods and incentivize mechanization-ready traits such as lodging resistance. Provincial procurement guarantees further derisk inventory, allowing companies like Yuan Longping High-Tech Agriculture to deepen their cultivar pipelines. As subsidy programs increasingly reward water-efficient and climate-resilient germplasm, firms equipped with genomic-selection tools will outpace peers reliant on conventional breeding.
Protected-cultivation boom driving greenhouse-tailored vegetable seeds
China hosts 60.4% of global greenhouse acreage and keeps adding capacity through municipal grants that exceeded USD 2 billion annually in 2024.[2]Source: Office of Agricultural Affairs, “China: Planting Seed 2023 Annual,” Foreign Agricultural Service, USDA, fas.usda.gov Controlled environments require compact plant architecture, disease tolerance under high humidity, and long harvest windows. Seed lots that satisfy those specifications command two to three times the unit price of open-field equivalents. The coastal provinces of Jiangsu, Zhejiang, and Shandong have turned into demand clusters where distributors bundle technical advisory services with proprietary varieties, enhancing farmer stickiness and enabling premium renewal rates.
AI-assisted breeding platforms shortening cultivar release cycles
Artificial intelligence now underpins genomic selection, phenotyping automation, and predictive modeling at leading research hubs such as Syngenta’s Beijing Smart Breeding Center and Yazhou Bay Seed Laboratory’s SeedLLM platform. Cycle times have come down to five-to-seven years from the traditional eight to ten. Faster turnover lets companies refresh portfolios ahead of shifting pest pressures and policy standards, raising market competitiveness. The capital and data requirements embedded in AI systems heighten entry barriers, giving scale operators time to consolidate genetic gains before mid-tier rivals adapt.
Restraints Impact Analysis*
| Restraint | (~) % Impact on CAGR Forecast | Geographic Relevance | Impact Timeline |
|---|---|---|---|
| Fragmented industry structure limiting scale R and D investment | -0.6% | Nationwide and especially tier-three firms | Long term (≥ 4 years) |
| Delayed royalty collection weakening variety protection | -0.4% | Central provinces and variable enforcement | Medium term (2-4 years) |
| Climate-driven production risks in Gansu and Xinjiang foundation bases | -0.3% | Northwest seed-multiplication zones | Short term (≤ 2 years) |
| Slow certified-seed adoption among smallholder farmers | -0.2% | Remote rural counties and pulses and minor crops | Long term (≥ 4 years) |
| Source: Mordor Intelligence | |||
Fragmented industry structure limiting scale R and D investment
The top five companies together hold roughly 15% of the China seed market, leaving thousands of regional firms to compete at thin margins. Fragmentation means individual operators lack the volume needed to amortize multi-million-dollar trait-licensing fees or maintain year-round breeding nurseries. Consolidation is slow because provincial authorities often protect local champions, and antitrust reviews scrutinize large mergers. The result is a dual-speed system where national leaders innovate, while many small players recycle public germplasm, delaying the overall technological upgrade of the China seed market.
Delayed royalty collection system weakens variety protection
Although China joined the International Union for the Protection of New Varieties of Plants (UPOV), field enforcement remains inconsistent. Unauthorized seed multiplication can erode licensed sales by 20-30% in some hybrid corn pockets, directly reducing breeders’ return on investment. Courts strengthened penalties in March 2025, yet provincial inspectors still lack resources to police remote distribution channels. Multinationals face added complexity due to cross-border IP administration, while domestic innovators weigh the commercial benefit of rapid release against potential revenue leakage.
*Our forecasts treat driver/restraint impacts as directional, not additive. The impact forecasts reflect baseline growth, mix effects, and variable interactions.
Segment Analysis
By Breeding Technology: Hybrid Dominance and Niche Growth for Open-Pollinated Varieties
Hybrids accounted for 76.90% of 2025 revenue, underscoring their entrenched position in high-yield systems that dominate corn, rice, and many vegetable crops. Yield premiums of 15-30% and government promotion of mechanization favor hybrid use despite higher seed-to-land cost ratios. Transgenic hybrids led by herbicide-tolerant corn will accelerate once full commercial planting moves beyond pilot zones, adding a new royalty stream to the China seed market size for technology licensors.
Open-pollinated varieties and hybrid derivatives post a 3.32% CAGR through 2031, driven by organic farming, seed-saving traditions among smallholders, and premium consumer demand for heritage vegetables. While the subsegment is comparatively small, its price stability and low technology cost attract regional firms looking to diversify away from heavily contested hybrid row-crop segments. The niche thus provides a viable entry for province-level enterprises to participate in the broader China seed market without incurring the R and D burden typical of hybrid development.


By Cultivation Mechanism: Open-Field Dominance Meets Greenhouse Upside
Open-field systems still represented 98.45% of the China seed market share in 2025. Corn, rice, soy, and cotton dominate arable acreage, and the varieties planted here emphasize drought tolerance, broad disease resistance, and combine-harvest suitability. As labor shortages intensify, mechanization-ready traits continue to anchor breeding priorities, reinforcing the demand for hybrids with strong stalks and uniform maturity.
Protected cultivation is forecast to deliver a 6.85% CAGR and thus contributes disproportionately to margin within the China seed market. Greenhouse producers seek compact internode spacing, continuous fruit set, and high-humidity tolerance. Breeders capable of integrating those trait packages enter long-term supply agreements with greenhouse cooperatives, securing predictable volume and premium pricing. The protected segment, therefore, functions as a profit pool that offsets commodity-price swings in open-field crops.
By Crop Type: Row-Crop Scale Versus Vegetable Premiumization
Row crops captured 91.25% of 2025 revenue, with corn alone carrying substantial weight thanks to livestock feed demand and fresh-eating corn’s rise to 1.67 million hectares. Rice retained its policy-driven importance due to food-security mandates and continuing hybrid upgrades, while soybean acreage responds to trade policy shifts and GM adoption pace. Pulse and fiber crops remain secondary but offer potential upside if dietary diversification and textile preferences evolve.
Vegetables are projected to grow at a 4.55% CAGR, making them the fastest-expanding category within the China seed market. Premiumization, evident in higher willingness to pay for flavor, nutrition, and pesticide-free credentials, allows varietal pricing far above row-crop equivalents. Controlled environments amplify that effect because growers require specially bred seed suited to high-density plantings and year-round cycles. Consequently, vegetable breeders frequently achieve double-digit return on sales, a stark contrast to the single-digit operating margins typical for commodity row-crop seed.
Geography Analysis
Regional specialization defines distribution strategies in the China seed market. The Northeast grain belt of Heilongjiang, Jilin, and Liaoning supplies the bulk of foundation seed for corn and soy because long summer days and isolation minimize cross-pollination risk. Mechanized farms covering several thousand hectares demand large seed volumes packaged in big-bag formats, favoring companies that operate integrated production-to-processing chains. GM adoption will be fastest here due to early pilot experience and established extension networks.
Central provinces along the Yangtze River, including Hubei and Hunan, are the epicenter for hybrid rice uptake. Warm, humid climates support double-cropping systems, elevating seed turnover rates. Proximity to megacities like Shanghai and Guangzhou also sustains greenhouse expansion for vegetables and specialty leafy greens. Seed suppliers that offer both hybrid rice and greenhouse vegetable portfolios gain cross-selling potential and logistical efficiency.
Western and northwestern regions such as Xinjiang and Gansu act as critical multiplication bases, but growing water stress and extreme temperature swings raise production risk. Drip irrigation adoption and protective seed-processing infrastructure, therefore, become vital value-chain nodes. Year-round breeding capability provided by Hainan’s Nanfan facilities complements these seasonal constraints, letting companies complete two or three generations per year and then distribute selected lines nationwide.
Competitive Landscape
Competitive intensity remains high because over 5,000 licensed seed firms participate in the China seed market. Syngenta Group China, Yuan Longping High-Tech Agriculture, and China National Seed Group occupy the top tier through broad crop portfolios and national distribution, yet together hold only about 15% revenue share. The fragmented structure enables niche players to maintain market positions in specific crops or regions, while creating challenges for companies seeking to achieve economies of scale in research and development investments.
Regional champions such as Anhui Tsuen Yin Hi-Tech and Beidahuang Kenfeng Seed lean on localized germplasm and provincial subsidies to defend territory. Domestic firms increasingly pursue tuck-in acquisitions to gain greenhouse expertise or trait libraries, emulating Syngenta’s 2024 purchase of Anhui Jianghuai Horticulture Seeds.[3]Source: Asia and Pacific Seed Alliance, “China Seed Industry News,” apsaseed.org Meanwhile, global players like BASF and Groupe Limagrain maintain joint ventures to navigate regulatory pathways and secure production acreage.
Strategic differentiation now gravitates toward platform capabilities, AI breeding engines, high-throughput phenotyping, and patent pools, rather than merely germplasm access. Companies investing in these enablers compress development cycles, thereby refreshing their portfolios faster than rivals tied to conventional breeding timelines. The fragmented nature of demand still rewards nimble provincial players that offer region-adapted open-pollinated lines at low cost, perpetuating a dual-track market structure.
China Seed Industry Leaders
Syngenta Group
Groupe Limagrain
Anhui Tsuen Yin Hi-Tech
Beidahuang Kenfeng Seed Co. Ltd
Yuan Longping High-Tech Agriculture Co., Ltd. (China International Trust Investment Corporation Agriculture Investment)
- *Disclaimer: Major Players sorted in no particular order


Recent Industry Developments
- March 2024: China is strengthening its seed industry through national innovation platforms and research centers, including Syngenta's Yangling Technology Center. The country aims to achieve technological self-sufficiency in seed development for essential crops like corn and rice.
- August 2024: CITIC (China International Trust and Investment Corporation) invested up to USD 167 million in Yuan Longping High-Tech to enhance seed breeding and industrial integration. The move supported China's strategic goal of boosting food security and seed self-sufficiency.
- October 2023: KWS SE divested its 49% stake in the joint venture KENFENG – KWS SEED CO., LTD, along with its Chinese corn portfolio, to Beidahuang Kenfeng Seed Co., Ltd. This move aimed to strengthen Beidahuang Kenfeng's position in the Chinese corn seed market.


China Seed Market Report Scope
Hybrids, Open Pollinated Varieties & Hybrid Derivatives are covered as segments by Breeding Technology. Open Field, Protected Cultivation are covered as segments by Cultivation Mechanism. Row Crops, Vegetables are covered as segments by Crop Type.Breeding Technology
| Hybrids | Non-Transgenic Hybrids | |
| Transgenic Hybrids | Herbicide Tolerant Hybrids | |
| Insect Resistant Hybrids | ||
| Other Traits | ||
| Open Pollinated Varieties and Hybrid Derivatives | ||
Cultivation Mechanism
| Open Field |
| Protected Cultivation |
Crop Type
| Row Crops | Fiber Crops | Cotton |
| Forage Crops | Alfalfa | |
| Forage Corn | ||
| Forage Sorghum | ||
| Other Forage Crops | ||
| Grains and Cereals | Corn | |
| Rice | ||
| Sorghum | ||
| Wheat | ||
| Other Grains and Cereals | ||
| Oilseeds | Canola, Rapeseed and Mustard | |
| Soybean | ||
| Sunflower | ||
| Other Oilseeds | ||
| Pulses | ||
| Vegetables | Brassicas | Cabbage |
| Carrot | ||
| Cauliflower and Broccoli | ||
| Other Brassicas | ||
| Cucurbits | Cucumber and Gherkin | |
| Pumpkin and Squash | ||
| Other Cucurbits | ||
| Roots and Bulbs | Garlic | |
| Onion | ||
| Potato | ||
| Other Roots and Bulbs | ||
| Solanaceae | Chilli | |
| Eggplant | ||
| Tomato | ||
| Other Solanaceae | ||
| Unclassified Vegetables | Asparagus | |
| Lettuce | ||
| Peas | ||
| Spinach | ||
| Other Unclassified Vegetables | ||
| Breeding Technology | Hybrids | Non-Transgenic Hybrids | |
| Transgenic Hybrids | Herbicide Tolerant Hybrids | ||
| Insect Resistant Hybrids | |||
| Other Traits | |||
| Open Pollinated Varieties and Hybrid Derivatives | |||
| Cultivation Mechanism | Open Field | ||
| Protected Cultivation | |||
| Crop Type | Row Crops | Fiber Crops | Cotton |
| Forage Crops | Alfalfa | ||
| Forage Corn | |||
| Forage Sorghum | |||
| Other Forage Crops | |||
| Grains and Cereals | Corn | ||
| Rice | |||
| Sorghum | |||
| Wheat | |||
| Other Grains and Cereals | |||
| Oilseeds | Canola, Rapeseed and Mustard | ||
| Soybean | |||
| Sunflower | |||
| Other Oilseeds | |||
| Pulses | |||
| Vegetables | Brassicas | Cabbage | |
| Carrot | |||
| Cauliflower and Broccoli | |||
| Other Brassicas | |||
| Cucurbits | Cucumber and Gherkin | ||
| Pumpkin and Squash | |||
| Other Cucurbits | |||
| Roots and Bulbs | Garlic | ||
| Onion | |||
| Potato | |||
| Other Roots and Bulbs | |||
| Solanaceae | Chilli | ||
| Eggplant | |||
| Tomato | |||
| Other Solanaceae | |||
| Unclassified Vegetables | Asparagus | ||
| Lettuce | |||
| Peas | |||
| Spinach | |||
| Other Unclassified Vegetables | |||


Market Definition
- Commercial Seed - For the purpose of this study, only commercial seeds have been included as part of the scope. Farm-saved Seeds, which are not commercially labeled are excluded from scope, even though a minor percentage of farm-saved seeds are exchanged commercially among farmers. The scope also excludes vegetatively reproduced crops and plant parts, which may be commercially sold in the market.
- Crop Acreage - While calculating the acreage under different crops, the Gross Cropped Area has been considered. Also known as Area Harvested, according to the Food & Agricultural Organization (FAO), this includes the total area cultivated under a particular crop across seasons.
- Seed Replacement Rate - Seed Replacement Rate is the percentage of area sown out of the total area of crop planted in the season by using certified/quality seeds other than the farm-saved seed.
- Protected Cultivation - The report defines protected cultivation as the process of growing crops in a controlled environment. This includes greenhouses, glasshouses, hydroponics, aeroponics, or any other cultivation system that protects the crop against any abiotic stress. However, cultivation in an open field using plastic mulch is excluded from this definition and is included under open field.
| Keyword | Definition |
|---|---|
| Row Crops | These are usually the field crops which include the different crop categories like grains & cereals, oilseeds, fiber crops like cotton, pulses, and forage crops. |
| Solanaceae | These are the family of flowering plants which includes tomato, chili, eggplants, and other crops. |
| Cucurbits | It represents a gourd family consisting of about 965 species in around 95 genera. The major crops considered for this study include Cucumber & Gherkin, Pumpkin and squash, and other crops. |
| Brassicas | It is a genus of plants in the cabbage and mustard family. It includes crops such as carrots, cabbage, cauliflower & broccoli. |
| Roots & Bulbs | The roots and bulbs segment includes onion, garlic, potato, and other crops. |
| Unclassified Vegetables | This segment in the report includes the crops which don’t belong to any of the above-mentioned categories. These include crops such as okra, asparagus, lettuce, peas, spinach, and others. |
| Hybrid Seed | It is the first generation of the seed produced by controlling cross-pollination and by combining two or more varieties, or species. |
| Transgenic Seed | It is a seed that is genetically modified to contain certain desirable input and/or output traits. |
| Non-Transgenic Seed | The seed produced through cross-pollination without any genetic modification. |
| Open-Pollinated Varieties & Hybrid Derivatives | Open-pollinated varieties produce seeds true to type as they cross-pollinate only with other plants of the same variety. |
| Other Solanaceae | The crops considered under other Solanaceae include bell peppers and other different peppers based on the locality of the respective countries. |
| Other Brassicaceae | The crops considered under other brassicas include radishes, turnips, Brussels sprouts, and kale. |
| Other Roots & Bulbs | The crops considered under other roots & bulbs include Sweet Potatoes and cassava. |
| Other Cucurbits | The crops considered under other cucurbits include gourds (bottle gourd, bitter gourd, ridge gourd, Snake gourd, and others). |
| Other Grains & Cereals | The crops considered under other grains & cereals include Barley, Buck Wheat, Canary Seed, Triticale, Oats, Millets, and Rye. |
| Other Fibre Crops | The crops considered under other fibers include Hemp, Jute, Agave fibers, Flax, Kenaf, Ramie, Abaca, Sisal, and Kapok. |
| Other Oilseeds | The crops considered under other oilseeds include Ground nut, Hempseed, Mustard seed, Castor seeds, safflower seeds, Sesame seeds, and Linseeds. |
| Other Forage Crops | The crops considered under other forages include Napier grass, Oat grass, White clover, Ryegrass, and Timothy. Other forage crops were considered based on the locality of the respective countries. |
| Pulses | Pigeon peas, Lentils, Broad and horse beans, Vetches, Chickpeas, Cowpeas, Lupins, and Bambara beans are the crops considered under pulses. |
| Other Unclassified Vegetables | The crops considered under other unclassified vegetables include Artichokes, Cassava Leaves, Leeks, Chicory, and String beans. |


Research Methodology
Mordor Intelligence follows a four-step methodology in all our reports.
- Step-1: IDENTIFY KEY VARIABLES: In order to build a robust forecasting methodology, the variables and factors identified in Step-1 are tested against available historical market numbers. Through an iterative process, the variables required for market forecast are set and the model is built on the basis of these variables.
- Step-2: Build a Market Model: Market-size estimations for the forecast years are in nominal terms. Inflation is not a part of the pricing, and the average selling price (ASP) is kept constant throughout the forecast period.
- Step-3: Validate and Finalize: In this important step, all market numbers, variables and analyst calls are validated through an extensive network of primary research experts from the market studied. The respondents are selected across levels and functions to generate a holistic picture of the market studied.
- Step-4: Research Outputs: Syndicated Reports, Custom Consulting Assignments, Databases, and Subscription Platforms


