
Netherlands Sea Freight Forwarding Market Size and Share
Market Overview
| Study Period | 2020 - 2031 |
|---|---|
| Forecast Data Period | 2026 - 2031 |
| Base Year Market Size (2025) | USD 3.87 Billion |
| Market Size (2026) | USD 4.05 Billion |
| Market Size (2031) | USD 5.09 Billion |
| Growth Rate (2026 - 2031) | 4.63 % |
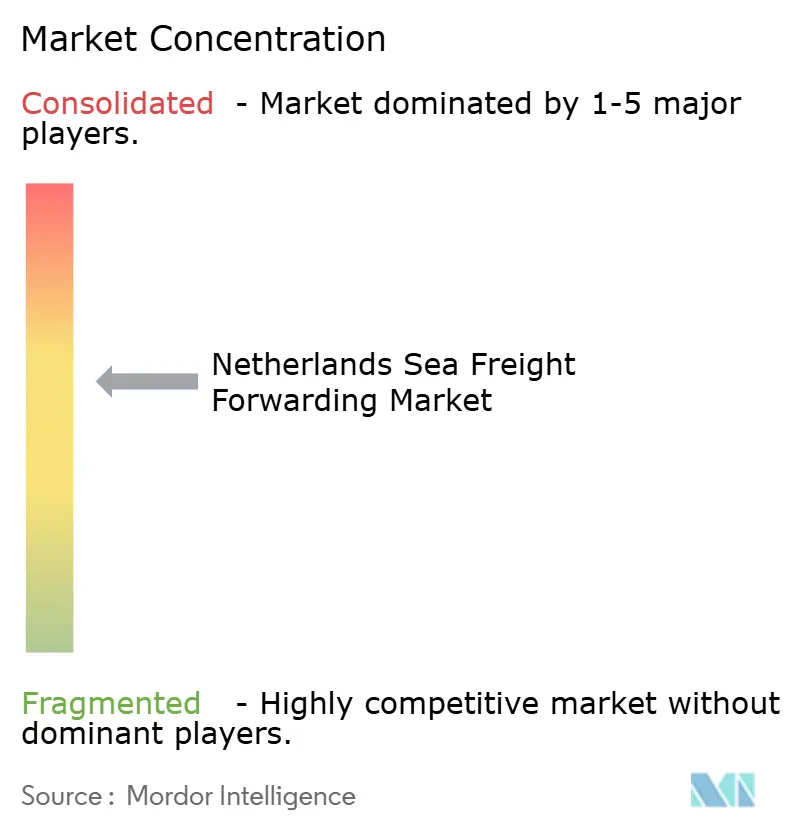
| Market Concentration | Medium |
Major Players *Disclaimer: Major Players sorted in no particular order Image © Mordor Intelligence. Reuse requires attribution under CC BY 4.0. | |
Netherlands Sea Freight Forwarding Market Analysis by Mordor Intelligence
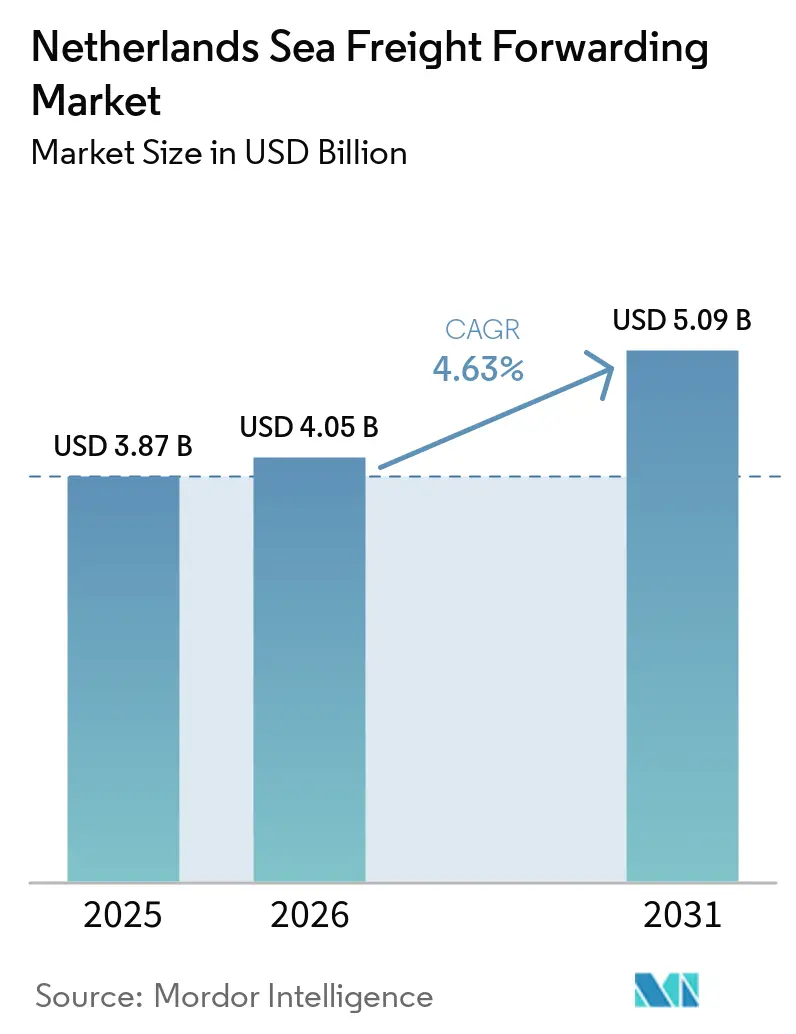
The Netherlands sea freight forwarding market size is projected to expand from USD 3.87 billion in 2025 and USD 4.05 billion in 2026 to USD 5.09 billion by 2031, registering a 4.63% CAGR between 2026 and 2031.
Container throughput at Rotterdam is increasing, supported by the adoption of digital platforms and investments in cold-chain infrastructure, which are contributing to volume growth. However, factors such as rising energy costs, regulatory pressures, and equipment imbalances continue to challenge margins. At the same time, the demand for temperature-controlled logistics and green-corridor incentives for low-emission vessels is providing new revenue opportunities, enabling forwarders to address pricing pressures in commoditized trade lanes. Competitive intensity remains moderate, with the top five global integrators managing a significant share of capacity, while specialized players continue to perform well in hazmat, feeder, and project cargo segments.
Key Report Takeaways
- By service, FCL captured 70.34% of the Netherlands sea freight forwarding market share in 2025; LCL is advancing at a 7.35% CAGR to 2031.
- By cargo type, reefer consignments are expanding at an 8.54% CAGR, the highest of all categories, even though dry cargo retained a 63% of the Netherlands sea freight forwarding market size in 2025.
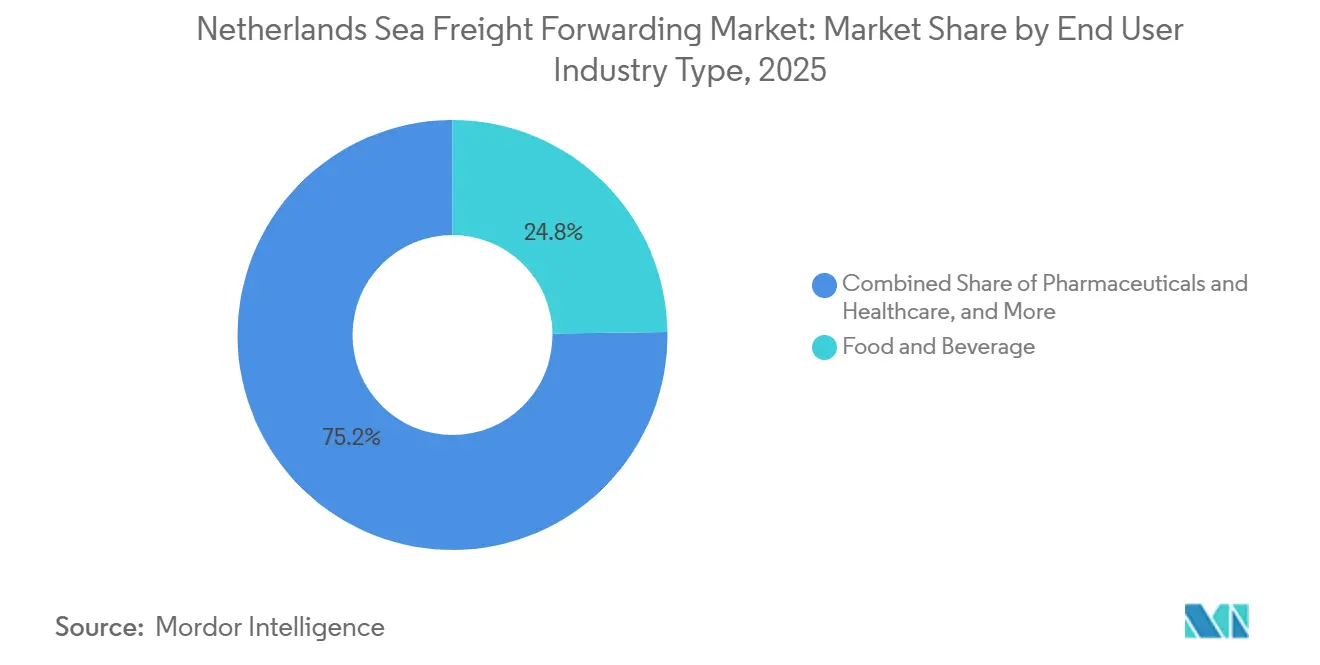
- By end user, food and beverage accounted for 24.77% of the Netherlands sea freight forwarding market share in 2025, whereas pharmaceuticals and healthcare are forecast to grow at a 9.17% CAGR through 2031.
- By region, the West region accounted for 70.1% of the Netherlands sea freight forwarding market size in 2025, while the East region posted the fastest 6.81% CAGR through 2031.
Note: Market size and forecast figures in this report are generated using Mordor Intelligence’s proprietary estimation framework, updated with the latest available data and insights as of January 2026.
Netherlands Sea Freight Forwarding Market Trends and Insights
Drivers Impact Analysis*
| Driver | % Impact on CAGR Forecast | Geographic Relevance | Impact Timeline |
|---|---|---|---|
| Sustained Growth in Container Throughput at the Port of Rotterdam | +0.8% | West (Rotterdam hub), spillover to North and South via barge/rail | Medium term (2-4 years) |
| Gateway Position and Superior Liner Connectivity | +0.9% | West (Rotterdam, Amsterdam), national hinterland reach | Long term (≥ 4 years) |
| E-Commerce–Led Surge in Import Volumes | +1.1% | National, concentrated in West and South (Randstad, Brabant) | Short term (≤ 2 years) |
| Digital Freight Platforms Enabling SME Access | +0.6% | National, early adoption in West and East logistics clusters | Medium term (2-4 years) |
| Green-Corridor Incentives for Low-Emission Vessels | +0.5% | West (Rotterdam-Singapore GDSC), expanding to North Sea routes | Long term (≥ 4 years) |
| Extensive Inland-Waterway and Rail Integrations | +0.7% | West and East (Rhine-Meuse-Scheldt, Betuweroute rail), cross-border Germany | Medium term (2-4 years) |
| Source: Mordor Intelligence | |||
Sustained Growth in Container Throughput at the Port of Rotterdam
In 2025, Rotterdam processed 14.2 million TEU, marking a 3.1% increase from the previous year. This uptick occurred even as total tonnage dipped by 0.2%, highlighting a shift towards lighter, higher-value cargoes and an uptick in empty-container repositioning. Despite a downturn in European manufacturing, volumes in the first quarter of 2026 remained steady, underscoring the gateway's robustness. Rotterdam's strategic location and adaptability to changing cargo dynamics have further solidified its position as a critical hub in the global sea freight network. The port's focus on efficiency and innovation continues to attract significant volumes, even in challenging market conditions. Additionally, Rotterdam's investments in digitalization and sustainability initiatives have enhanced its operational efficiency, making it a preferred choice for global shippers. These factors collectively contribute to the port's resilience and its ability to maintain a competitive edge in the market.
Terminal expansions at Maasvlakte II and the Rotterdam World Gateway are set to boost capacity by an additional 4.5 million TEU by the end of 2026. These enhancements will not only accommodate ultra-large vessels but also mitigate scheduling disruptions from events in the Suez or Red Sea. The increased capacity will also provide greater flexibility for handling fluctuating trade volumes, ensuring smoother operations. Thanks to these upgrades, the Netherlands' sea freight forwarding sector can uphold its timeliness, even when rerouting services through the Cape of Good Hope. The combination of increased physical capacity and automation has led to heightened crane productivity and reduced dwell times, safeguarding forwarder margins amidst rising rate pressures. These developments ensure that Rotterdam remains competitive and well-equipped to handle future growth in global trade volumes, reinforcing its role as a key player in the international logistics landscape[1].
Gateway Position and Superior Liner Connectivity
Rotterdam, boasting dense mainline calls and near-daily feeder services to Scandinavia, the Baltic, and the UK, proudly stands among the global top five on UNCTAD’s Liner Shipping Connectivity Index. Currently, 34% of containers travel inland by barge, and with the Betuweroute rail corridor, the German Ruhr is just under 4 hours away. This extensive connectivity enables forwarders to provide single-gateway solutions, ensuring efficient distribution across Northwest and Central Europe within two days. The port’s infrastructure supports seamless integration of various transport modes, enhancing its role as a critical logistics hub in the region. Additionally, Rotterdam’s ability to handle high cargo volumes while maintaining efficiency further solidifies its position as a key player in global trade. The port’s strategic location and advanced facilities make it a preferred choice for shippers and forwarders alike.
DSV has established a 200,000 m² consolidation hub in Rotterdam-Heijplaat, seamlessly integrating ocean, rail, and road services. This strategic facility not only streamlines transloading steps but also reinforces the West region’s dominance as a logistics powerhouse. The hub’s design reduces handling times and optimizes supply chain operations, offering significant cost and time savings for businesses. Furthermore, Rotterdam’s superior connectivity acts as a buffer for shippers against geopolitical route shifts. Frequent vessel rotations allow for swift cargo switches, minimizing delays and ensuring reliability in global supply chains. As global trade dynamics evolve, Rotterdam’s adaptability and robust infrastructure continue to position it as a cornerstone of international logistics[2].
E-Commerce–Led Surge in Import Volumes
In 2025, consumer-oriented imports reached a notable USD 68.7 billion, driven by platforms from China and Southeast Asia funneling electronics, apparel, and home goods into Dutch fulfillment centers. Chinese exports saw a 5% uptick in electrical and appliance volumes, while packaged foods surged by 19%. This shift compelled forwarders to adapt, managing smaller and more frequent consignments, a trend that leans towards LCL services. The growing demand for consumer goods underscores the need for efficient supply chain solutions to meet market demand. Additionally, the rise in LCL services indicates a shift in logistics strategies to accommodate evolving consumer preferences and the need for faster delivery times. PortBase handled over 1 million pre-arrival declarations in 2025, successfully reducing terminal dwell times for compliant cargo to under 24 hours.
After witnessing a new take-up of 3.8 million m², urban logistics rents surged by 12% to EUR 125 per m² (USD 145.3 per m²). This spike underscores the intense competition for last-mile nodes, especially those equipped to handle peak-season surges. The rise in urban logistics rents reflects the critical role of strategically located facilities in supporting the growth of e-commerce and retail. As demand for last-mile delivery infrastructure increases, companies are prioritizing investments in urban logistics hubs to enhance operational efficiency. These hubs are becoming essential for managing peak-season volumes and ensuring timely deliveries, further driving competition in the logistics real estate market.
Digital Freight Platforms Enabling SME Access
SMEs can now clear customs, reserve truck slots, and track containers in real time without the need for in-house specialists, thanks to platforms such as PortBase, Nextlogic, and third-party portals. A SmartPort study found a 20-30% improvement in on-time-in-full delivery and a 30-40% reduction in customer service workload after implementing visibility tools. Transparent spot rates diminish information asymmetry, intensifying price competition in commoditized FCL corridors. These advancements are reshaping operational efficiencies for SMEs, enabling them to compete more effectively in global markets. Additionally, access to real-time data empowers SMEs to make informed decisions, reducing operational bottlenecks and improving overall supply chain performance.
Blockchain technology has expedited bill of lading processes, reducing document cycles from days to mere hours, while also mitigating fraud in the pharmaceutical and electronics sectors. However, adoption gaps persist because legacy ERP systems lack open APIs, hindering seamless integration. Despite these challenges, forwarders' white-label portals are successfully bridging this gap and fostering deeper loyalty among SMEs. These portals not only address technological limitations but also enhance the overall user experience, ensuring SMEs can leverage digital tools to optimize their supply chain operations. Furthermore, the integration of such tools is driving a shift toward more transparent and efficient trade practices, ultimately benefiting both SMEs and their customers.
Restraints Impact Analysis*
| Restraint | % Impact on CAGR Forecast | Geographic Relevance | Impact Timeline |
|---|---|---|---|
| Port Congestion and Capacity Bottlenecks | -0.6% | West (Rotterdam terminals), spillover delays to North and South | Short term (≤ 2 years) |
| Geopolitical Volatility and Bunker-Price Swings | -0.4% | National (all regions affected by fuel surcharges and route diversions) | Short term (≤ 2 years) |
| Stricter EU Customs/HS-Code Compliance Burden | -0.3% | National, concentrated at West (Rotterdam) and North (Amsterdam) entry points | Medium term (2-4 years) |
| Empty-Container Imbalance Costs | -0.5% | West (Rotterdam repositioning hub), cross-border flows to Germany | Medium term (2-4 years) |
| Source: Mordor Intelligence | |||
Port Congestion and Capacity Bottlenecks
Peak times in Rotterdam could result in routine one-hour gate delays. These delays stem from issues such as berth bunching, a scarcity of truck slots, and limited grid power for crane electrification. With 60% of hinterland moves still dependent on road transport, any shift back from rail or barge exacerbates yard queues. The reliance on road transport continues to strain the port's operational efficiency, especially during peak periods when congestion is at its highest. Furthermore, the lack of sufficient truck slots exacerbates bottlenecks, creating delays that ripple through the supply chain. These challenges underline the need for immediate operational adjustments to mitigate disruptions.
Additionally, grid congestion hampers the rollout of shore power and inflates logistics energy bills, surpassing costs at neighboring ports. This situation has led some shippers to reroute their cargo to Antwerp or Hamburg in search of more cost-effective alternatives. While Maasvlakte II Phase 2 is set to introduce an additional 2.5 million TEU capacity by 2026, achieving long-term relief hinges on reforms in nitrogen permits and comprehensive upgrades to the electricity network. Without these critical improvements, Rotterdam risks losing its competitive edge in the region. The port's ability to adapt to these challenges will determine its position as a leading logistics hub in Europe[3].
Geopolitical Volatility and Bunker-Price Swings
In 2025 and early 2026, attacks in the Red Sea compelled numerous Asia-Europe shipping routes to reroute around the Cape. This detour extended voyages by as much as two weeks, tightening the supply of vessels. As a result, spot rates surged, and emergency fuel surcharges were implemented. The disruptions significantly impacted shipping schedules, creating delays and increasing operational costs for freight forwarders. These challenges further strained the already volatile shipping market, leaving stakeholders grappling with heightened uncertainties. The rerouting also increased transit times, disrupting supply chains and forcing companies to explore alternative solutions to meet delivery commitments.
The price of very-low-sulfur fuel oil fluctuated between USD 400 and USD 650 per tonne. Additionally, EU ETS allowances contributed an extra EUR 60–90 (USD 69.7–104.6) per ton of CO₂. This meant carbon surcharges could reach up to 30% of the total bunker bill. Forwarders in the Netherlands, operating with minimal hedging, found it challenging to navigate this volatility under their fixed-price contracts, leading to a squeeze on profitability in the sea freight forwarding market. The combination of rising fuel costs and carbon surcharges created a significant financial burden, forcing companies to reassess their pricing strategies and operational efficiencies. Many forwarders also faced difficulties in passing on these additional costs to customers, further compressing margins and intensifying competition in the market.
*Our forecasts treat driver/restraint impacts as directional, not additive. The impact forecasts reflect baseline growth, mix effects, and variable interactions.
Segment Analysis
By Service: LCL Gains as E-Commerce Fragments Shipment Sizes
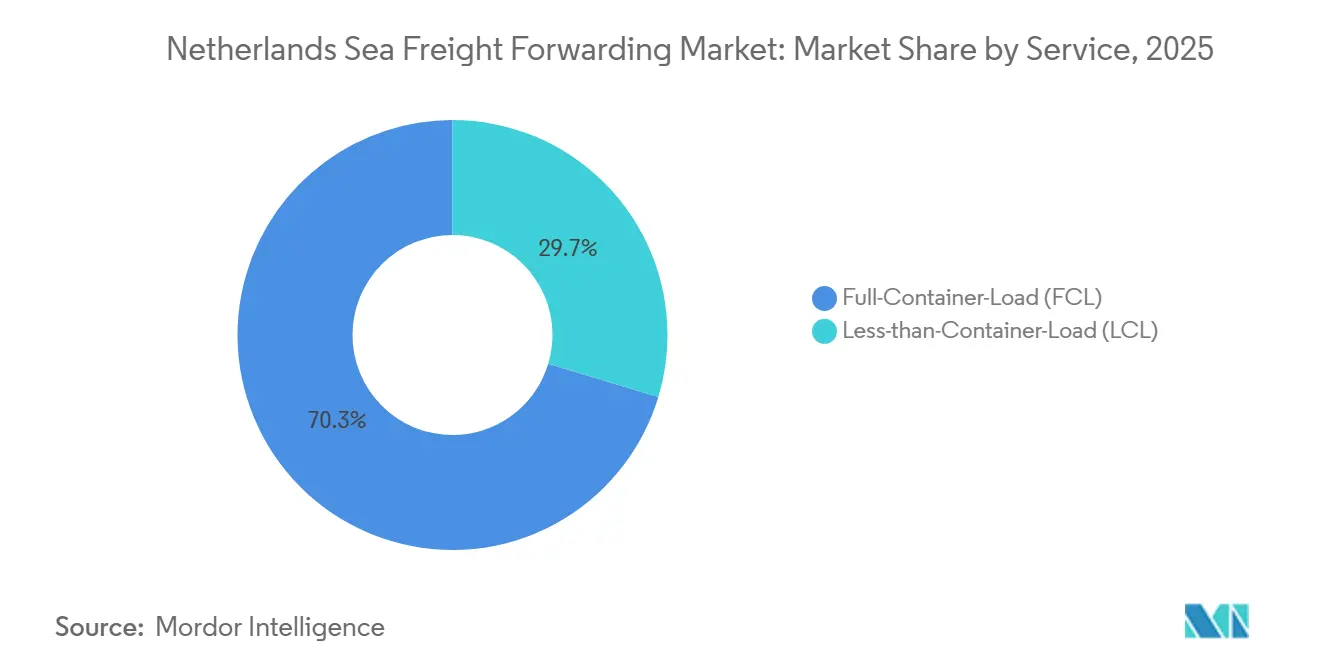
Full-container-load captured 70.34% of the Netherlands sea freight forwarding market share in 2025, anchored by volume-heavyweights in chemicals, agrifood, and automotive. Weekly direct calls to Shanghai, Ningbo, and Singapore keep FCL door-to-door transit predictable, while the 34% barge share lowers drayage cost into Europe’s interior. Yet structural vessel overcapacity up 17.7% between 2023 and 2025 caps FCL spot rates and narrows margins once geopolitical premiums fade.
Less-than-container-load grew 7.35% annually and is on track to keep outpacing the broader Netherlands sea freight forwarding market through 2031 as SMEs match digital booking convenience with surging cross-border sales. Real-time slot auctions and automated sortation hubs in Rotterdam-Heijplaat and Moerdijk cut LCL handling times by up to two days. Ancillary services, such as re-labeling, quality checks, and returns management, boost unit revenue and partially shield consolidators from linehaul price erosion[4].

By Cargo Type: Reefer Surge Driven by Pharma Cold-Chain Investments
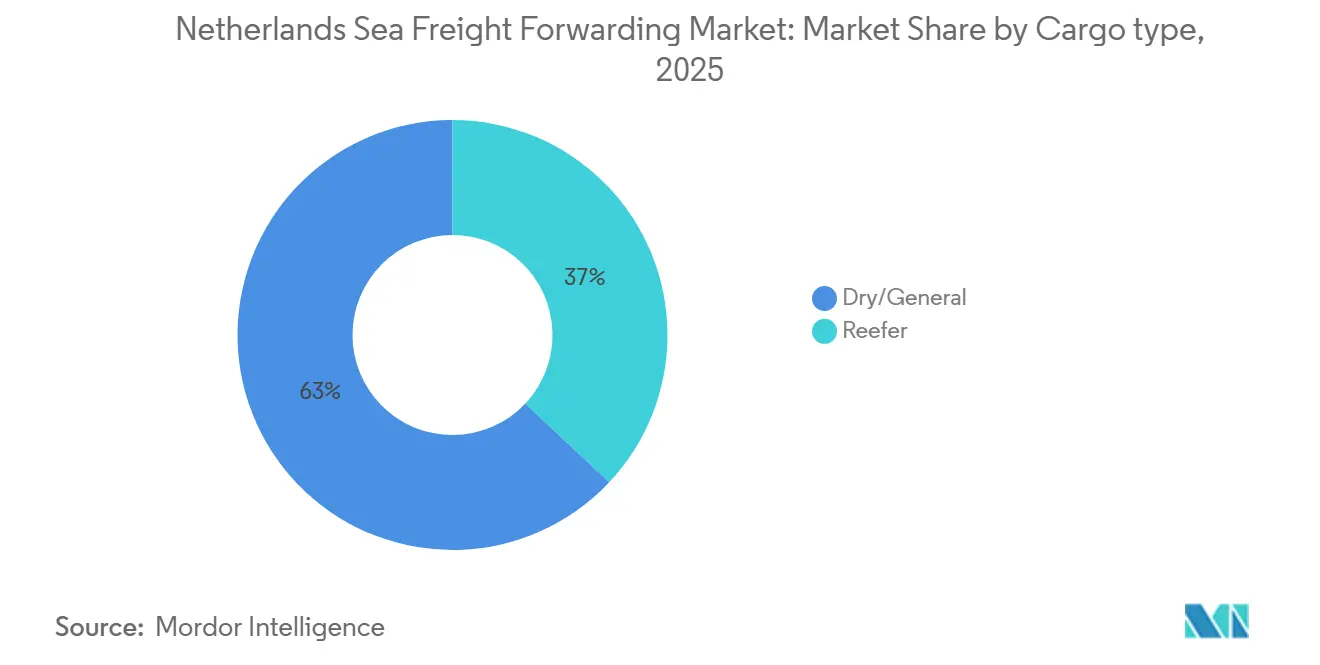
Dry cargo still accounts for 63% of the Netherlands sea freight forwarding market share in 2025, yet reefer volumes are climbing at an 8.54% CAGR thanks to pharma and fresh-produce flows. Maersk’s 35,000 m² Maasvlakte cold store brings 34,000 pallet positions under one roof, integrates an in-house veterinary border point, and runs on rooftop solar, setting a new cost-and-compliance benchmark.
Pharmaceuticals need stricter GDP controls, continuous monitoring, and validated equipment, driving forwarders to secure CEIV-Pharma or TAPA-A sites, such as GEODIS’ Schiphol-Rijk complex. The Netherlands sea freight forwarding market for reefer cargo will benefit as dual-fuel methanol vessels and shore-power discounts let shippers curb scope-3 emissions in temperature-controlled supply chains.
By End User Industry: Pharma Outpaces Food as Compliance Tightens
Food and beverage accounted for 24.77% of the Netherlands sea freight forwarding market share in 2025, mirroring the nation’s EUR 49 billion (USD 56.8 billion) agrifood export base and its central role in EU grocery distribution. Rising cocoa prices boosted bulk imports for Dutch processors, but higher energy tariffs erode the competitiveness of energy-intensive cold stores.
Pharmaceutical and healthcare cargo, though smaller today, is forecast to grow at a CAGR of 9.17% by 2031, making it the fastest-growing user group within the Netherlands sea freight forwarding market. Biosimilar launches, aging demographics, and tight GDP enforcement spur demand for qualified cold chain, end-to-end visibility, and carbon accounting. Forwarders offering validated 2-8 °C and 15-25 °C corridors, plus customs-bonded storage, command premium yields that mitigate base-rate compression in commoditized trades.
Geography Analysis
West Netherlands, anchored by Rotterdam and Amsterdam, accounted for 70.1% of the Netherlands sea freight forwarding market in 2025, powered by 14.2 million TEU of box throughput, superior liner frequency, and the highest cold-chain density. Maasvlakte II extensions lift capacity above 10 million TEU by late 2026, preserving schedule reliability when security events divert vessels from Suez to the Cape. Yet grid bottlenecks, nitrogen caps, and record logistics rents pose medium-term constraints that may temper share gains.
The East region grows the fastest at a 6.81% CAGR, propelled by logistics parks near German borders and direct Betuweroute rail links that move Asian imports to Central Europe without customs stops. Warehouse developers such as Logicor and Mapletree delivered more than 70,000 m² of new stock in 2025-2026, giving forwarders close-to-market storage that reduces trunk-haul mileage. ASML’s Veldhoven campus also funnels high-value semiconductor tools through specialized East-region gateways, raising demand for secure, climate-stable facilities.
The South region leverages Brabant’s manufacturing base and dual-gateway strategies via neighboring Antwerp, though deep-sea terminal capacity remains limited. The North, home to Schiphol Airport, plays a critical role in multimodal pharma and cut-flower logistics but captures a modest slice of sea freight due to Amsterdam’s shallower draft. Across all areas, a 1.47 million TEU import-export gap forces costly empty-box repositioning that erodes forwarder margins, especially outside the balanced West corridors.
Competitive Landscape
Global integrators Kuehne+Nagel, DHL, DSV, Maersk, and CMA CGM control roughly 55-60% of available capacity, yet a long tail of specialists thrives where scale yields diminish. DSV’s early-completed DB Schenker takeover consolidated 200,000 m² of Dutch warehousing, raising entry barriers for smaller rivals and sharpening the Netherlands sea freight forwarding market’s focus on multimodal nodes. Maersk’s vertical cold-chain play, launched in February 2025, exemplifies how end-to-end control protects margins and deepens customer lock-in for perishable and pharma shippers.
Digital ecosystems also reshape rivalry. PortBase and Nextlogic democratize slot access and slash paperwork, eroding incumbents’ relationship moats and compressing FCL rates. To differentiate, many mid-tier forwarders pivot toward hazmat, project cargo, or shore-power advisory services that command fee premiums. Samskip’s part-ownership of Matrans Terminal strengthens its short-sea feeder network, while Broekman Logistics scales chemical warehousing to win GDP-compliant contracts.
Emerging white space lies in decarbonization and reverse logistics. Rotterdam’s sixfold jump in bio-LNG bunkers and 35 planned shore-power points let forwarders craft verified low-carbon corridors that meet scope-3 mandates for exporters such as ASML. At the same time, high reuse rates for semiconductor modules invite specialized circular logistics that can handle inspection, repair, and controlled-temperature returns.
Netherlands Sea Freight Forwarding Industry Leaders
-
CMA CGM Group (Including CEVA Logistics)
-
Expeditors International of Washington, Inc.
-
Kuehne+Nagel
-
DHL Group
-
DSV A/S (Including DB Schenker)
- *Disclaimer: Major Players sorted in no particular order
Recent Industry Developments
- April 2026: WPU unveiled an 80,000 ton per year chemical-recycling plant co-located with Vitol’s Rotterdam refinery, integrating 20,000 m³ of Vopak storage for pyrolysis oil.
- March 2026: Port of Rotterdam activated Maasvlakte 2 Phase 2, adding 2.5 million TEU of capacity and 150 hectares of industrial land.
- March 2026: Mapletree opened a 30,817 m² logistics facility in Oosterhout to support rail-and-barge distribution to Central Europe.
- December 2025: DSV finalized the consolidation of its Dutch operations into Rotterdam-Heijplaat and Moerdijk, totaling 198,300 m² of warehouses.
Netherlands Sea Freight Forwarding Market Report Scope
| Full-Container-Load (FCL) |
| Less-than-Container-Load (LCL) |
| Dry/General |
| Reefer |
| Electronics and Semiconductors |
| Chemicals and Petrochemicals |
| Food and Beverage |
| Pharmaceuticals and Healthcare |
| Retail and E-commerce |
| Others |
| West |
| North |
| East |
| South |
| By Service | Full-Container-Load (FCL) |
| Less-than-Container-Load (LCL) | |
| By Cargo Type | Dry/General |
| Reefer | |
| By End User Industry | Electronics and Semiconductors |
| Chemicals and Petrochemicals | |
| Food and Beverage | |
| Pharmaceuticals and Healthcare | |
| Retail and E-commerce | |
| Others | |
| By Region | West |
| North | |
| East | |
| South |
Key Questions Answered in the Report
How large will the Netherlands sea freight forwarding market be by 2031?
It is expected to reach USD 5.09 billion by 2031, growing at a 4.63% CAGR from 2026 to 2031.
Which region leads Dutch sea freight forwarding activity?
The West region, anchored by Rotterdam and Amsterdam, held 70.1% of 2025 revenue and remains the core gateway for global liner services .
What service segment is growing the fastest?
Less-than-container-load forwarding is expanding at a 7.35% CAGR through 2031 as e-commerce fragments shipment sizes.
Why is pharma logistics gaining share in Dutch forwarding?
Stricter GDP rules and new cold-chain facilities drive a 9.17% CAGR for pharmaceuticals and healthcare consignments through 2031.
How are sustainability rules affecting forwarders?
EU ETS carbon pricing, Fuel EU Maritime intensity caps, and green-corridor incentives are pushing forwarders to partner with carriers that deploy dual-fuel or bio-LNG vessels and adopt shore power in Rotterdam