Australia Freight Forwarding Market Size and Share
Market Overview
| Study Period | 2020 - 2031 |
|---|---|
| Forecast Data Period | 2026 - 2031 |
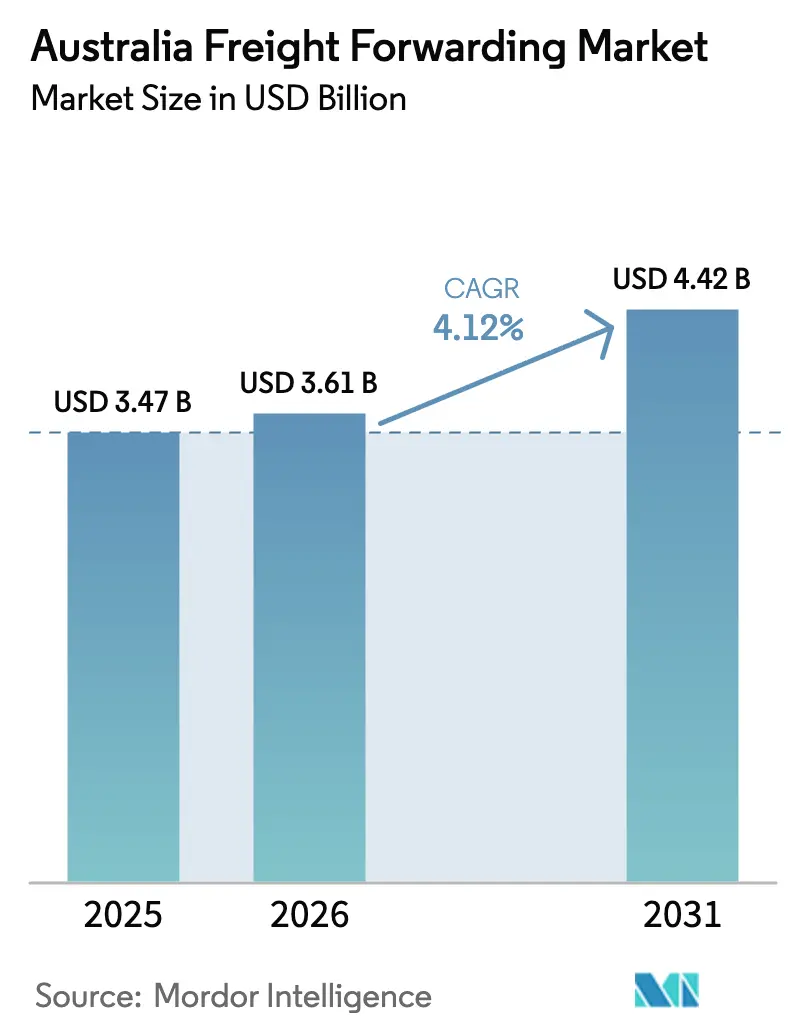
| Base Year Market Size (2025) | USD 3.47 Billion |
| Market Size (2026) | USD 3.61 Billion |
| Market Size (2031) | USD 4.42 Billion |
| Growth Rate (2026 - 2031) | 4.12% CAGR |
| Market Concentration | Low |
Major Players *Disclaimer: Major Players sorted in no particular order Image © Mordor Intelligence. Reuse requires attribution under CC BY 4.0. | |
Australia Freight Forwarding Market Analysis by Mordor Intelligence
The Australia Freight Forwarding Market size was valued at USD 3.47 billion in 2025 and estimated to grow from USD 3.61 billion in 2026 to reach USD 4.42 billion by 2031, at a CAGR of 4.12% during the forecast period (2026-2031).
Growth is underpinned by surging bulk-commodity exports, an e-commerce sector generating USD 45.96 billion in 2024, and record government spending on rail corridors that shorten line-haul times for agricultural and resource cargo. Industry consolidation most prominently DSV’s USD 23.6 billion acquisition of DB Schenker signals a strategic pivot toward scale advantages in technology, customs expertise and sustainability investments. As Australia tightens decarbonization mandates and clears the USD 14.5 billion Inland Rail for Melbourne-to-Brisbane double-stack trains, forwarders able to blend sea, rail and air capacity while complying with emissions targets gain a durable edge. Coal shipments to China rose 51.4% in 2024, proving the sector’s resilience to geopolitical shocks and reinforcing the centrality of Western Australian and Queensland ports in the Australia freight forwarding market.
Key Report Takeaways
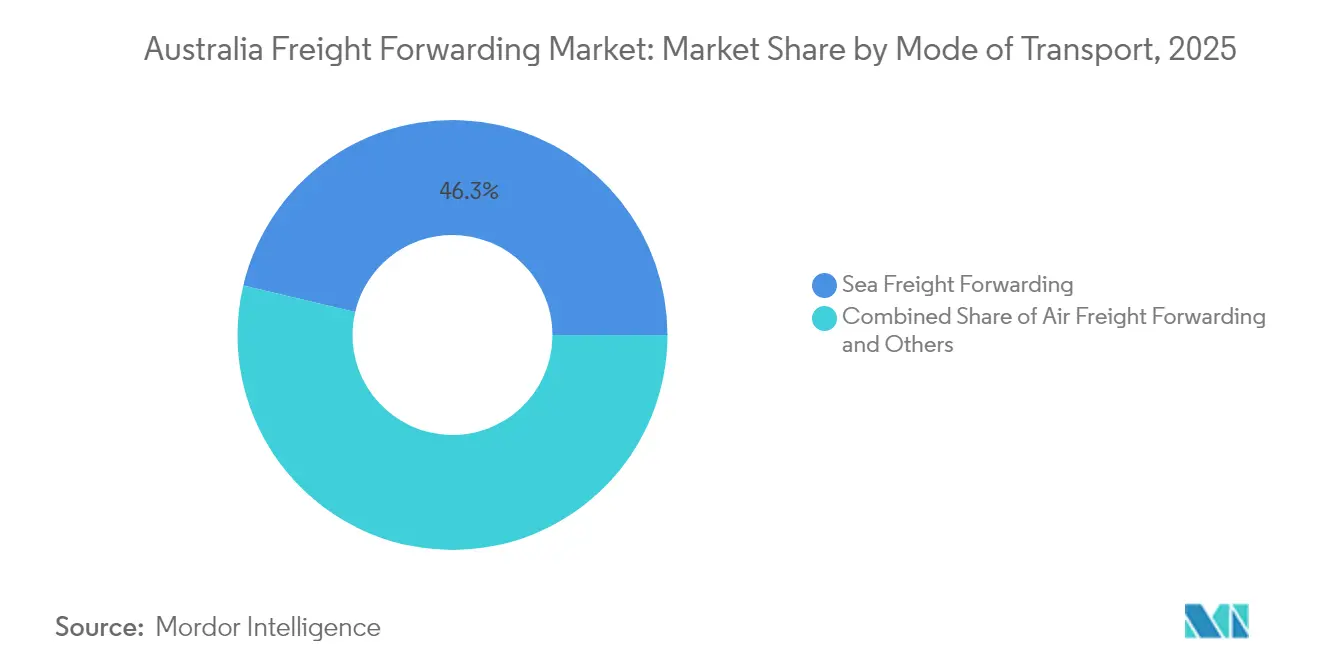
- By mode of transport, Sea Freight Forwarding led with 46.30% of Australia freight forwarding market share in 2025, while Air Freight Forwarding records the fastest 4.24% CAGR through 2031.
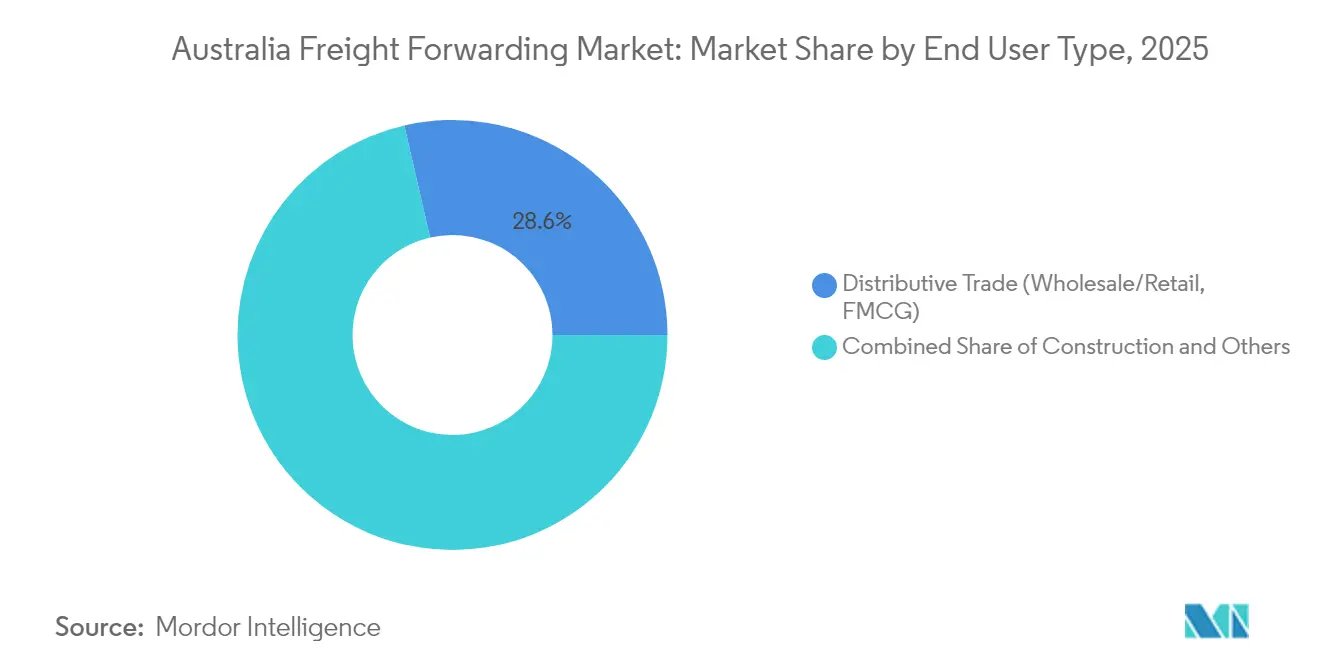
- By end user, Distributive Trade captured 28.60% of Australia freight forwarding market size in 2025 and advances at a 4.58% CAGR between 2026-2031.
Note: Market size and forecast figures in this report are generated using Mordor Intelligence’s proprietary estimation framework, updated with the latest available data and insights as of 2026.
Australia Freight Forwarding Market Trends and Insights
Drivers Impact Analysis*
| Driver | % Impact on CAGR Forecast | Geographic Relevance | Impact Timeline |
|---|---|---|---|
| Surge in bulk commodity exports | +1.2% | WA, QLD, NSW ports | Medium term (2-4 years) |
| Government mega-projects boosting freight infrastructure | +0.8% | Melbourne-Brisbane corridor | Long term (≥ 4 years) |
| E-commerce parcel boom (B2C) | +1.0% | Sydney, Melbourne urban hubs | Short term (≤ 2 years) |
| Growth in temperature-controlled biotech exports | +0.4% | Melbourne, Sydney pharma clusters | Medium term (2-4 years) |
| Blockchain trade-document pilots | +0.3% | Botany, Melbourne, Brisbane ports | Long term (≥ 4 years) |
| Outbound battery-mineral flows | +0.6% | WA lithium triangle, QLD REE belts | Medium term (2-4 years) |
| Source: Mordor Intelligence | |||


Surge in Bulk Commodity Exports
Australia shipped 902 million t of lithium-rich ore in 2024 and now accounts for 46% of global supply, a dynamic that has spawned demand for certified handling, bespoke sampling and real-time traceability solutions. The rebound in Chinese coal buying boosted east-coast port throughput and incentivized investments in rapid-loaders and deeper berths. Iron-ore earnings remain the backbone of outbound volumes even as green-steel initiatives tilt buyers toward higher-grade hematite, cementing the role of Pilbara supply chains in the Australia freight forwarding market. Forwarders that have pre-qualified for critical-minerals documentation standards are capturing long-term contracts with global battery makers. Rising ore and concentrate demand is also stimulating intermodal services that link mine sites with dedicated export terminals, widening revenue streams for operators fluent in both rail and sea modalities[1]“Soft World Growth Affecting Australia's Commodity Earnings,” Australian Government, industry.gov.au.
Government Mega-Projects Boosting Freight Infrastructure
The USD 14.5 billion Inland Rail cuts Melbourne-to-Brisbane transit to under 24 hours and allows 108-B-Double-equivalent double-stack trains, adding capacity for 2 million t of agricultural cargo to shift from road to rail annually[2]“Inland Rail,” Narromine Shire Council, narromine.nsw.gov.au. Parallel investments USD 1 billion for flood-proofing the Trans-Australian line and a USD 280 million (AUD 400 million) Port Botany rail-expansion lower freight costs by USD 7-10 per t and make multimodal routing commercially viable. The Somerton Intermodal Terminal opens in 2025 with direct shuttles to Melbourne’s docks, allowing forwarders to integrate port rail links into nationwide contracts. Improved terminal automation, such as SABRE’s fully robotized on-dock facility, reduces dwell time and raises predictable service levels, a crucial attribute as shippers pivot to just-in-time inventory models. Collectively, these corridors reshape competitive dynamics by favoring forwarders that own or lease rail space, accelerating the Australia freight forwarding market’s modal diversification.
E-commerce Parcel Boom (B2C)
Monthly online sales averaged USD 4.175 billion by June 2025, with electronics alone comprising 23% of receipts and demanding same-day or 48-hour delivery promises. A cross-border share of 10% drives uptake of customs-pre-clearance solutions and bonded micro-fulfillment centers near airports. Urban congestion charges in Sydney and Melbourne elevate the appeal of consolidated air-cargo charters feeding local last-mile networks. Cart-abandonment rates above 62% incentivize forwarders to integrate real-time track-and-trace APIs, improving shopper confidence and boosting repeat purchase rates key metrics for platform sellers and a growth lever inside the Australia freight forwarding market.
Growth in Temperature-Controlled Biotech Exports
CSL and other pharma majors are expanding Victorian biomanufacturing capacity, triggering a wave of cold-chain warehouse builds such as Toll’s 10,000 m² Tullamarine hub geared to vaccine exports[3]“Sydney Autostrad Botany Rail Expansion Wins Award,” MHD, mhdsupplychain.com.au . Real-time IoT sensors, advanced insulation and active containers are becoming baseline tender requirements as global clients enforce CFR IATA temperature mandates. Australia’s reputation for regulatory rigor positions local forwarders as preferred leads on clinical-trial logistics and cell-therapy shipments, segments that deliver premium yield per kg. Packaging-innovation forecasts point to a USD 26.2 billion global market by 2030, creating parallel revenue avenues in ancillary services. These attributes elevate pharma logistics to a strategic pillar of the Australia freight forwarding market.
Restraints Impact Analysis*
| Restraint | % Impact on CAGR Forecast | Geographic Relevance | Impact Timeline |
|---|---|---|---|
| Stringent emissions & decarbonization rules | -0.7% | National ports & road corridors | Medium term (2-4 years) |
| Near-shoring of manufacturing to SE-Asia | -0.5% | Main export routes | Long term (≥ 4 years) |
| Shortage of licensed customs brokers | -0.4% | Regional gateways | Short term (≤ 2 years) |
| Cabotage rules causing coastal volatility | -0.2% | Domestic sea routes | Medium term (2-4 years) |
| Source: Mordor Intelligence | |||
Stringent Emissions and Decarbonization Rules
Transport produces 21% of Australia’s emissions, and road freight accounts for 84% of that load. A New Vehicle Efficiency Standard effective January 2025 introduces fleet-average CO₂ caps, prompting forwarders like Toll to allocate USD 140 million (AUD 200 million) for Euro 6 prime movers. The IMO carbon levy would add cost to iron-ore voyages, tightening margins unless fuel-efficiency gains offset surcharges[4]“Somerton Intermodal Terminal,” Infrastructure Partnerships Australia, infrastructurepipeline.org. Forwarders slow to deploy low-emission vehicles or to secure verified carbon-offset programs risk exclusion from shippers’ preferred-supplier lists. Compliance costs and cap-ex requirements compress profitability in the near term, moderating growth in the Australia freight forwarding market until fleets modernize.
Near-Shoring of Manufacturing to Southeast Asia
Electronics and apparel brands are shifting final-assembly sites to Vietnam and Indonesia to hedge geopolitical risk and reduce landed costs, diverting some upstream cargo away from Australian plants. While the re-routing lowers inbound container volumes, it simultaneously increases transshipment opportunities for forwarders with ASEAN hubs. The long-term effect is a net reduction in domestic manufacturing-linked freight but opens scope to reposition Australia as a critical-minerals supplier feeding those factories. Forwarders dependent on intra-state truckload flows to local assembly lines must diversify or face underutilized assets, tempering topline momentum in the Australia freight forwarding market.
*Our forecasts treat driver/restraint impacts as directional, not additive. The impact forecasts reflect baseline growth, mix effects, and variable interactions.
Segment Analysis
By Mode of Transport: Sea Freight Remains Dominant While Air Accelerates
Sea Freight Forwarding generated 46.30% of Australia freight forwarding market size in 2025 as bulk commodities and containerized consumer goods funneled through six mega-ports processing 3.3 million TEU annually. Full-container-load services anchor long-haul Asia-Pacific lanes, while less-than-container-load demand is rising with small e-commerce parcels seeking economical consolidation. Investments in automated straddle carriers and on-dock rail at Port Botany and Fremantle compress turnaround times and improve vessel productivity, reinforcing sea freight’s pricing advantage. Larger vessels cascading into Australian loops post-Panama Canal expansion further enhance slot supply, exerting downward pressure on unit rates and sustaining high commodity export competitiveness.
Air Freight Forwarding, though a smaller slice, grows at 4.24% CAGR to 2031, the fastest across modes. Bilateral capacity with India is up 82% versus pre-pandemic levels, and Qantas’ A321XLR deliveries unlock new route pairs ideal for lithium concentrates and high-value biotech consignments. Online shoppers’ premium on delivery speed legitimizes price spreads over ocean freight, while battery-mineral exporters pay for shorter cash-conversion cycles. The competitive landscape is tilting toward forwarders that can marry air capacity with bonded urban micro-warehouses and robust last-mile fleets, expanding total addressable share inside the Australia freight forwarding market.


By End User: Distributive Trade Drives Digital Commerce Transformation
Distributive Trade held 28.60% of Australia freight forwarding market share in 2025 and is forecast to post a 4.58% CAGR through 2031, propelled by omnichannel retailers outsourcing fulfillment to 3PLs. Electronics and fast-moving consumer goods dominate volume growth, pressing forwarders to deploy real-time inventory visibility and same-day delivery nodes. The proliferation of buy-now-pay-later platforms intensifies peak-season surges, rewarding operators with elastic capacity and strong courier partnerships. Retailers also favor providers that can integrate carbon-footprint reporting into customer interfaces, aligning with corporate sustainability commitments.
Manufacturing & Automotive lags as near-shoring trends redirect component flows to Southeast Asia and New Zealand. Still, specialist projects such as CEVA Logistics’ contract for Electric-SUV imports show that value persists in automotive pipeline management. Mining & Quarrying continues to generate heavy-lift and bulk opportunities, while Agriculture maintains stable export tonnage, increasingly utilizing rail corridors upgraded under Inland Rail. Pharmaceuticals constitute a high-margin niche tied to temperature-controlled infrastructure commitments like Toll’s Tullamarine site, cementing a multi-segment revenue blend across the Australia freight forwarding market.
Geography Analysis
New South Wales leverages Port Botany’s automated on-dock rail terminal to process up to 3 million TEU per year, anchoring the nation’s highest value-density import flows for consumer electronics and fashion. Freight activity is projected to scale to AUD 130 billion (USD 91 billion) as on-port rail expansions shave truck trips and speed container evacuations. Victoria benefits from the Port of Melbourne’s record container throughput and the 2025 launch of Somerton Intermodal Terminal, enhancing last-mile efficiency into Melbourne consumer hubs.
Western Australia dominates volume tonnage thanks to Kwinana and Port Hedland iron-ore load-outs, alongside lithium concentrate exports from the Pilbara and Goldfields. Dedicated mineral railways synchronize with 250,000 dwt capesize berth windows, limiting demurrage and driving scale economics in the Australia freight forwarding market. Queensland’s diversified portfolio coal, agriculture and nascent hydrogen exports leverages upgrades to the Mount Isa Line and potential Toowoomba-to-Gladstone Inland Rail extension to tighten Asia-bound transit times. South Australia’s Port Lincoln grain corridor and Tasmania’s Lyell Highway upgrade ensure regional producers maintain access to global buyers, albeit at smaller volumes.
Competitive Landscape
Industry concentration intensified when DSV absorbed DB Schenker, creating a USD 45 billion giant that realigns procurement leverage in air and ocean contracts. Toll Group counters through USD 70 million (AUD 100 million) technology upgrades, Transolve Global’s takeover, and a Euro 6 fleet refresh, cementing its domestic scale and cross-border reach. Digital disrupters such as Ofload deploy AI-enabled DataVerse to capture scope three emissions data and win contracts from ESG-focused shippers.
Licensed customs-broker scarcity favors acquisitive players able to lock in scarce talent, while SME forwarders seek niche differentiation in biotech or critical-mineral documentation. Blockchain pilots and API-driven rate engines become table stakes for tender participation, reinforcing a technology arms race. Market entrants like OIA Global purchase local operators to gain immediate footprint, confirming that inorganic pathways remain an efficient route to relevance in the Australia freight forwarding market.
Australia Freight Forwarding Industry Leaders
CTS Australia
Platinum Freight Management
Think Global Logistics
Yusen Logistics (Australia) Pty. Ltd.
Mainfreight Limited
- *Disclaimer: Major Players sorted in no particular order

Recent Industry Developments
- June 2025: Toll Group completed the Transolve Global acquisition.
- April 2025: DSV finalized its USD 23.6 billion DB Schenker acquisition.
- March 2025: CEVA Logistics secured the Geely contract to import electric SUVs into Australia.
- January 2025: DP World and NSW Ports committed USD 280 million (AUD 400 million) to expand Port Botany rail capacity.


Australia Freight Forwarding Market Report Scope
The coordination and shipment of goods from one location to another via single or multiple carriers through air, sea, rail, or highway is known as freight forwarding. Freight forwarding principles are based on the efficient and cost-effective transfer of goods that are kept in good condition throughout their journey.
The Australia Freight Forwarding Market is segmented by mode of transport (air freight forwarding, ocean freight forwarding, road freight forwarding, and rail freight forwarding), customer type (B2C and B2B), application (industrial and manufacturing, retail, healthcare, oil and gas, food and beverages and other application).
The report offers market size and forecast values (USD) for all the above segments and the COVID-19 impact is comprehensively covered in this report.
| Air Freight Forwarding | |
| Sea Freight Forwarding | Full-Container-Load (FCL) |
| Less-than-Container-Load (LCL) | |
| Others |
| Manufacturing and Automotive |
| Oil and Gas, Mining and Quarrying |
| Agriculture, Fishing and Forestry |
| Construction |
| Distributive Trade (Wholesale/Retail, FMCG) |
| Other End Users (Telecom, Pharmaceutical, etc.) |
| By Mode of Transport (Value, USD bn) | Air Freight Forwarding | |
| Sea Freight Forwarding | Full-Container-Load (FCL) | |
| Less-than-Container-Load (LCL) | ||
| Others | ||
| By End User (Value, USD bn) | Manufacturing and Automotive | |
| Oil and Gas, Mining and Quarrying | ||
| Agriculture, Fishing and Forestry | ||
| Construction | ||
| Distributive Trade (Wholesale/Retail, FMCG) | ||
| Other End Users (Telecom, Pharmaceutical, etc.) | ||


Key Questions Answered in the Report
How fast is freight-forwarding revenue expanding in Australia?
The Australia freight forwarding market is growing at a 4.12% CAGR, rising from USD 3.47 billion in 2025 to USD 4.42 billion by 2031.
Which transport mode controls the largest share of forwarder revenue?
Sea freight holds 46.30% of Australia freight forwarding market share due to bulk-commodity exports through major ports.
Why is Air Freight Forwarding gaining momentum?
E-commerce urgency and critical-mineral consignments are lifting air volumes, producing a 4.24% CAGR for the mode through 2031.
What segment leads demand by end user?
Distributive Trade (wholesale/retail, FMCG) contributes 28.60% of revenue and posts the fastest 4.58% CAGR to 2031.
How do emissions rules affect logistics providers?
New vehicle efficiency standards and impending maritime carbon levies raise fleet-upgrade costs but favor operators investing early in low-emission technologies.
What skill shortage poses the biggest operational risk?
A dwindling pool of only 1,551 licensed customs brokers threatens clearance times and inflates brokerage fees.
Page last updated on:


