China Feed Probiotics Market Size and Share
Market Overview
| Study Period | 2018 - 2031 |
|---|---|
| Forecast Data Period | 2026 - 2031 |
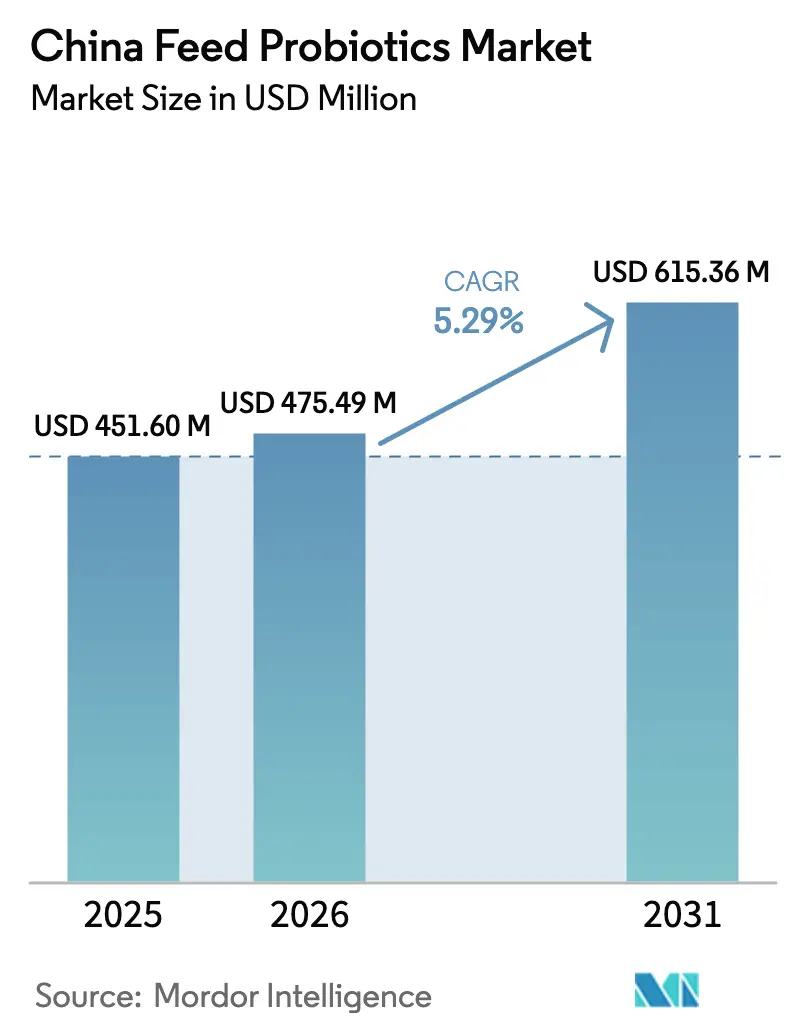
| Base Year Market Size (2025) | USD 451.60 Million |
| Market Size (2026) | USD 475.49 Million |
| Market Size (2031) | USD 615.36 Million |
| Growth Rate (2026 - 2031) | 5.29% CAGR |
| Market Concentration | Medium |
Major Players *Disclaimer: Major Players sorted in no particular order Image © Mordor Intelligence. Reuse requires attribution under CC BY 4.0. | |
China Feed Probiotics Market Analysis by Mordor Intelligence
The China feed probiotics market size was valued at USD 451.60 million in 2025 and estimated to grow from USD 475.49 million in 2026 to reach USD 615.36 million by 2031, at a CAGR of 5.29% during the forecast period (2026-2031). Rising demand for antibiotic-free meat, the enforcement of the national ban on medicated feed additives, and expanding domestic manufacturing capacity together underpin a steady medium-term outlook. China’s total feed output dipped in 2024, and producers responded by redirecting budgets toward higher-value functional additives like probiotics. Large integrators now allocate 15%-20% more to gut-health solutions than before the ban, while smaller farms adopt selectively as profitability allows. Strategic joint ventures between multinational ingredient firms and Chinese biotechnology companies shorten supply chains, reduce landed costs, and ensure strain viability through locally optimized micro-encapsulation. Consequently, probiotics have moved from niche supplements to mainstream growth promoters across poultry, swine, ruminant, and aquaculture operations, embedding the Chinese feed probiotics market firmly within the nation’s protein self-sufficiency agenda.
Key Report Takeaways
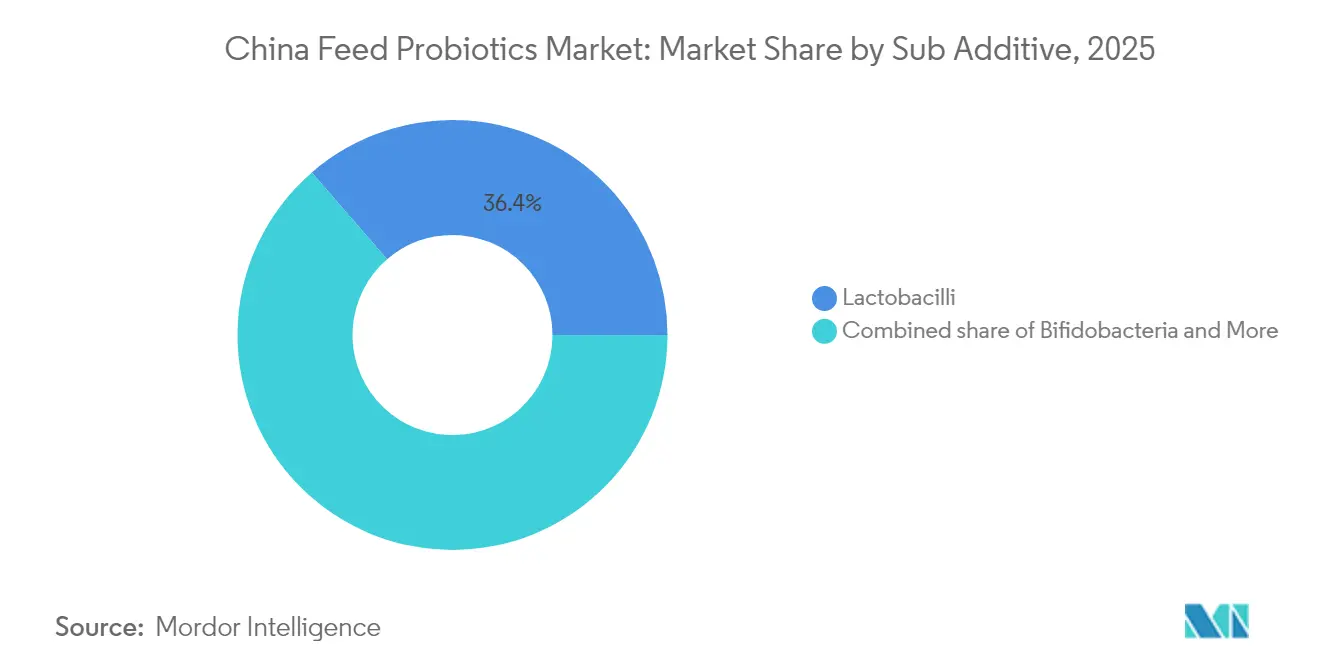
- By sub-additive, Lactobacilli led the China feed probiotics market size with a 36.35% revenue share in 2025, while Bifidobacteria was projected to record the highest CAGR of 5.47% through 2031.
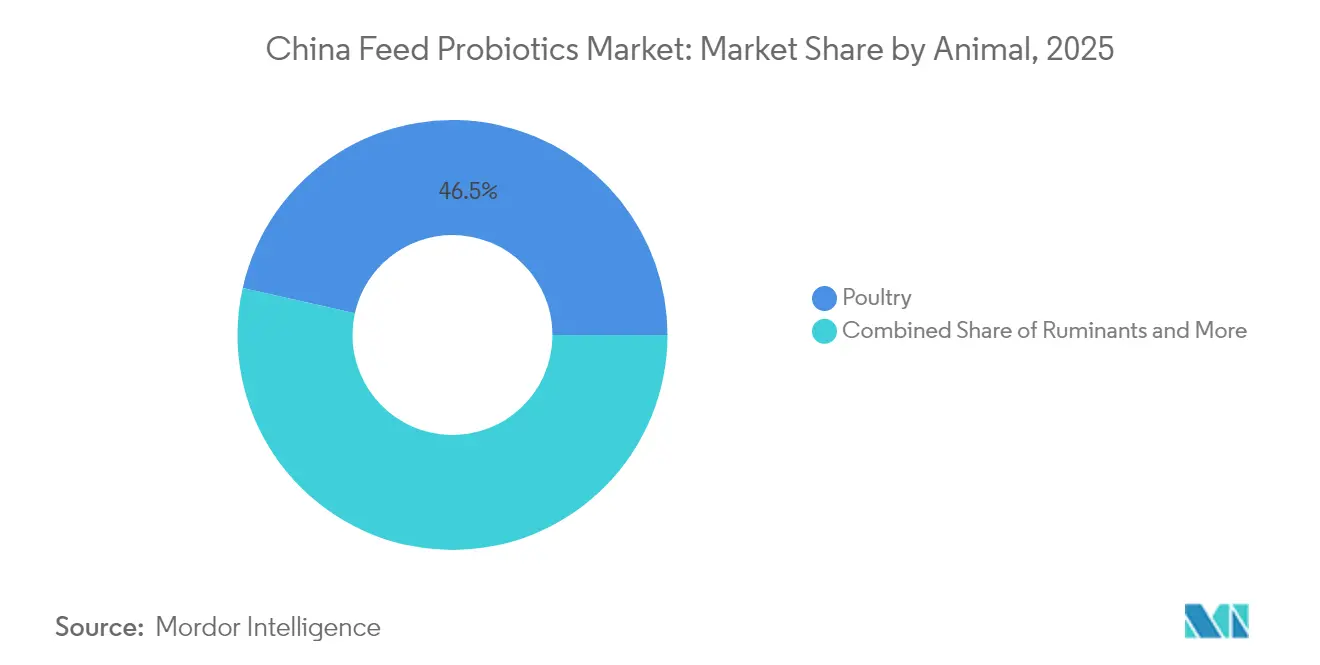
- By animal, poultry held 46.50% of the Chinese feed probiotics market share in 2025, and ruminants are advancing at a 6.05% CAGR to 2031.
Note: Market size and forecast figures in this report are generated using Mordor Intelligence’s proprietary estimation framework, updated with the latest available data and insights as of 2026.
China Feed Probiotics Market Trends and Insights
Drivers Impact Analysis*
| Driver | (~) % Impact on CAGR Forecast | Geographic Relevance | Impact Timeline |
|---|---|---|---|
| Transition away from antibiotic growth promoters | +1.80% | Nationwide and wider Asia-Pacific | Medium term (2-4 years) |
| Government subsidy schemes for gut-health additives | +1.20% | Core livestock provinces | Short term (≤ 2 years) |
| Rapid expansion of large-scale layer integrations | +0.90% | Eastern provinces | Medium term (2-4 years) |
| High consumer demand for antibiotic-free pork | +1.10% | Tier-1 urban retail | Long term (≥ 4 years) |
| Emergence of synbiotic blends tailored to Chinese feed formulations | +0.70% | Domestic R&D hubs | Long term (≥ 4 years) |
| Domestic production capacity build-out for micro-encapsulated probiotics | +0.60% | Qingdao and Tianjin | Medium term (2-4 years) |
| Source: Mordor Intelligence | |||


Transition Away From Antibiotic Growth Promoters
The July 2020 enforcement of MARA Announcement 194 eliminated medicated feed additives, creating an immediate opportunity for functional replacements. Integrators quickly shifted 15%-20% of additive budgets toward multi-strain probiotic cocktails that improve feed conversion by 3%-7%. Export-oriented pork and poultry processors benefit from 8%-12% premiums attached to certified antibiotic-free products in the European Union and Japan [1]Source: China Meat Association, “Antibiotic-Free Meat Market Analysis,” CMA.ORG.CN Source: China Chain Store and Franchise Association, “Consumer Preferences Survey,” CCFA.ORG.CN . Feed mills now standardize inclusion at 0.5-1.0 kilogram per metric ton, selecting strains based on stability and documented efficacy rather than the lowest cost per kilo. The policy change transformed procurement strategies, prioritizing data-backed solutions and technical support packages. Demand spread beyond compliance as global retailers tightened residue guidelines, locking the Chinese feed probiotics market into strategic growth.
Government Subsidy Schemes For Gut-Health Additives
The Ministry of Agriculture’s Healthy Breeding Initiative disbursed a significant amount in 2024 specifically for functional feed additives[2]Source: Ministry of Agriculture and Rural Affairs, “Ban on Medicated Feed Additives,” MOA.GOV.CN. Provincial co-funding in Shandong, Henan, and Hebei reduced probiotic costs, creating demand floors during cyclical downturns. Domestic suppliers partnered with Chinese cooperatives to access larger quotas and priority in tender processes. Precision feeding mandates tied to subsidy receipt pushed integrators to install on-farm dosing automation and remote performance monitoring. Measure-and-reward frameworks fostered a culture of data-driven nutrition, lifting adoption even among mid-tier producers. As a result, subsidies account for nearly one-third of first-time probiotic purchases in layer and dairy operations, firmly anchoring the Chinese feed probiotics market to public policy objectives.
Rapid Expansion Of Large-Scale Layer Integrations
Eastern China’s layer industry consolidated into units exceeding 2 million metric tons of annual feed throughput by 2024. These vertically integrated players demand uniform probiotic specifications across multiple contract sites to secure 3%-5% gains in egg production and consistent shell quality. Suppliers able to guarantee regional inventory, cold-chain integrity, and on-site training dominate bid awards. Centralized procurement pools translate into multi-year off-take agreements that stabilize manufacturing volumes. Integration accelerates the rollout of advanced storage silos, automatic dispensers, and continuous water-line dosing, embedding probiotics as an everyday input rather than a specialty additive. The resultant economies of scale and predictable demand cycles strengthen forward visibility for the China feed probiotics market.
Emergence Of Synbiotic Blends Tailored to Chinese Feed Formulations
Local partnerships between international suppliers and Chinese universities developed Lactobacilli with galacto-oligosaccharides optimized for corn-soybean meal diets, improving feed efficiency by 2%. North-south climate differentiation inspired strain variants tolerant to cold or heat stress. Customized blends fetch price premiums and deepen customer loyalty, especially among integrators seeking tailored solutions. Ongoing formulation refinement extends product life cycles beyond generic offerings. Intellectual property co-ownership guards competitive edges while supporting domestic innovation policy. The trend shifts competition from price to performance, driving value accretion within the Chinese feed probiotics market.
Restraints Impact Analysis*
| Restraint | (~) % Impact on CAGR Forecast | Geographic Relevance | Impact Timeline |
|---|---|---|---|
| Price sensitivity among smallholder swine farmers | -1.30% | Rural traditional regions | Short term (≤ 2 years) |
| Regulatory delays in strain registration | -0.80% | National framework | Medium term (2-4 years) |
| Competition from postbiotic alternatives | -0.60% | Premium segments | Long term (≥ 4 years) |
| Supply-chain volatility for freeze-drying media | -0.40% | Import-dependent areas | Short term (≤ 2 years) |
| Source: Mordor Intelligence | |||
Price Sensitivity Among Smallholder Swine Farmers
Smallholders still account for 60% of national hog output, yet operate on 3%-5% net margins. When farm-gate prices fall and margins compress below USD 28 per head, producers immediately remove functional additives to conserve cash. Typical probiotic inclusion costs USD 2.10-3.50 per metric ton, a sizable outlay during downturns. Fragmented buying power means few have access to volume discounts or supplier credit lines. Rural finance channels rarely extend working capital for feed additives, forcing producers into spot purchases. The boom-bust hog cycle thus creates 40%-50% swings in probiotic demand. Seasonal disease pressure can soften resistance, but the structural income constraint continues to cap upside for the China feed probiotics market in lower-income counties.
Regulatory Delays In Strain Registration
Approval for a new probiotic strain averages 18 months for safety trials and documentation. Foreign firms face added translation and local testing mandates, extending timelines beyond domestic peers. Priority goes to strains tied to national livestock health programs, leaving other innovations waiting. The lag allows incumbents with approved strains to entrench positions and extends payback horizons on R&D investment. Long review cycles dissuade smaller players from entering, restraining competition, and delaying advanced solutions that could energize the Chinese feed probiotics market.
*Our forecasts treat driver/restraint impacts as directional, not additive. The impact forecasts reflect baseline growth, mix effects, and variable interactions.
Segment Analysis
By Sub Additive: Lactobacilli Retain Volume Leadership
Lactobacilli captured 36.35% of the Chinese feed probiotics market share in 2025, due to decades of validation in swine and poultry systems. Producers rely on Lactobacillus acidophilus and Lactobacillus plantarum to sustain 3%-7% feed efficiency gains over multiple production phases, cementing repeat orders from large integrators. Conversely, Bifidobacteria posted a 5.47% CAGR outlook to 2031, driven by its oxygen-sensitive metabolism that supports gut maturation in piglets and chicks under stress. The Chinese feed probiotics market size for Bifidobacteria is projected to widen as specialized nursery diets standardize inclusion. Enterococcus serves aquaculture, where salt tolerance is paramount, while Pediococcus supports silage fermentation and mycotoxin suppression in dairy rations. Robust Bacillus spores in the Other Probiotics bucket thrive in pelleted feeds exposed to 85 °C conditioning, thus broadening usage among feed mills upgrading to higher throughput lines.
The competitive focus within the sub-additive spectrum has shifted from raw volume to match business models. Suppliers differentiate via encapsulation coatings, viability guarantees, and evidence packages suited to MARA dossier requirements. Joint ventures expedite domestic trials and streamline labeling in Chinese. With the implementation of performance-linked purchase contracts, integrators extract penalty clauses for underperforming strains, pushing providers to bolster quality assurance and batch tracking. Over the forecast horizon, developers are anticipated to allocate greater R&D budgets to synbiotic designs that pair Lactobacilli or Bifidobacteria with cost-effective prebiotics derived from sugar industry by-products, enlarging the addressable slice of the China feed probiotics market.


By Animal: Poultry Drives Volume While Ruminants Post Fastest Growth
Poultry operations consumed 46.50% of China's feed probiotics market in 2025, a product of standardized broiler cycles and the nation’s 15 billion commercial layers. Broiler feed lines account for 60% of segment demand, with layer rations absorbing another 35%. Contract growers align with integrator protocols that stipulate probiotic inclusion as part of guaranteed performance packages. The Chinese feed probiotics market size attributable to poultry thus remains stable and widely distributed across provinces.
Ruminants, particularly dairy herds, are projected to register a 6.05% CAGR through 2031. Holstein farms modernizing parlors toward 12,000-kilogram milk yields, adopting probiotics to stabilize rumen pH, reduce sub-acute acidosis, and enhance reproductive performance. Government grants for dairy upgrades cover 10%-12% of feed additive trials, accelerating testing. Swine applications face pronounced cyclicality tied to hog price swings, but continuous biosecurity upgrades following the African swine fever outbreak favor functional additives when margins allow. Aquaculture, although the smallest by value, demands high-purity strains able to modulate water quality, positioning Bacillus and Enterococcus as key species. Further penetration among goats and sheep in western provinces awaits broader distribution reach and tailored field demonstration kits, carving incremental opportunity in the diversified animal spectrum of the Chinese feed probiotics market.
Geography Analysis
Shandong generated roughly one-quarter of national sales in 2025 on the strength of its 45 million metric tons feed industry and dense poultry integration cluster. The province’s established feed mills and cold-chain logistics maintain viability levels above 90% on delivery, reinforcing repeat purchasing. Hebei and Henan together contributed another 30.00% of the Chinese feed probiotics market size, leveraging proximity to Beijing’s research campuses and the presence of global additive headquarters. Eastern producers routinely participate in MARA-recognized trials, accelerating label claims and on-pack endorsements that justify premium pricing.
Growth is pivoting inland as livestock capacity shifts away from environmentally constrained coastal zones. Sichuan’s swine expansion and Inner Mongolia’s 1 million-cow dairy aspiration produce regional growth rates that exceed the national average by 2-3 percentage points. Suppliers respond by setting up satellite warehouses and recruiting Mandarin-Mongolian bilingual field technicians. Climate extremes require adapted formulations including heat-stable Bacillus for southern humid basins and cold-resilient Bifidobacteria for high-altitude grasslands. Subsidy programs follow the migration, cushioning early adoption costs and embedding probiotics in new production hubs, thereby enlarging the Chinese feed probiotics market.
Southern coastal provinces specialize in aquaculture, where fish and shrimp operations allocate up to 3% of feed budgets to water-conditioning probiotics. Guangdong, Guangxi, and Hainan seek encapsulated or postbiotic solutions able to tolerate 35 °C ambient storage and brackish pond systems. Export-facing processors apply HACCP (Hazard Analysis and Critical Control Point) and EU white-list standards, compelling additives with robust documentation. Cross-border commerce allows Chinese suppliers to re-export volumes to Vietnam, Thailand, and Indonesia, turning the south into a springboard that broadens the regional influence of the Chinese feed probiotics market.
Competitive Landscape
The top five players hold a significant combined share, indicating moderate concentration and ample space for niche entrants. Joint ventures underpin the competitive structure. In 2024, Evonik’s tie-up with Vland Biotech brings German strain libraries and Chinese scale manufacturing under one roof, shortening regulatory timelines and cutting delivery costs by double digits. In 2025, International Flavors and Fragrances extended its Enviva PRO range to swine, using local trials to demonstrate 2.5% weight-gain improvements and 6.3% diarrhea reduction, thereby lifting credibility among integrators.
Technical services differentiate market leaders. Providers embed veterinarians and nutritionists at mega-farms to monitor outcomes and adjust inclusion rates. Digital platforms collect feed-conversion and health scores, feeding dashboards that guide re-ordering. Domestic innovators like Angel Yeast leverage fermentation know-how from the food sector to produce GroPro direct-fed microbials at competitive cost.
Louis Dreyfus initiated a fermented soybean meal line synergized with multi-strain probiotics, illustrating convergence between protein concentrates and gut-health solutions. Collectively, strategic moves indicate a tilt toward integrated nutrition systems rather than single-ingredient offerings, deepening the value proposition within the China feed probiotics market.
China Feed Probiotics Industry Leaders
Adisseo (China National Bluestar Group)
International Flavors and Fragrances Inc. (Danisco Animal Nutrition and Health)
Cargill, Incorporated
Evonik Industries AG
DSM-Firmenich AG
- *Disclaimer: Major Players sorted in no particular order

Recent Industry Developments
- March 2025: International Flavors and Fragrances introduced Enviva PRO, a probiotic supplement for weaned piglets, which demonstrated a 2.5% improvement in weight gain during domestic trials. This development strengthens China's feed probiotic market by offering enhanced growth performance solutions for livestock producers.
- March 2024: Evonik and Vland Biotech established a joint venture in Qingdao to develop gut-health solutions, with Evonik retaining export rights. This strategic partnership strengthens China's feed probiotic market by combining Evonik's global expertise with Vland Biotech's local market presence, enabling enhanced product development and distribution capabilities.


China Feed Probiotics Market Report Scope
| Bifidobacteria |
| Enterococcus |
| Lactobacilli |
| Pediococcus |
| Streptococcus |
| Other Probiotics |
| Aquaculture | By Sub Animal | Fish |
| Shrimp | ||
| Other Aquaculture Species | ||
| Poultry | By Sub Animal | Broiler |
| Layer | ||
| Other Poultry Birds | ||
| Ruminants | By Sub Animal | Beef Cattle |
| Dairy Cattle | ||
| Other Ruminants | ||
| Swine | ||
| Other Animals |
| Sub Additive | Bifidobacteria | ||
| Enterococcus | |||
| Lactobacilli | |||
| Pediococcus | |||
| Streptococcus | |||
| Other Probiotics | |||
| Animal | Aquaculture | By Sub Animal | Fish |
| Shrimp | |||
| Other Aquaculture Species | |||
| Poultry | By Sub Animal | Broiler | |
| Layer | |||
| Other Poultry Birds | |||
| Ruminants | By Sub Animal | Beef Cattle | |
| Dairy Cattle | |||
| Other Ruminants | |||
| Swine | |||
| Other Animals | |||


Market Definition
- FUNCTIONS - For the study, feed additives are considered to be commercially manufactured products that are used to enhance characteristics such as weight gain, feed conversion ratio, and feed intake when fed in appropriate proportions.
- RESELLERS - Companies engaged in reselling feed additives without value addition have been excluded from the market scope, to avoid double counting.
- END CONSUMERS - Compound feed manufacturers are considered to be end-consumers in the market studied. The scope excludes farmers buying feed additives to be used directly as supplements or premixes.
- INTERNAL COMPANY CONSUMPTION - Companies engaged in the production of compound feed as well as the manufacturing of feed additives are part of the study. However, while estimating the market sizes, the internal consumption of feed additives by such companies has been excluded.
| Keyword | Definition |
|---|---|
| Feed additives | Feed additives are products used in animal nutrition for purposes of improving the quality of feed and the quality of food from animal origin, or to improve the animals’ performance and health. |
| Probiotics | Probiotics are microorganisms introduced into the body for their beneficial qualities. (It maintains or restores beneficial bacteria to the gut). |
| Antibiotics | Antibiotic is a drug that is specifically used to inhibit the growth of bacteria. |
| Prebiotics | A non-digestible food ingredient that promotes the growth of beneficial microorganisms in the intestines. |
| Antioxidants | Antioxidants are compounds that inhibit oxidation, a chemical reaction that produces free radicals. |
| Phytogenics | Phytogenics are a group of natural and non-antibiotic growth promoters derived from herbs, spices, essential oils, and oleoresins. |
| Vitamins | Vitamins are organic compounds, which are required for normal growth and maintenance of the body. |
| Metabolism | A chemical process that occurs within a living organism in order to maintain life. |
| Amino acids | Amino acids are the building blocks of proteins and play an important role in metabolic pathways. |
| Enzymes | Enzyme is a substance that acts as a catalyst to bring about a specific biochemical reaction. |
| Anti-microbial resistance | The ability of a microorganism to resist the effects of an antimicrobial agent. |
| Anti-microbial | Destroying or inhibiting the growth of microorganisms. |
| Osmotic balance | It is a process of maintaining salt and water balance across membranes within the body's fluids. |
| Bacteriocin | Bacteriocins are the toxins produced by bacteria to inhibit the growth of similar or closely related bacterial strains. |
| Biohydrogenation | It is a process that occurs in the rumen of an animal in which bacteria convert unsaturated fatty acids (USFA) to saturated fatty acids (SFA). |
| Oxidative rancidity | It is a reaction of fatty acids with oxygen, which generally causes unpleasant odors in animals. To prevent these, antioxidants were added. |
| Mycotoxicosis | Any condition or disease caused by fungal toxins, mainly due to contamination of animal feed with mycotoxins. |
| Mycotoxins | Mycotoxins are toxin compounds that are naturally produced by certain types of molds (fungi). |
| Feed Probiotics | Microbial feed supplements positively affect gastrointestinal microbial balance. |
| Probiotic yeast | Feed yeast (single-cell fungi) and other fungi used as probiotics. |
| Feed enzymes | They are used to supplement digestive enzymes in an animal’s stomach to break down food. Enzymes also ensure that meat and egg production is improved. |
| Mycotoxin detoxifiers | They are used to prevent fungal growth and to stop any harmful mold from being absorbed in the gut and blood. |
| Feed antibiotics | They are used both for the prevention and treatment of diseases but also for rapid growth and development. |
| Feed antioxidants | They are used to protect the deterioration of other feed nutrients in the feed such as fats, vitamins, pigments, and flavoring agents, thus providing nutrient security to the animals. |
| Feed phytogenics | Phytogenics are natural substances, added to livestock feed to promote growth, aid in digestion, and act as anti-microbial agents. |
| Feed vitamins | They are used to maintain the normal physiological function and normal growth and development of animals. |
| Feed flavors and sweetners | These flavors and sweeteners help to mask tastes and odors during changes in additives or medications and make them ideal for animal diets undergoing transition. |
| Feed acidifiers | Animal feed acidifiers are organic acids incorporated into the feed for nutritional or preservative purposes. Acidifiers enhance congestion and microbiological balance in the alimentary and digestive tracts of livestock. |
| Feed minerals | Feed minerals play an important role in the regular dietary requirements of animal feed. |
| Feed binders | Feed binders are the binding agents used in the manufacture of safe animal feed products. It enhances the taste of food and prolongs the storage period of the feed. |
| Key Terms | Abbreviation |
| LSDV | Lumpy Skin Disease Virus |
| ASF | African Swine Fever |
| GPA | Growth Promoter Antibiotics |
| NSP | Non-Starch Polysaccharides |
| PUFA | Polyunsaturated Fatty Acid |
| Afs | Aflatoxins |
| AGP | Antibiotic Growth Promoters |
| FAO | The Food And Agriculture Organization of the United Nations |
| USDA | The United States Department of Agriculture |


Research Methodology
Mordor Intelligence follows a four-step methodology in all our reports.
- Step-1: IDENTIFY KEY VARIABLES: In order to build a robust forecasting methodology, the variables and factors identified in Step-1 are tested against available historical market numbers. Through an iterative process, the variables required for market forecast are set and the model is built on the basis of these variables.
- Step-2: Build a Market Model: Market-size estimations for the forecast years are in nominal terms. Inflation is not a part of the pricing, and the average selling price (ASP) is kept constant throughout the forecast period.
- Step-3: Validate and Finalize: In this important step, all market numbers, variables and analyst calls are validated through an extensive network of primary research experts from the market studied. The respondents are selected across levels and functions to generate a holistic picture of the market studied.
- Step-4: Research Outputs: Syndicated Reports, Custom Consulting Assignments, Databases & Subscription Platforms


