
Market Overview
| Study Period | 2021 - 2031 |
|---|---|
| Forecast Data Period | 2026 - 2031 |
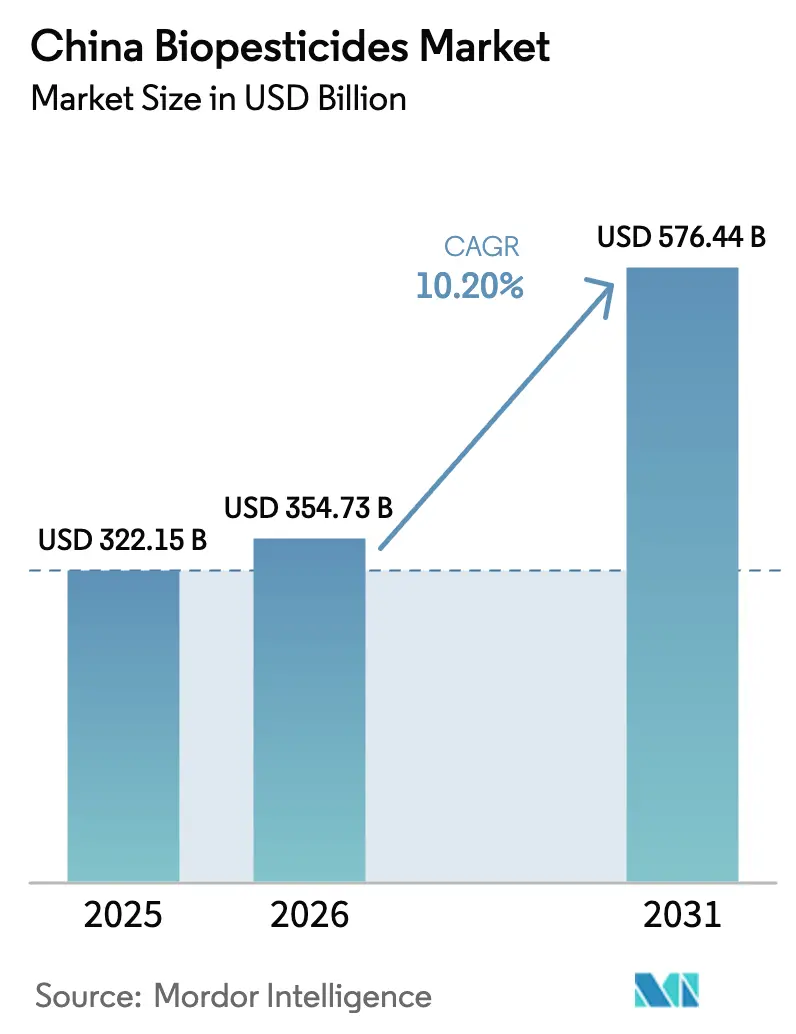
| Base Year Market Size (2025) | USD 322.15 Billion |
| Market Size (2026) | USD 354.73 Billion |
| Market Size (2031) | USD 576.44 Billion |
| Growth Rate (2026 - 2031) | 10.20 % |
| Market Concentration | Medium |
Major Players *Disclaimer: Major Players sorted in no particular order Image © Mordor Intelligence. Reuse requires attribution under CC BY 4.0. | |
China Biopesticides Market Analysis by Mordor Intelligence
The China Biopesticides Market size is anticipated to grow from USD 322.15 billion in 2025 to USD 354.73 billion in 2026 and is forecast to reach USD 576.44 billion by 2031 at a 10.20% CAGR over 2026-2031. Subsidy reimbursements of up to 20% for bio-inputs, chemical-use ceilings embedded in the Fourteenth Five-Year Plan, and expansion of drone spraying across 124 million hectares have moved biologicals from niche inputs to compliance tools. Gene-edited strains that cut fermentation costs by 40%, rising organic-produce premiums in tier-1 cities, and Association of Southeast Asian Nations tariff reductions together widen the commercial runway for suppliers. However, live-microbe viability losses of up to 60% in humid provinces and 24-36 month registration queues for novel strains temper growth prospects.
Key Report Takeaways
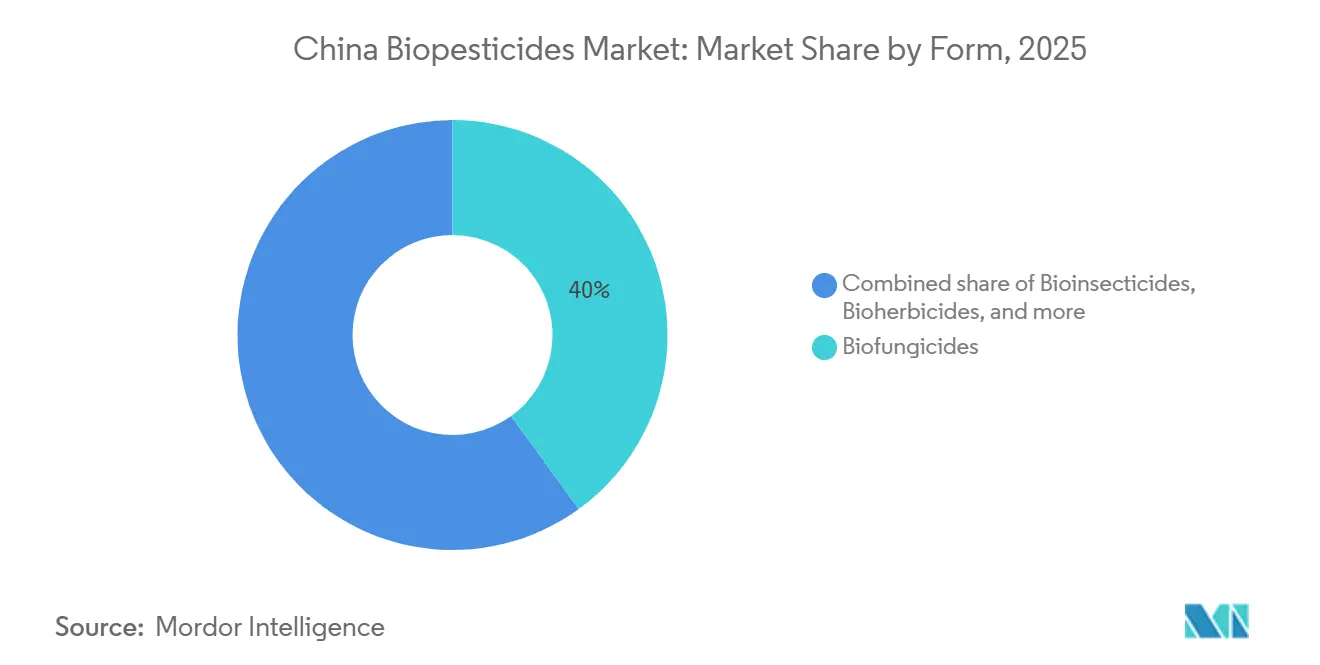
- By form, biofungicides led with 40% revenue share of the China biopesticides market share in 2025, while bioinsecticides are advancing at a 12% CAGR through 2031.
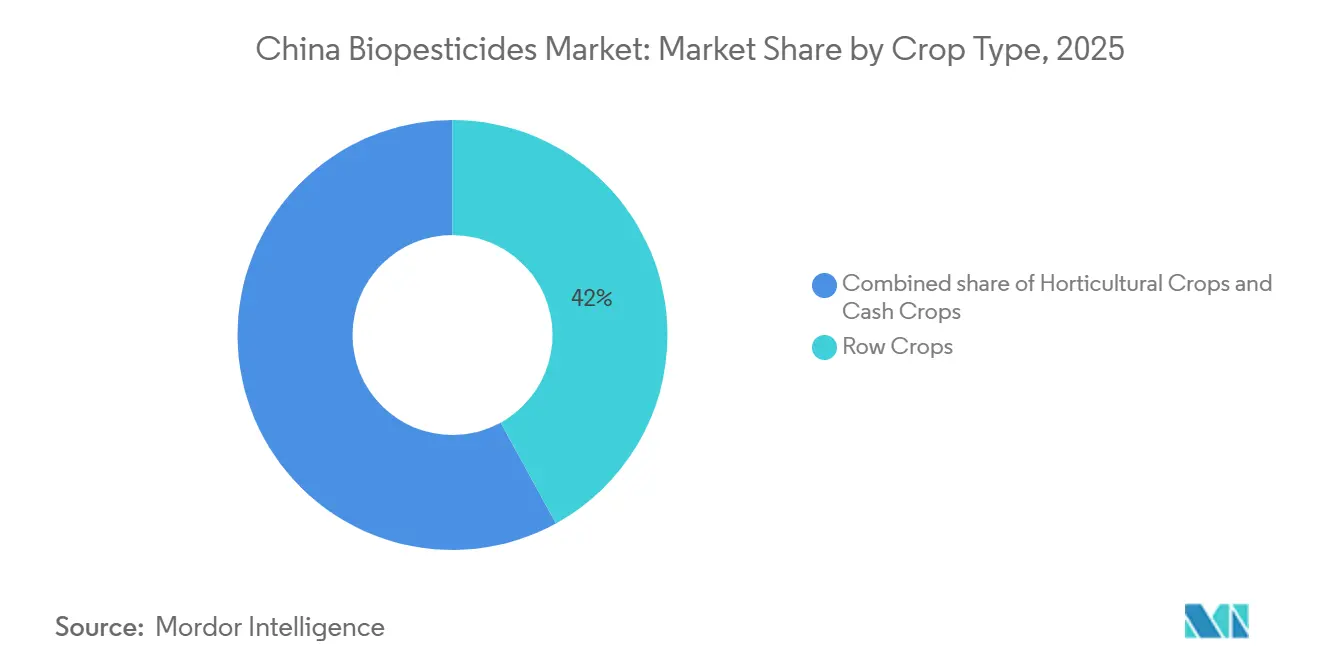
- By crop type, row crops accounted for 42% share of the China biopesticides market size in 2025 and cash crops are projected to expand at an 11% CAGR between 2026-2031.
Note: Market size and forecast figures in this report are generated using Mordor Intelligence’s proprietary estimation framework, updated with the latest available data and insights as of January 2026.
China Biopesticides Market Trends and Insights
Drivers Impact Analysis*
| Driver | (~) % Impact on CAGR Forecast | Geographic Relevance | Impact Timeline |
|---|---|---|---|
| Policy subsidies accelerating adoption | +1.8% | National, higher reimbursement in Zhejiang, Jiangsu, Shandong, Guangdong | Short term (≤ 2 years) |
| Mandatory chemical-use reduction targets | +1.5% | National, enforced by provincial bureaus | Medium term (2-4 years) |
| Rising organic-food premium demand | +1.2% | Tier-1 cities with spill-over to tier-2 | Medium term (2-4 years) |
| Drone-enabled precision spraying | +1.0% | National, highest in Hunan, Jiangxi, Heilongjiang, Xinjiang | Short term (≤ 2 years) |
| Synthetic-biology cost reductions | +0.9% | Fermentation hubs in Shandong, Hebei, Jiangsu | Long term (≥ 4 years) |
| Export momentum to Association of Southeast Asian Nations (ASEAN) and Europe | +0.7% | Shandong, Zhejiang, Guangdong export zones | Medium term (2-4 years) |
| Source: Mordor Intelligence | |||
Policy Subsidies Accelerating Adoption
In April 2024 the Ministry of Agriculture and Rural Affairs earmarked USD 199.8 million for integrated pest-management programs that reimburse growers up to 20% of biological input costs[1]Source: Ministry of Agriculture and Rural Affairs, “Integrated Pest Management Subsidy Programs 2024,” moa.gov.cn. Disbursement is contingent on documented 10% year-on-year reductions in synthetic active ingredients, a rule that converts biopesticides into compliance essentials rather than optional add-ons. Cooperatives and family farms above 3.3 hectares qualify automatically, capturing the segment most capable of managing precise spray protocols. Provincial bureaus in Zhejiang and Jiangsu have streamlined e-voucher systems that credit reimbursements within seven days of invoice upload, improving cash-flow for growers. Guangdong extension stations bundle subsidy access with storage and timing workshops, closing the knowledge gap that previously curbed uptake. Early impact assessments show treated acreage rising 32% in pilot counties during the first season, confirming the subsidy’s catalytic role.
Mandatory Chemical-Use Reduction Targets
The Fourteenth Five-Year Plan (2021-2025) locks in absolute tonnage ceilings that force a 10% cut in pesticide use on fruit and vegetables and 5% on major grains versus the 2016-2020 baseline. Unlike the zero-growth policy achieved in 2017, the new framework caps volume rather than intensity, pushing demand toward high-potency biopesticide formulations. Bacillus thuringiensis products that deliver 10 billion colony-forming units per gram help growers meet tonnage limits without sacrificing efficacy. Export-oriented farmers in Shandong and Zhejiang face parallel pressure from European Union residue limits tightened for 47 synthetic actives in 2024, further locking in biological demand. Fast-track review now grants provisional clearance within 18 months for formulations demonstrating 30% lower active-ingredient mass per hectare, incentivizing manufacturers to redesign legacy strains for higher spore counts.
Rising Organic-Food Premium Demand
Organic food sales are climbing annually, with Beijing, Shanghai, Guangzhou, and Shenzhen occupying a major share. Retail premiums range from 50-100% over conventional produce, offsetting the higher per-kilogram cost of biological inputs. Grocery chains such as Hema Fresh expanded organic displays by 30% and signed multi-year supply contracts that require biopesticide-only protocols. Extra price realization has driven tea and specialty-vegetable growers to switch product programs within a single season, lifting biopesticide demand in Fujian and Zhejiang.
Drone-Enabled Precision Spraying
More than 2.3 million agricultural drones treated 124 million hectares in 2024, cutting spray volumes by up to 50% through precision droplet placement[2]Source: Ministry of Agriculture and Rural Affairs, “Drone Application Statistics 2024,” moa.gov.cn . Provinces such as Hunan reported 60% penetration on rice acreage owing to cooperative-owned fleets that charge USD 1.40-2.10 per mu, undercutting hand labor by 40%. Institute for the Control of Agrochemicals approvals now cover Bacillus thuringiensis and Trichoderma harzianum suspensions formulated for ultra-low-volume drone delivery at 500-800 milliliters per mu. In Xinjiang’s cotton belt, drone coverage hits 65%, delivering 85% pest-control efficacy while meeting European Union phytosanitary residue rules. Reduced labor cost, minimized drift, and digital spray logs together embed drones as critical enablers of biological adoption.
Restraints Impact Analysis*
| Restraint | (~) % Impact on CAGR Forecast | Geographic Relevance | Impact Timeline |
|---|---|---|---|
| Variable field efficacy of live microbes | −1.4% | National, acute in Guangdong, Guangxi, and Hainan | Short term (≤ 2 years) |
| Higher upfront cost for smallholders | −0.9% | Farms below 0.33 hectares nationwide | Medium term (2-4 years) |
| Lengthy registration for novel strains | −0.6% | National, affects innovators | Long term (≥ 4 years) |
| Limited agronomic extension services | −0.5% | Inland provinces Guizhou, Gansu, and Qinghai | Medium term (2-4 years) |
| Source: Mordor Intelligence | |||
Variable Field Efficacy of Live Microbes
Colony-forming-unit viability in Bacillus thuringiensis and Trichoderma harzianum products can fall 40-60% when temperatures surpass 35 °C and humidity exceeds 80% in southern provinces, forcing spray intervals of seven to ten days. Ultraviolet light halves spore counts within two days, demanding dawn or dusk applications that clash with drone-service schedules. Guangdong Academy of Agricultural Sciences measured lower pest-mortality when biopesticides were sprayed at noon versus dawn. Manufacturers have introduced UV-shield adjuvants and thermotolerant strains, yet price premiums of 15-20% deter price-sensitive growers. Absence of standardized efficacy labels leaves farmers comparing brands via word-of-mouth, hampering confidence when pest pressure spikes.
Higher Upfront Cost for Smallholders
Retail prices averaged CNY 180-220 (USD 25.20-30.80) per kilogram for Bacillus thuringiensis in 2025, holding a 10-15% premium to generic synthetics. Farms smaller than 5 mu miss subsidy thresholds that start at 50 mu and thus pay full retail plus village-dealer markups of 20-30%. Average plant-protection budgets hover at CNY 450 (USD 63.00) per mu, leaving scant headroom for higher-priced biologicals. Credit access is tight because rural banks label biopesticides as high-risk with unclear payback periods. Pilot programs in Zhejiang reimbursed 30% of costs but required digital records many older farmers cannot supply, limiting adoption to 12% of eligible holdings.
*Our forecasts treat driver/restraint impacts as directional, not additive. The impact forecasts reflect baseline growth, mix effects, and variable interactions.
Segment Analysis
By Form: Biofungicides Anchor Demand While Bioinsecticides Accelerate
Biofungicides captured 40% of 2025 revenue, driven by Bacillus subtilis and Trichoderma harzianum products effective against Fusarium, Pythium, and Rhizoctonia in 5.8 million hectares of protected horticulture. Greenhouse operators value residue-free protection that secures 50-100% retail premiums and meets organic-label rules. Trichoderma lines from Koppert and Shandong Sukahan reach 85% control efficacy, on par with synthetics and thus maintain share leadership. Bioinsecticides, dominated by Bacillus thuringiensis, are rising at 12% CAGR on cotton and vegetable acreage where pyrethroid resistance erodes chemical efficacy. Bioherbicides remain at fewer share due to 40-55% weed-control levels versus glyphosate’s 85-95%, though Institute for the Control of Agrochemicals approvals for fatty-acid and allelopathic products signal future upside[3]Source: Institute for the Control of Agrochemicals, “Bioherbicide Approvals 2024,” icama.org.cn . Chengdu Newsun’s nano-encapsulated prototypes aim to close the efficacy gap by 2027, which could lift the China biopesticides market size for herbicidal categories.
Second-order demand factors reinforce the leadership of biofungicides. Protected-cultivation acreage increases disease pressure yet offers spray-timing control that maximizes live-microbe performance. Suppliers bundle sachet formulations that colonize root zones for season-long suppression, reducing frequency concerns tied to foliar routes. Meanwhile, bioinsecticide growth will hinge on drone-service density and resistance-management mandates in Xinjiang cotton. Should baculovirus platforms under development by Jiangsu Ruifeng secure approvals, competitive intensity in the bioinsecticide niche will climb, pushing producers toward differentiated carrier and encapsulation technologies.



By Crop Type: Row Crops Remain Bulk Consumers, Cash Crops Propel Value Growth
Row crops absorbed 42% of share in 2025, with rice fields in Hunan, Jiangxi, and Heilongjiang at the forefront due to provincial rules mandating 30% biological use on certified green-food acreage. Trichoderma seed treatments in wheat mitigate Fusarium head blight losses that reached USD 1.15 billion in 2023. Maize adoption trails because pest pressure is lower and synthetic alternatives remain cheap. However, export producers shipping non-GMO grain to Japan must pivot to biologicals for residue compliance.
Cash crops will pace the China biopesticides market with an 11% CAGR through 2031. Cotton in Xinjiang shifted 22% of acreage to bioinsecticide protocols to meet European and United States residue caps. Tea plantations in Zhejiang and Fujian stand at 38% organic status, chasing high premiums in Japanese and European markets where Maximum Residue Limits for 47 actives tightened in 2024. Tobacco contracts stipulate sub-0.5 ppm synthetic residue, leaving biopesticides as the only viable option. Vegetable greenhouses contribute significant share as operators pursue residue-free certification that unlocks tier-1 retail channels. These dynamics underscore how specialty-crop profitability, coupled with export standards, drives disproportionate value capture even as row crops remain the tonnage backbone.
Geography Analysis
Coastal provinces dominate adoption due to richer extension networks, higher subsidies, and export-oriented supply chains. Shandong commanded a major share of 2025 market value on the strength of protected-vegetable acreage and local supply chains that shave 20% off logistics costs. Zhejiang and Jiangsu contributed another significant share, leveraging 20% reimbursement subsidies and concentrated manufacturing bases.
Southern provinces Guangdong, Guangxi, and Hainan together held the next major share, constrained by 40-60% viability losses during humid summers that necessitate costly repeat sprays. Xinjiang accounted for 9% owing to drone-driven cotton adoption that integrates Bacillus thuringiensis suspensions at ultra-low volume.
Inland adoption lags because farms average 0.4-0.6 hectares and seldom meet subsidy thresholds. Ministry-led mobile extension programs in 50 counties boosted usage 28% during the first pilot season, hinting that knowledge transfer can offset infrastructure gaps. Heilongjiang, the largest rice producer, increased its share after mandating biopesticide use on 30% of green-food acreage and deploying cooperative drone fleets that cut application cost 40%. Overall, policy carrots and sticks explain the east-west adoption split more than climate alone.
Regulatory Landscape
China’s biopesticides are governed under the national pesticide framework administered by the Ministry of Agriculture and Rural Affairs (MARA) and implemented through the Institute for the Control of Agrochemicals (ICAMA), with registration, labeling, and post-market supervision set within the pesticide administration regulations and associated registration measures. A key change is MARA Order No. 3 (2025), which revised the Measures for the Administration of Pesticide Registration and took effect on January 1, 2026, tightening compliance expectations across the supply chain. This includes requirements for online pesticide sales platforms to register with the licensing authority within 20 days of commencing operations and clarifies data protection periods for new registrations.
Quality and consistency controls are being strengthened through updated national standards for biological actives and technical materials. New GB/T standards covering Bacillus thuringiensis and fungal pesticide technical concentrates were published in October 2025 and implemented on May 1, 2026, raising requirements for specification and testing consistency that manufacturers and importers need for registration maintenance and ongoing supply. MARA’s Department of Crop Management also issued a March 2026 public consultation on registration data requirements for RNA pesticides, outlining a pathway for next-generation biological modalities while adding additional data and compliance work for innovators.
Value Chain Analysis
The China biopesticides value chain typically starts with strain discovery and formulation R&D, often supported through joint work with domestic research institutes. It then progresses to pilot-scale fermentation and scale manufacturing in agrochemical and biotech clusters, followed by product registration and commercialization through ICAMA-led approvals under MARA’s national framework. Manufacturers generally build portfolios around microbial and biological actives, with the largest players emphasizing cost-down fermentation and formulation stability to manage viability losses in hot and humid provinces. Compliance remains a gating step throughout the chain, covering toxicology and efficacy dossiers, alignment with national and sector standards, and label claims that are increasingly scrutinized as biologicals move beyond niche programs.
Commercialization relies on provincial distribution networks, agricultural extension channels, and cooperative service models, with drone service providers and digital spray logs supporting in-field execution for ultra-low-volume applications. Coastal production and distribution advantages remain visible due to logistics depth and export-oriented supply chains, while inland adoption is more closely tied to extension reach and subsidy access. Adoption also depends on partnerships, including CABI and MARA’s Joint Laboratory for Biosafety supporting technology transfer and IPM capability building, alongside company-linked institute trials that help localize field guidance and build confidence in performance under variable conditions.
Competitive Landscape
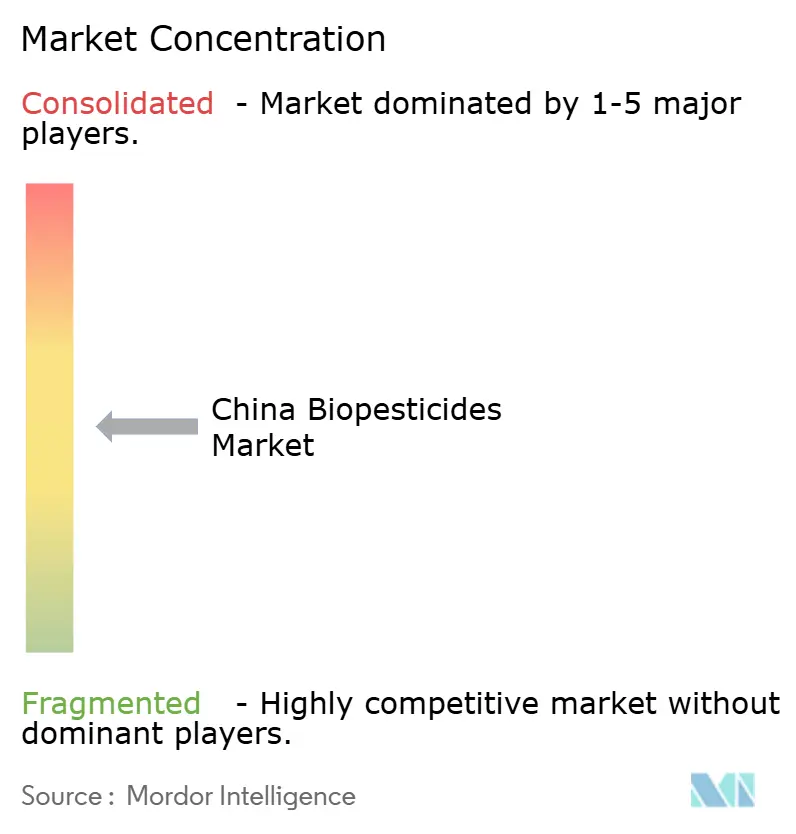
The top five players held a significant share in 2025, resulting in a market concentration score that indicates moderate fragmentation. Valent Biosciences LLC, Andermatt Group AG, and Koppert Biological Systems Inc leverage their decades-long safety records and multi-province agronomic alliances to secure government bids. Domestic producers Henan Jiyuan Baiyun Industry Co. Ltd., King Biotec Corporation, and Shandong Sukahan Bio-Technology Co. Ltd compete on the basis of scale economies and quicker adjustments to registered strains.
White-space activity centers on enzymatic and baculovirus lines as Hebei Zhongbao Green Crop Technology Co. Ltd., Jiangsu Ruifeng Bio-Tech Co. Ltd., and Chengdu Newsun Crop Science Co. Ltd file patents that bypass live-microbe constraints. Technology investment is the new battleground. Shandong Sukahan Bio-Technology Co. Ltd’s thermotolerant Bacillus subtilis holds viability at 38 °C, earning 12% share in Guangdong’s vegetable segment within a year. Zhejiang Qianjiang Biochemical Co. Ltd’s 18 patents on gibberellic-acid herbicides position it for an early mover advantage in rice systems.
Smaller firms, such as Wuhan Kono Biological Technology Co. Ltd and Rainbow Agro Co. Ltd, partner with universities for localized trials that inform extension advisories, thereby bridging the trust gap with growers. Rising export volumes add urgency for Good Manufacturing Practice certifications and traceability audits, favoring players with mature quality systems.
China Biopesticides Industry Leaders
Valent Biosciences LLC
Andermatt Group AG
Dora Agri-Tech
Biolchim SPA
Koppert Biological Systems Inc.
- *Disclaimer: Major Players sorted in no particular order

Recent Industry Developments
- April 2026: Sumitomo Chemical commenced operations of the Sumitomo Biorational Company, integrating Valent BioSciences, MGK, and Valent North America into a single global center for biorational innovation. The consolidation streamlines R&D and commercialization for biorational portfolios and shapes how microbial and botanical solutions are developed and prioritized for international markets that include China’s biopesticide ecosystem.
- October 2025: The Ministry of Agriculture and Rural Affairs (MARA) approved five biopesticides under its green farming initiative, focusing on lower-solvent, water-based formulations such as water-dispersible granules, emulsifiable concentrates, and suspension concentrates. The approvals expand the range of compliant product options and reinforce a regulatory preference for formulations positioned as lower environmental impact in mainstream crop protection programs.
- May 2024: The Ministry of Agriculture and Rural Affairs earmarked funding for integrated pest management programs that reimburse growers up to 20% of biological input costs. By tying disbursement to documented reductions in synthetic active ingredient use, the program places biopesticides into compliance-related toolkits and program eligibility within participating provinces and cooperatives.


Research Methodology Framework and Report Scope
Market Definition and Coverage
For this study, the China biopesticides market is defined as the value of biologically derived crop protection products sold for controlling pests, diseases, and weeds in Chinese agriculture, across on-farm and nearby commercial channels.
Scope exclusions: Excluded from scope are synthetic chemical pesticides, fertilizers and biostimulants without a plant protection claim, and crop seed treatment services that are billed as a separate service.
Segmentation Overview
- By Form
- Biofungicides
- Bioherbicides
- Bioinsecticides
- Other Biopesticides
- By Crop Type
- Cash Crops
- Horticultural Crops
- Row Crops
Data Sources, Market Sizing, and Validation
Desk Research
Desk work started with a view of China crop protection demand, then it was narrowed to biological active ingredients and formulations used in pest management. We referenced public sources such as FAOSTAT, UN Comtrade, the National Bureau of Statistics of China, the Ministry of Agriculture and Rural Affairs of China, and customs and tariff schedules to understand crop acreage, trade flows, and policy direction.
Next, we reviewed product registration and label-level context from official regulator communications, along with peer-reviewed agronomy and plant protection journals, to see where efficacy and adoption are strongest. Company filings, investor presentations, association websites, and credible agricultural press were also used to confirm the channel structure and typical price bands in China.
In a few steps, paid subscriptions for company financials and intelligence, patent databases, and shipment-level trade data were used to fill gaps where public reporting was not detailed enough. These desk sources are illustrative, and many other references were also used for data collection, validation, and clarification.
Primary Interviews and Surveys
Primary work focused on validating demand signals and price realization across key crops, and then checking where biological solutions are being substituted within conventional pest-control programs. We spoke with growers, agronomists, distributors, and product and regulatory professionals to test adoption patterns, seasonal usage timing, and formulation preferences across major producing provinces and trade corridors within China.
Distribution of primary research fieldwork respondents
| Company type | Respondent position |
|---|---|
| Top tier: 31% | CXOs: 15% |
| Mid tier: 50% | Functional/Unit leaders: 33% |
| Smaller Players: 19% | Managers: 52% |
Market-Sizing & Forecasting
Sizing was built using a top-down structure where crop area and crop protection intensity were converted into a biological demand pool through penetration rates by crop and target pest group, and then translated into value using typical dose rates and average selling prices. To keep the totals realistic, we cross-checked outputs with selective bottom-up approximations, such as sampled ASP by formulation multiplied by estimated treated hectares, plus distributor channel checks in high-consumption provinces.
Key inputs in the model included harvested area for key crop groups, shifts toward residue-sensitive supply chains, registration and renewal pace for biological actives, seasonal pest pressure patterns, and changes in application practices such as wider drone spraying coverage. When gaps showed up, especially for smaller local supply, we used conservative ranges from interviews, then adjusted using observable signals like trade movements for relevant inputs and reported production capacity narratives.
Forecasts were produced using scenario analysis supported by expert views, since policy enforcement, registration timing, and weather-driven pest pressure can move adoption faster or slower year to year. In each scenario, penetration and pricing were stepped forward with practical constraints, and then re-checked against implied spending per hectare so the final series stayed explainable for client discussions.
Data Validation & Update Cycle
Validation was done through multiple checks so the final numbers did not rely on a single assumption. We compared market totals against independent signals such as implied spend per treated hectare, crop area trends, and observed pricing movement, and we reviewed any sharp spikes that did not match field feedback.
Before sign-off, the model was reviewed in steps, where assumptions, unit conversions, and year-to-year growth drivers were checked by another analyst, followed by a final consistency pass across tables and charts. If a major variance appeared, respondents were re-contacted to confirm whether it reflected a real shift, a short-term channel stock effect, or a data timing issue. Reports are refreshed annually, with interim updates when material events occur, and a final pre-delivery review is done so the client receives the latest view.
Mordor Intelligence's China Biopesticides Market Market Size Compared Against Other Published Estimates
Published market sizes for China biopesticides often differ because the product scope, pricing basis, and time period are not always aligned across studies, even when the titles look similar. The gap also reflects how firms translate treated hectares into value, particularly when channel stocking and promotional pricing are common.
Seed-treatment services sold as a bundled application are kept outside Mordor Intelligence's scope, which shifts some estimates downward compared with sources that count service revenue alongside product value. Other gaps typically come from mixing biological crop protection with broader agricultural biologicals, using aggressive adoption scenarios tied to policy headlines, or applying spot exchange rates and unverified ASP escalation without checking against per-hectare affordability.
Benchmark comparison
| Source | Market Size | Gaps in Research Methodology |
|---|---|---|
| Mordor Intelligence | USD 322.15 B (2025) | |
| Regional Consultancy A | USD 296.78 M (2024) | Uses a different base year and appears to use a narrower definition with mixed segment coverage, which can understate value when crop-level penetration is not rebuilt from treated area and dose-rate logic. |
| Trade Journal B | USD 1.36 B (2025) | Older forecast set with a high growth rate and earlier base year, and pricing seems to be extended forward with broad assumptions that may not reflect current registration pace and on-ground price realization. |
Looking at the three figures together, the spread is mainly explained by scope boundaries, base year timing, and how adoption and pricing are converted into a repeatable spending model. By keeping the calculations tied to treated hectares, practical penetration ranges, and consistent price logic, the estimate stays traceable and easier to audit when new field signals emerge.


Key Questions Answered in the Report
How large is the China biopesticides market in 2026 and what is its projected value in 2031?
It reached USD 354.73 million in 2026 and is forecast to climb to USD 576.44 million by 2031 on an 10.20% CAGR.
Which product form leads China's biopesticide sales?
Biofungicides lead with 40% revenue share in 2025 due to strong demand in protected horticulture.
What factors drive the fastest growth segment within forms?
Bioinsecticides expand at 12% CAGR through 2031 due to Bacillus thuringiensis adoption in cotton and vegetable crops where resistance limits synthetics.
Why are cash crops important for future growth?
Cash crops such as cotton, tea, and tobacco will log an 11% CAGR between 2026 and 2031 because export residue rules and organic premiums favor biological inputs.
How do government subsidies influence adoption?
Subsidies reimbursing up to 20% of bio-input costs are tied to documented reductions in chemical use, effectively mandating biopesticide uptake.
Which regions are adopting biopesticides most rapidly?
Shandong, Zhejiang, and Jiangsu provinces outpace others due to higher subsidies, dense extension networks, and proximity to export supply chains.
Page last updated on:





