Cargo Inspection Market Size and Share
Market Overview
| Study Period | 2020 - 2031 |
|---|---|
| Market Size (2026) | USD 2.9 Billion |
| Market Size (2031) | USD 3.70 Billion |
| Growth Rate (2026 - 2031) | 4.48% CAGR |
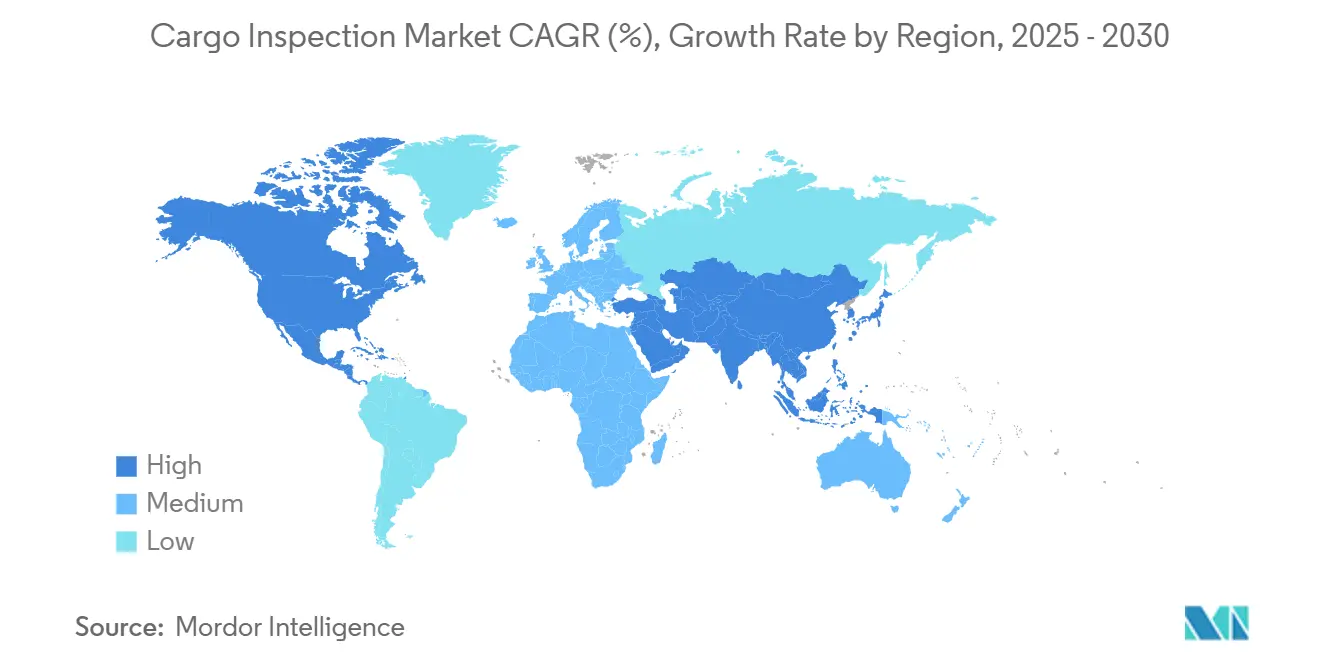
| Fastest Growing Market | Asia Pacific |
| Largest Market | Asia Pacific |
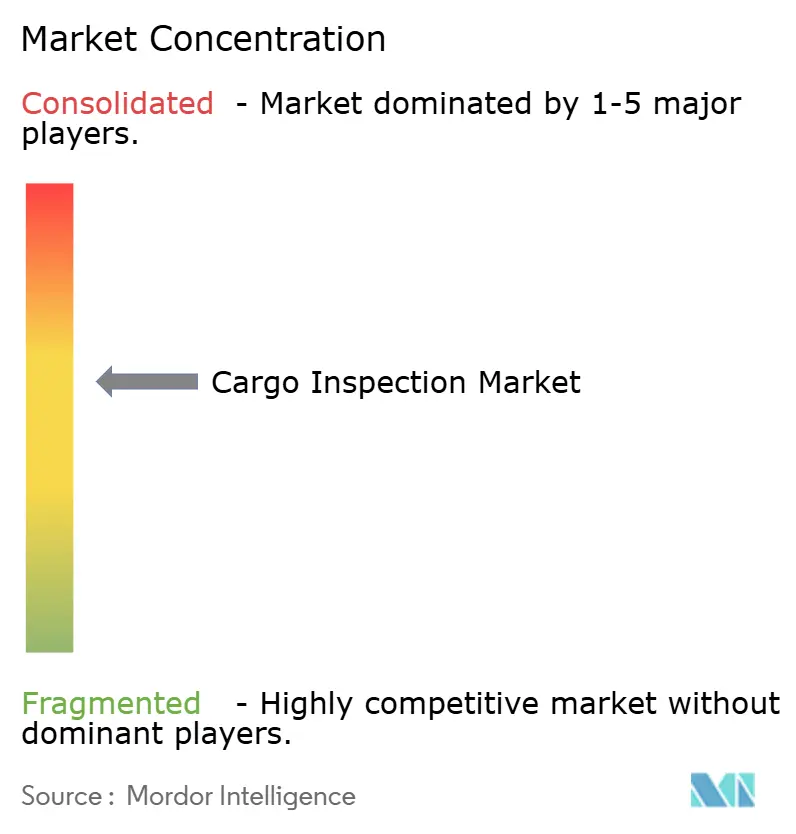
| Market Concentration | Medium |
Major Players *Disclaimer: Major Players sorted in no particular order Image © Mordor Intelligence. Reuse requires attribution under CC BY 4.0. | |
Cargo Inspection Market Analysis by Mordor Intelligence
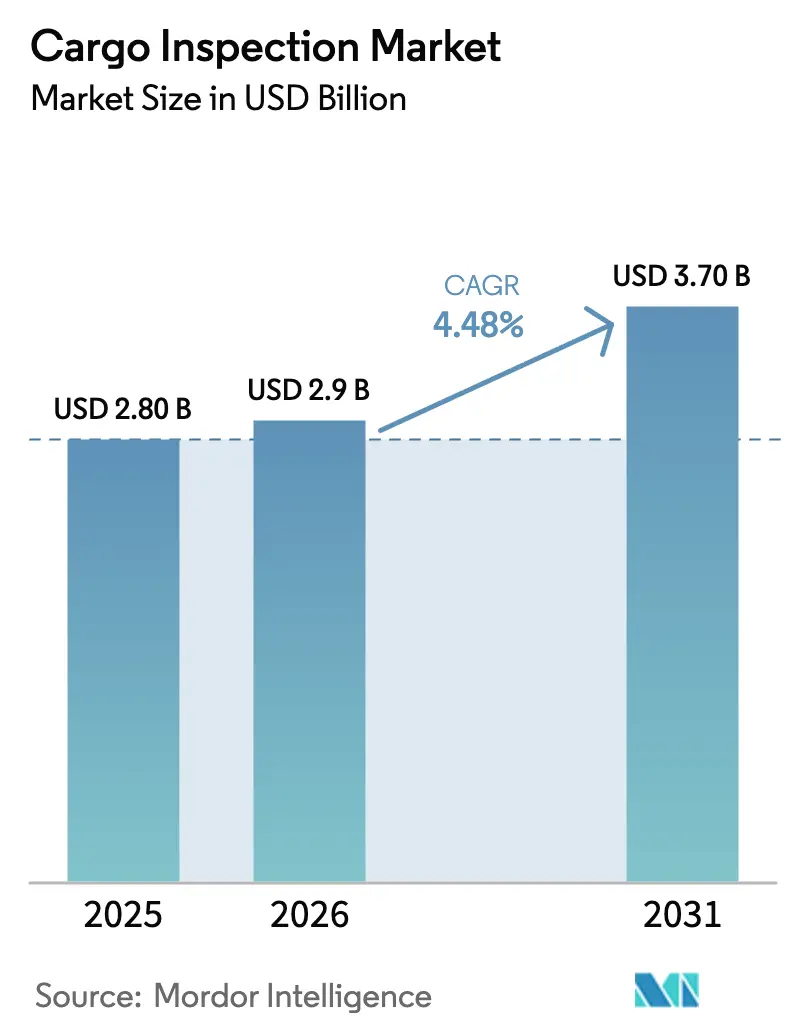
The Cargo Inspection Market size is projected to be USD 2.80 billion in 2025, USD 2.9 billion in 2026, and reach USD 3.70 billion by 2031, growing at a CAGR of 4.48% from 2026 to 2031.
Regulatory tightening is a clear growth catalyst as customs programs formalize requirements for ethical conduct, AEO coverage for smaller traders, and earlier risk interventions in the supply chain. Operational modernization is underway within major inspection providers, with digital workflows and remote operations allowing faster turnarounds and better transparency for public-sector contracts. Port expansions in the Middle East and South Asia elevate throughput expectations and increase touchpoints for quality, quantity, and safety checks. Rising parcelization from cross-border e-commerce pushes customs to strengthen data quality, small-parcel screening, and non-intrusive inspection deployment. Execution gaps remain as scanning targets and digitalization milestones run into capital constraints, site readiness issues, and staffing shortfalls, which sustain demand for third-party inspection and risk analytics services.
Key Report Takeaways
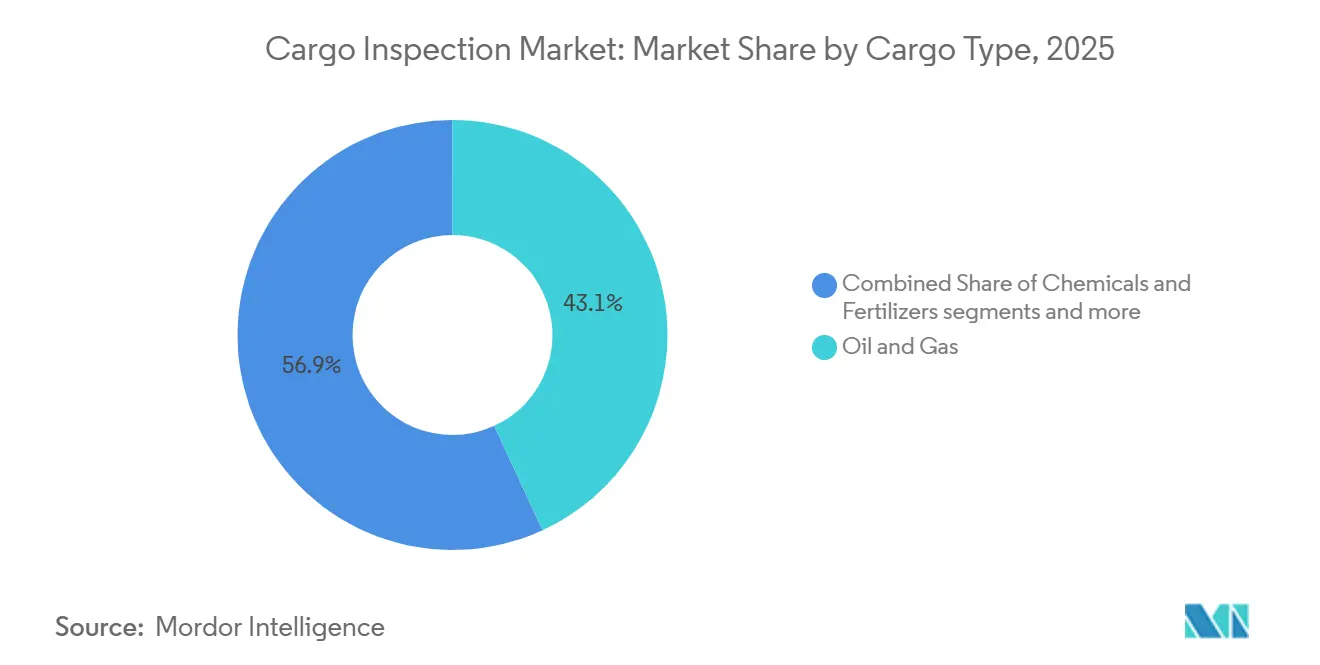
- By cargo type, oil and gas led with 43.13% of the Cargo Inspection Market share in 2025, while chemicals and fertilizers are projected to expand at a 7.43% CAGR through 2031.
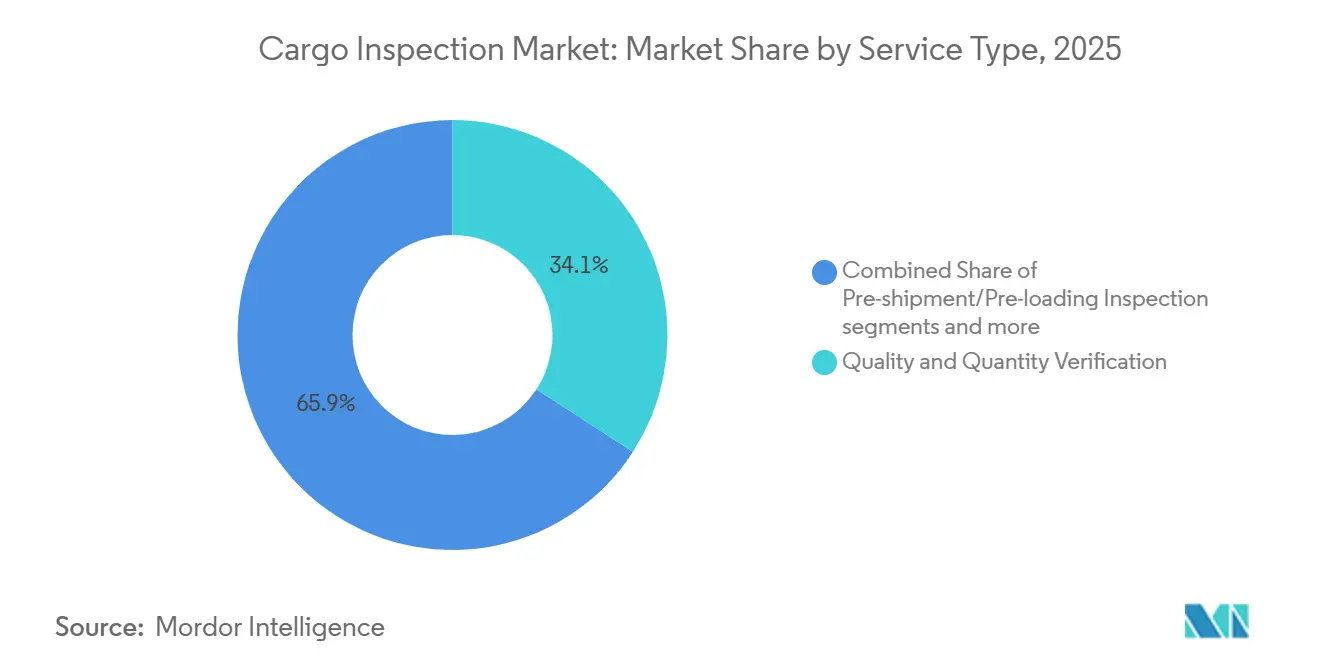
- By service type, quality and quantity verification accounted for 34.14% share in 2025, while pre-shipment and pre-loading inspection is forecast to grow at 6.78% annually through 2031.
- By geography, Asia-Pacific captured 30.76% of the Cargo Inspection Market size in 2025 and is expected to post the fastest regional CAGR at 7.81% through 2031.
Note: Market size and forecast figures in this report are generated using Mordor Intelligence’s proprietary estimation framework, updated with the latest available data and insights as of January 2026.
Global Cargo Inspection Market Trends and Insights
Drivers Impact Analysis*
| Drivers | (~) % Impact on CAGR Forecast | Geographic Relevance | Impact Timeline |
|---|---|---|---|
| Stringent Regulatory Requirements and Customs Compliance | +1.2% | Global, with concentration in North America, the EU, and the Asia-Pacific | Medium term (2–4 years) |
| Technological Advancements in Non-Intrusive Inspection (NII) Systems | +1.0% | North America, EU, Asia-Pacific | Medium term (2–4 years) |
| Infrastructure Development in Emerging Markets | +0.9% | Asia-Pacific, the Middle East, and Africa | Medium term (2–4 years) |
| Increasing Global Trade Volumes and Cross-Border Commerce | +0.8% | Global, with East Asia, Africa, and South America | Short term (≤ 2 years) |
| E-commerce Boom and Small Parcel Inspection Demands | +0.7% | Global, especially the EU, North America, and the Asia-Pacific | Short term (≤ 2 years) |
| Rising Security Threats and Contraband Smuggling Concerns | +0.6% | Global, early gains in Southeast Asia, the Middle East, and Africa | Long term (≥ 4 years) |
| Source: Mordor Intelligence | |||
Stringent Regulatory Requirements and Customs Compliance
The World Customs Organization’s 2025 SAFE Framework update widened AEO eligibility to micro, small, and medium-sized enterprises and introduced mandatory ethics codes, anchoring stronger governance for certified traders and greater vigilance against insider threats[1]World Customs Organization, “WCO Publishes Its New SAFE Framework of Standards,” Freight News, freightnews.co.za. U.S. policy momentum points to much higher scan rates at land borders, although fiscal year 2024 performance lagged with 8% scanning of passenger vehicles and 27% for commercial vehicles, which keeps the door open for expanded third-party inspection support and technology rollouts. The U.S. plan to deploy 38 additional non-intrusive inspection systems in fiscal year 2026 targets stronger coverage on the southwest border, with interim targets of 40% for privately owned vehicles and 70% for commercial trucks that will raise inspection workloads. Europe’s customs reform removes the EUR 150 duty exemption and places more responsibility on e-commerce platforms, while audits show a high share of undervaluation and non-compliance within low-value consignments, signaling a larger role for upstream verification and data-quality assurance. Tightening across regions increases the value of certified inspection partnerships, automated documentation, and pre-loading verification, especially for categories with higher fraud or safety risks. Accreditation ecosystems, such as ISO and national accreditation bodies, shape how inspection protocols are validated and recognized across jurisdictions, with a shift toward real-time data exchange.
Technological Advancements in Non-Intrusive Inspection Systems
Customs modernization programs highlight AI, IoT, and machine learning as core tools that improve image analytics, risk scoring, and cargo tracking, which lifts detection rates without slowing clearance of compliant shipments. Country cases supported by the WCO showcase deployments of AI-driven risk management and scanner interoperability, while similar efforts along the U.S. southwest border focus on training algorithms to flag anomalies for officer review. Procurement momentum continues as governments invest in high-energy mobile cargo inspection systems and complementary screening units for ports and border crossings, strengthening mobile coverage where construction or site constraints limit fixed installations. These projects require careful calibration and site integration to avoid interference with other detection assets, which has driven cost overruns and schedule slips in complex, high-traffic environments. Adoption remains uneven across customs administrations due to budget limits, construction lead times, and systems engineering demands, which creates a bifurcated landscape of AI-augmented inspection services and legacy X-ray equipment. Interoperability with evolving technical standards, including those issued by international or regional bodies, increases in importance as authorities coordinate data flows and align operating procedures.
Infrastructure Development in Emerging Markets
India’s Sagarmala Programme completed 272 projects by March 2025, adding more than 400 million tonnes per annum of port capacity and cutting average vessel turnaround time to 49.47 hours, which increases inspection volumes and raises expectations for synchronized gate, yard, and berth operations. Saudi Arabia’s DP World terminal expansion in Jeddah doubled capacity to 4 million TEUs and introduced a large-scale reefer inspection facility, which improves handling for perishables while demanding standardized and high-throughput inspection practices. Jebel Ali’s electrified vehicle fleets and other yard automation steps strengthen sustainability goals and free up operational budgets that can be redeployed into digital inspection capabilities. Electric freight operations with AI orchestration signal a broad shift to data-rich environments where inspection scheduling, exception handling, and reporting move inside platform workflows. These developments can amplify load concentration at mega-hubs, which increases the operational impact of any disruption and makes pre-positioned inspection resources and multi-year terminal access agreements more valuable. Inspection providers that match these builds with fast-lane verification models and remote oversight can help terminal operators maintain dwell time targets as throughput scales.
Increasing Global Trade Volumes and Cross-Border Commerce
Customs agencies are aligning capacity with higher cargo flows and more complex supply chains, which increases reliance on scalable inspection models and digitally enabled risk screening. India’s maritime program added new port handling capacity and reduced average vessel turnaround time to 49.47 hours by March 2025, showing how infrastructure improvements feed directly into higher inspection volumes that demand efficient workflows and calibrated staffing rosters. These upgrades reduce bottlenecks but also concentrate cargo at large hubs, which heightens the need for coordinated inspection windows and standardized documentation. The expansion of container terminals and better hinterland links intensifies scrutiny at fewer, higher-capacity nodes, which puts a premium on throughput-ready non-intrusive inspection and reliable sampling plans. Inspection providers that combine local presence with cross-border laboratory networks are positioned to absorb peak surges without weakening sampling rigor or compromising traceability records. Better connectivity and integrated port systems support early risk triage and verification scheduling, creating operational room for targeted interventions and dispute avoidance.
Restraints Impact Analysis*
| Restraint | (~) % Impact on CAGR Forecast | Geographic Relevance | Impact Timeline |
|---|---|---|---|
| High Capital Investment and Implementation Costs | -0.5% | Global, pronounced in North America and emerging markets | Short term (≤ 2 years) |
| Operational Complexity and Technical Expertise Requirements | -0.4% | Global, especially Southeast Asia and Africa | Medium term (2-4 years) |
| Maintenance Challenges and Lifecycle Costs | -0.3% | Global, the highest where port density is greatest | Long term (≥ 4 years) |
| Privacy Concerns and Data Security Issues | -0.2% | EU, North America, China | Medium term (2-4 years) |
| Source: Mordor Intelligence | |||
High Capital Investment and Implementation Costs
Large-scale non-intrusive inspection installations face construction, space, and systems-integration hurdles that extend schedules and increase costs, which slow scan-rate improvements against statutory targets. U.S. deployments illustrate these realities, with fiscal year 2024 scan rates reaching only 8% for passenger vehicles and 27% for commercial vehicles as site constraints and interference with other systems delayed progress[2]U.S. Government Accountability Office, “Border Security: Improvements Needed to Increase Vehicle Scanning at Land Ports of Entry,” U.S. Government Accountability Office, gao.gov. At ports, terminal expansions that integrate automation, electrification, and deep-water berths require significant capital, which intensifies pressure on operators to recover costs through higher throughput and operational efficiencies. New maritime safety rules add survey and certification requirements that drive recurring compliance spending for shipowners, expanding demand for inspection and verification but also elevating lifecycle costs across fleets. Emerging markets often turn to phased procurement or PPP structures to spread out investment, which can defer full capability while complicating vendor management and performance oversight. Inspection providers that offer flexible commercial models and modular deployments are better placed to align with constrained budgets and evolving site-readiness conditions.
Operational Complexity and Technical Expertise Requirements
Many customs agencies still rely on manual profiling of bills of lading and incomplete data integration, which slows risk targeting and weakens accuracy for anomaly detection. Staff rotations can erode institutional knowledge and reduce continuity across container control and air cargo units, which affects program effectiveness during transitions. U.S. oversight bodies have highlighted planning issues in non-intrusive inspection technology programs, including site engineering and coordination challenges that complicate deployment and degrade performance in constrained facilities. Technical capacity gaps in image interpretation, threshold calibration, and systems integration can make agencies dependent on vendor expertise for longer than planned, which raises lifecycle costs and slows modernization. Countries that combine digitization of port processes with streamlined cargo handling procedures see measurable gains in dwell and turnaround times, which require sustained training and governance support for smaller administrations to replicate. Training ecosystems and accreditation frameworks matter because they set a baseline for competence recognition, data governance practice, and audit readiness across borders.
*Our forecasts treat driver/restraint impacts as directional, not additive. The impact forecasts reflect baseline growth, mix effects, and variable interactions.
Segment Analysis
By Cargo Type: Chemicals and Fertilizers Growth Outpaces Oil and Gas Dominance
Oil and gas held 43.13% of the cargo inspection market share in 2025, reflecting a long-standing reliance on quality and quantity certification for bulk hydrocarbon shipments, while chemicals and fertilizers are projected to post the fastest growth at 7.43% through 2031 as purity standards and traceability mandates tighten. Demand for biofuel, marine fuel, and sustainable aviation fuel testing is rising in step with refinery and blending activity, and suppliers are expanding analytical capacity to address new feedstocks and lower-carbon product specifications. The International Fertilizer Association’s Product Stewardship framework broadened scope across the product lifecycle, which deepens the inspection footprint from production to storage and distribution, and third-party audits continue to benchmark facilities against high-performance thresholds. Metals and minerals inspection remains a steady line of business as copper and gold activity supports laboratory services and onsite testing, with targeted acquisitions used to add geochemical depth and local reach. Agriculture commodities inspection benefits from grain quality standards, defined procedures, and fee structures that sustain verification demand even when shipment volumes vary by season. Consumer goods inspection is being shaped by new e-filing requirements and stronger data exchange rules, which push more compliance steps upstream and reinforce demand for pre-loading verification and documentation integrity.
From 2019-2025, oil and gas dominated the cargo inspection market, but the chemicals and fertilizers segment accelerated as sustainability expectations, stewardship standards, and lifecycle documentation needs expanded. The cargo inspection industry is responding with bundled offerings that combine testing, certification, and remote audits to manage cost and timing pressures while preserving assurance levels expected by lenders and buyers. Upstream services in metals and minerals maintained momentum through mining capital spending cycles and exploration activity, which reinforced demand for geochemical analysis and onsite labs. In agriculture, standardized inspection rates and consistent quality criteria helped stabilize service demand even as exporters adapted to route adjustments and weather variations. For consumer goods, digital certificate filing and platform-based data exchange are reshaping the points at which inspection, verification, and documentation happen, driving earlier interventions to avoid border delays. Incumbents are defending margins with digital workflow tools and acquisition-led expansions that add laboratory scale in growth corridors and build resilience into global networks.


By Service Type: Pre-shipment Inspection Gains Ground on Quality Verification Leadership
Quality and quantity verification accounted for 34.14% of services in 2025, consistent with buyer and seller needs to reconcile grade, purity, and volume, while pre-shipment and pre-loading inspection is set to grow at 6.78% annually through 2031 as counterparties push scrutiny upstream to prevent disputes and shorten dwell at destination. Government procurement supports this shift, such as vessel loading and unloading observation for food-aid cargo, which embeds independent oversight into critical supply programs and sets clear reporting and documentation practices. Industry initiatives have introduced tiered quality-control certification anchored in data-driven milestone tracking and continuous improvement, which integrates naturally with smart-data platforms that centralize performance evidence. Weight and draft surveys maintain steady importance for bulk and breakbulk shipments, with standardized protocols and tested software helping reduce measurement variance and defend contractual adherence. Bunker quantity and fuel quality survey work is reinforced by updated maritime environmental rules that require representative sampling and defined verification procedures. Load and discharge supervision continues to benefit from digitalized workflows that enable remote participation and faster documentation, which saves time while improving transparency for public and private clients.
From 2019-2025, buyers often resisted pre-shipment inspection due to added fees, but contracting and financing practices are changing to tie early-stage certification to payment release or logistics milestones. As a result, the cargo inspection market is seeing pre-shipment verification adopted as a preventive strategy, which reduces rework and settlement disputes and realigns costs toward earlier in the chain. Meanwhile, quality and quantity verification remain essential, and providers are differentiating with remote operations, digital certificates, and portal-based document management. Insurance and claims trends support expansion in damage and contamination inspection as underwriters demand stronger evidence gathering and clearer causality assessment. Public-sector awards in food aid and standards enforcement maintain volume in vessel observation, conformity assessment, and pre-export verification programs. Providers are extending software capabilities that support electronic filing, certificate lifecycle management, and alerts to help shippers adapt to fast-changing rules without operational churn[3]Federal Register, “2025/2026 Rates for Grain Inspection and Weighing Services,” Federal Register, federalregister.gov.
Geography Analysis
Asia-Pacific held 30.76% of the 2025 cargo inspection market share and is set to record the fastest regional growth at 7.81% through 2031, supported by terminal upgrades, customs digitization, and e-commerce parcel surges. India’s Sagarmala projects added handling capacity at scale and cut average vessel turnaround time to 49.47 hours, while ongoing connectivity works continue to align landside links with new terminal capacity. East of the Arabian Peninsula, the Jeddah terminal expansion more than doubled throughput and added a high-capacity reefer inspection facility, which improves perishable flow while raising service-level expectations for verification and documentation. Jebel Ali’s expansion of electric terminal vehicles and electric handlers shows a move toward lower emissions operations, and related efficiencies create scope for further digital investment. These projects concentrate cargo flows in large hubs, which elevates throughput planning needs for inspection teams and reinforces the value of structured access agreements at busy gateways. Region-wide, customs and port authorities are expanding technology use and training, which promotes interoperability between inspection systems and supply-chain data platforms.
North America is moving to lift scan coverage at land borders through additional non-intrusive inspection deployments in fiscal year 2026, which will generate more inspection events and associated service demand as systems come online. Oversight reviews have flagged construction challenges and space constraints at high-traffic crossings, which implies a staggered ramp as sites are readied and interference risks are managed. Federal procurement, such as vessel observation for food aid, shows continued use of third-party assurance to manage program quality and integrity. Within the private sector, consolidation and capability expansions are notable, including acquisitions focused on specialized testing, calibration, and forensics that complement inspection and verification work. Consumer product rules are adding e-filing requirements that will affect data and certificate workflows, raising the importance of software modules that tie together product compliance and customs entry. Together, these actions show a path to a more automated and data-anchored clearance environment that expands the role of inspection partners in planning and execution.
Europe is preparing for a phased customs reform that removes the EUR 150 de minimis threshold and shifts more responsibility to platforms, which will push more verification steps upstream and emphasize clean data capture. The central EU Customs Data Hub is positioned to centralize and harmonize submissions, which creates opportunities for inspection providers that can integrate test results, certificates, and supporting records into standardized formats. Maritime rules on lifting appliances and fuel-oil sampling update equipment certification and sampling requirements, which reinforce shipboard verification and lab support. Across Europe, AEO programs and national accreditation standards continue to set the stage for recognition of inspection protocols and lab competence. The success of EU reforms will depend on smooth integration with customs IT and e-commerce platforms, which could influence dwell time and inspection scheduling in the near term. Over the forecast, structural reforms and steady technology adoption support consistent demand for inspection across high-value goods and compliance-sensitive categories.

Competitive Landscape
The cargo inspection market shows moderate concentration as global incumbents leverage multi-service portfolios, laboratory networks, and public-sector credentials to anchor share, while regional specialists and niche technology providers win targeted programs with AI-driven anomaly detection, blockchain-verified certificates, or sector-specific expertise. Digitalization is now a competitive baseline, with major providers completing transitions that allow a meaningful share of operations to be conducted remotely, improving speed, documentation quality, and audit readiness. Select acquisitions add specialized testing and calibration capabilities that broaden the scope of contract coverage across industrial and consumer segments. Software-driven offerings are expanding, including electronic filing modules, certificate lifecycle management, and alerting features that reduce compliance friction. These platforms reinforce lock-in across shipper and forwarder workflows and help maintain margins in price-competitive bids.
Capacity expansion remains central to meeting regional demand spikes, with new laboratories and upgraded facilities positioned where mining, hydrocarbons, and consumer supply chains are expanding. Portfolio depth increases resilience against commodity cycles and route shifts, while local lab builds and acquisitions shorten turnaround time and improve responsiveness in remote locations. Public-private arrangements in port environments illustrate how operators are internalizing inspection-adjacent functions, including autonomous and electrified yard logistics that depend on integrated data platforms. As ports digitize workflows and automate documentation, inspection events can be scheduled and executed with fewer handoffs and with clearer evidence trails. Technology vendors that supply mobile high-energy scanning units complement fixed infrastructure, enabling flexible inspection coverage near capacity-challenged sites. Providers that combine equipment expertise with software and field services are better placed to win multi-year awards and frame synergies across customs modernization programs.
Pricing tiers and service-level stratification are becoming more pronounced as well-capitalized administrations deploy AI-enhanced inspection and analytics, while cost-constrained operators rely on legacy X-ray and manual sampling. That divergence complicates cross-border harmonization and reduces the fungibility of inspection credentials in multi-jurisdiction movements. Incumbents counter this risk by bundling inspection with compliance advisory and digital certificate management to defend share where bidding pressure is highest. Long-standing joint ventures and partnerships assure access in large markets but create exposure to geopolitical shifts and policy changes that can redirect trade lanes. Over the forecast, competitive differentiation will center on integrating physical inspection with scalable data platforms, improving anomaly detection, and aligning with evolving customs rules that reward early-stage verification. Providers that align software roadmaps with customs reforms and platform responsibilities will be best positioned to capture share as flows, standards, and scan coverage ratchet higher.
Cargo Inspection Industry Leaders
SGS SA
Bureau Veritas SA
Intertek Group plc
Cotecna Inspection SA
ALS Limited
- *Disclaimer: Major Players sorted in no particular order

Recent Industry Developments
- March 2026: India’s Ministry of Ports, Shipping and Waterways approved a ₹472 crore road overbridge project at Tuna-Tekra to enhance connectivity for a 2.19 million TEU container terminal and an 18.33 million MTPA multipurpose cargo berth, aligned with 45% physical completion.
- March 2026: SGS secured its seventh consecutive three-year contract from the Kenya Bureau of Standards for pre-export verification of conformity services covering 2026-2029, with inspection fees revised to 0.5-0.6% of declared FOB value and minimum-maximum fees of USD 300 to USD 3,500.
- February 2026: Bureau Veritas reported full-year 2025 results with digitalization of all government-services inspection workflows, enabling one-third of operations to be conducted remotely, improving efficiency and transparency.
- February 2026: SGS announced 2025 full-year results, recording organic growth of 5.6% and free cash flow of USD 841 million, reflecting robust performance in testing, inspection, and certification.


Global Cargo Inspection Market Report Scope
The Cargo Inspection Market Report is Segmented by Cargo Type (Oil & Gas, Metals & Minerals, and More), by Service Type (Quality & Quantity Verification, Weight & Draft Survey, Damage & Contamination Inspection, Pre-shipment/Pre-loading Inspection, Others), and by Geography (North America, South America, Asia-Pacific, Europe, Middle East and Africa). Market Forecasts are Provided in Value (USD).
| Oil & Gas |
| Metals & Minerals |
| Agriculture Commodities |
| Chemicals & Fertilizers |
| Consumer Goods |
| Others |
| Quality & Quantity Verification |
| Weight & Draft Survey |
| Damage & Contamination Inspection |
| Pre-shipment/Pre-loading Inspection |
| Bunker Quantity & Fuel Quality Survey |
| Loading/Unloading Supervision |
| Others |
| North America | United States |
| Canada | |
| Mexico | |
| South America | Brazil |
| Peru | |
| Chile | |
| Argentina | |
| Rest of South America | |
| Asia-Pacific | India |
| China | |
| Japan | |
| Australia | |
| South Korea | |
| South East Asia | |
| Rest of Asia-Pacific | |
| Europe | United Kingdom |
| Germany | |
| France | |
| Spain | |
| Italy | |
| BENELUX (Belgium, Netherlands, and Luxembourg) | |
| NORDICS (Denmark, Finland, Iceland, Norway, and Sweden) | |
| Rest of Europe | |
| Middle East and Africa | United Arab of Emirates |
| Saudi Arabia | |
| South Africa | |
| Nigeria | |
| Rest of Middle East And Africa |
| By Cargo Type | Oil & Gas | |
| Metals & Minerals | ||
| Agriculture Commodities | ||
| Chemicals & Fertilizers | ||
| Consumer Goods | ||
| Others | ||
| By Service Type | Quality & Quantity Verification | |
| Weight & Draft Survey | ||
| Damage & Contamination Inspection | ||
| Pre-shipment/Pre-loading Inspection | ||
| Bunker Quantity & Fuel Quality Survey | ||
| Loading/Unloading Supervision | ||
| Others | ||
| By Geography | North America | United States |
| Canada | ||
| Mexico | ||
| South America | Brazil | |
| Peru | ||
| Chile | ||
| Argentina | ||
| Rest of South America | ||
| Asia-Pacific | India | |
| China | ||
| Japan | ||
| Australia | ||
| South Korea | ||
| South East Asia | ||
| Rest of Asia-Pacific | ||
| Europe | United Kingdom | |
| Germany | ||
| France | ||
| Spain | ||
| Italy | ||
| BENELUX (Belgium, Netherlands, and Luxembourg) | ||
| NORDICS (Denmark, Finland, Iceland, Norway, and Sweden) | ||
| Rest of Europe | ||
| Middle East and Africa | United Arab of Emirates | |
| Saudi Arabia | ||
| South Africa | ||
| Nigeria | ||
| Rest of Middle East And Africa | ||


Key Questions Answered in the Report
What is the cargo inspection market size and growth outlook to 2031?
The cargo inspection market size reached USD 2.8 billion in 2025 and is expected to reach USD 3.7 billion by 2031, reflecting a 4.48% CAGR during 2026-2031.
Which region leads the cargo inspection market in 2026?
Asia-Pacific leads by share and is on track to post the fastest growth through 2031, supported by port expansions, customs digitization, and rising parcel flows.
What segments drive the cargo inspection market growth through 2031?
Oil and gas remain the largest by 2025 share, while chemicals and fertilizers are the fastest growing cargo type, and pre-shipment inspection leads service growth due to upstream quality controls.
Which regulations most influence cargo inspection requirements?
The WCO SAFE Framework update, EU customs reform for e-commerce, and U.S. non-intrusive inspection targets at land borders are key drivers that expand inspection coverage and data obligations.
What technologies are changing how inspections are performed?
AI-enabled image analytics, high-energy mobile scanners, and integrated digital workflows are improving anomaly detection, documentation, and throughput without sacrificing assurance.
How are inspection providers adapting their service models?
Providers are bundling testing, certification, and remote audits, investing in software for e-filing and certificate management, and using acquisitions to add specialized lab and calibration capabilities.
Page last updated on:


