Carbon Nanotubes Market Size and Share
Market Overview
| Study Period | 2021 - 2031 |
|---|---|
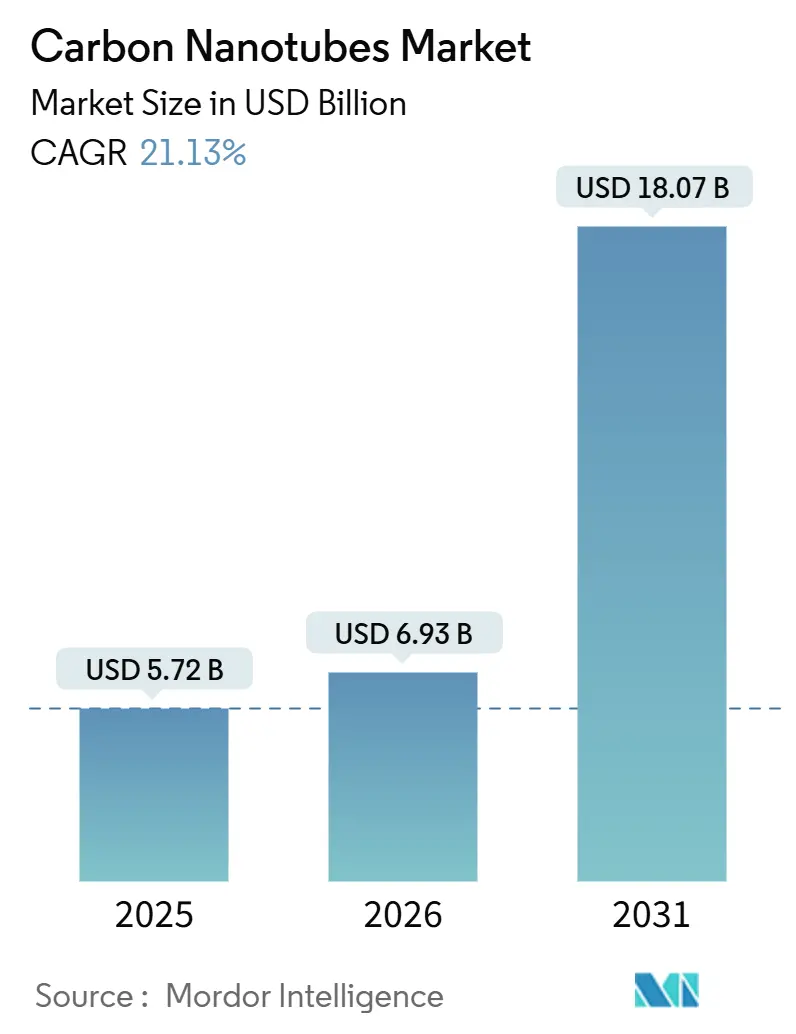
| Market Size (2026) | USD 6.93 Billion |
| Market Size (2031) | USD 18.07 Billion |
| Growth Rate (2026 - 2031) | 21.13% CAGR |
| Fastest Growing Market | Asia-Pacific |
| Largest Market | Asia-Pacific |
| Market Concentration | Medium |
Major Players *Disclaimer: Major Players sorted in no particular order Image © Mordor Intelligence. Reuse requires attribution under CC BY 4.0. | |
Carbon Nanotubes Market Analysis by Mordor Intelligence
The Carbon Nanotubes Market size is expected to grow from USD 5.72 billion in 2025 to USD 6.93 billion in 2026 and is forecast to reach USD 18.07 billion by 2031 at 21.13% CAGR over 2026-2031. Demand surges as lithium-ion cell makers replace carbon black with nanotube additives that lift electrical conductivity by 10% while trimming additive loading by 30%. The shift feeds multi-walled variants that balance performance and cost for battery electrodes, polymer composites, and conductive plastics. Continuous-flow chemical vapor deposition (CVD) lines now deliver eight-fold yield gains over fixed-bed reactors, compressing production costs and widening gross margins for high-volume suppliers. Asia-Pacific leads capacity expansion, spearheaded by China and South Korea, where gigawatt-hour battery plants anchor long-term offtake commitments.
Key Report Takeaways
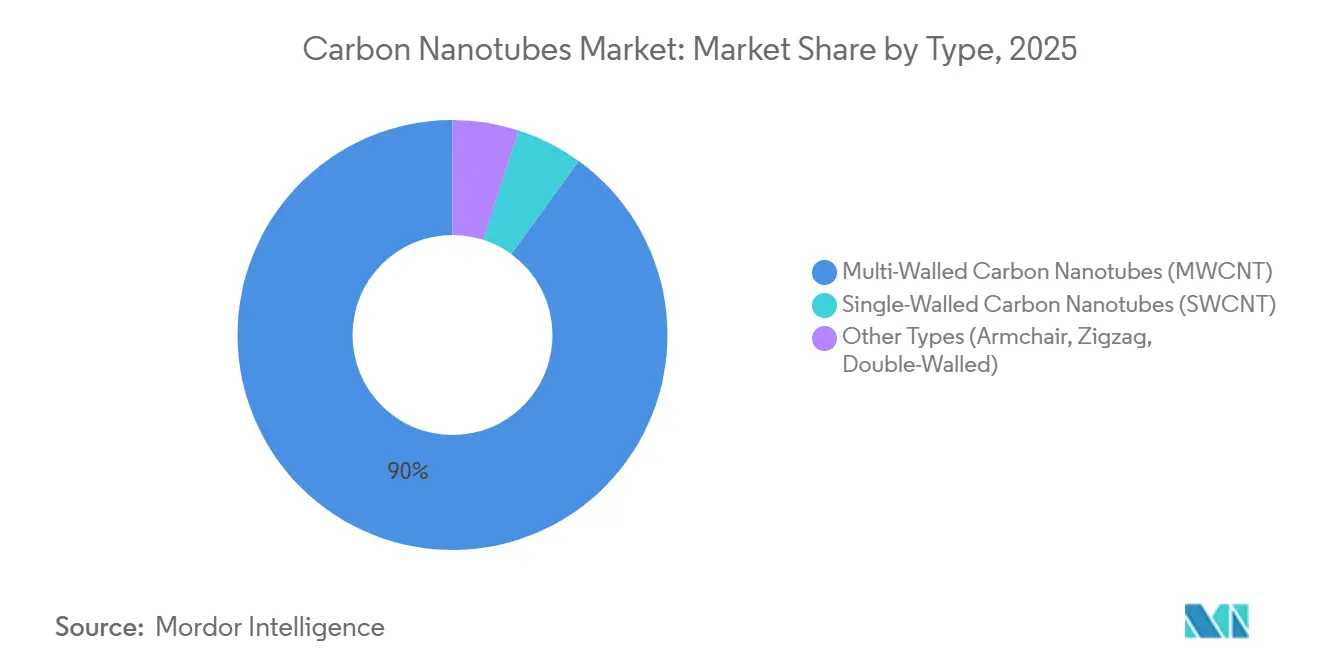
- By type, multi-walled variants held 90.03% of the carbon nanotubes market share in 2025 and are anticipated to grow at a CAGR of 20.67% during 2026-2031.
- By manufacturing method, chemical vapor deposition (CVD) accounted for 70.21% share of the carbon nanotubes market size in 2025 and is expected to grow at a 21.80% CAGR during 2026-2031.
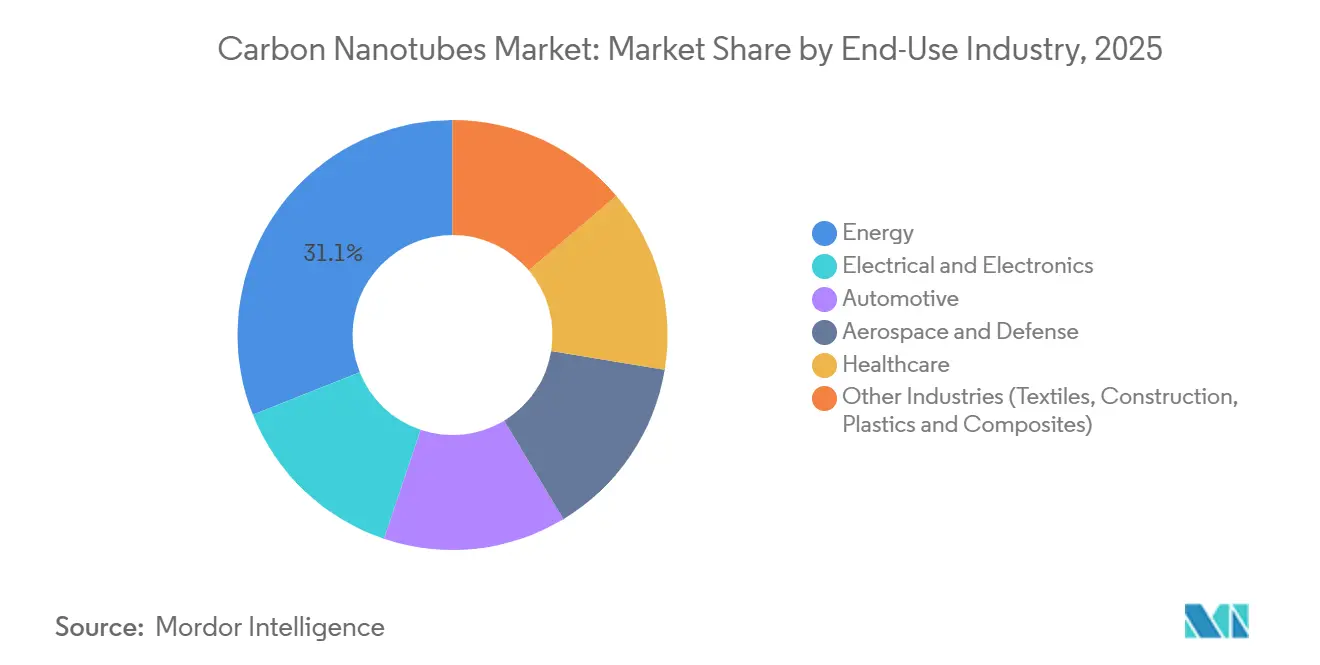
- By end-use industry, energy applications led with 31.06% revenue share in 2025; healthcare is forecast to expand at a 32.42% CAGR during 2026-2031.
- By geography, Asia-Pacific captured 54.45% of the carbon nanotubes market share in 2025 and is projected to record a 21.67% CAGR during 2026-2031.
Note: Market size and forecast figures in this report are generated using Mordor Intelligence’s proprietary estimation framework, updated with the latest available data and insights as of January 2026.
Global Carbon Nanotubes Market Trends and Insights
Driver Impact Analysis
| Drivers | (~) % Impact on CAGR Forecast | Geographic Relevance | Impact Timeline |
|---|---|---|---|
| E-mobility boom accelerating CNT demand | +6.2% | Global, strong in China, EU, North America | Medium term (2-4 years) |
| Leap in high-energy-density Li-ion and supercapacitor production | +5.8% | APAC core, spill-over to North America and EU | Medium term (2-4 years) |
| Aerospace push for ultra-light structural composites | +3.1% | North America, EU, emerging Middle East | Long term (≥ 4 years) |
| Additive manufacturing integration for conductive filaments | +2.4% | North America, EU, Japan | Medium term (2-4 years) |
| Quantum-computing interconnect wiring requirements | +1.2% | North America, select EU and APAC research hubs | Long term (≥ 4 years) |
| Source: Mordor Intelligence | |||
E-mobility Boom Accelerating CNT Demand
Electric-vehicle battery packs now incorporate 0.5-2.0 wt% CNTs to maintain electron pathways across silicon-graphite anodes that swell during cycling. LG Chem’s four South Korean plants deliver 6,100 tons/year output under multi-year contracts with Tier-1 automakers, locking in supply for global platform launches. China’s New Energy Vehicle plan sets a 50,000 tons/year CNT requirement by 2025, already matched by Jiangsu Cnano’s 12,000 tons/year single-site capacity. The migration toward lithium-iron-phosphate chemistries intensifies demand because LFP cells need higher conductive-additive loadings. Solid-state prototypes from QuantumScape and Samsung SDI embed nanotube current collectors, positioning CNTs as a bridging solution through the 2030s.
Leap in High-Energy-Density Li-ion and Supercapacitor Production
Vertically aligned CNT forests deliver surface areas above 1,000 m²/g that drive supercapacitor power densities of 10-15 kW/kg. Resonac Holdings supplies dispersions for 48-V mild-hybrid modules that buffer load spikes and extend pack life. Laboratory CNT-sulfur cathodes have reached 400 Wh/kg, though commercial timelines depend on polysulfide mitigation. Kumho Petrochemical operates a 1,200-ton/year plant delivering ultra-pure grades with <100 ppm metals for supercapacitors. Grid projects in California and Germany pilot CNT-supercapacitor banks that could absorb 5,000 tons/year by 2030 once costs fall below USD 200/kWh.
Aerospace Push for Ultra-Light Structural Composites
Toray Industries invested JPY 5 billion from 2024-2026 to scale CNT-enhanced prepregs that cut airframe weight by 20% while adding EMI shielding above 60 dB[1]Toray Industries, “Annual Report 2025,” toray.com . NASA tests show 1 wt% CNT in epoxy raises lightning-strike resistance by 40%, easing certification hurdles. Airbus and Boeing evaluate CNT-doped resins for wing spars that can deliver 12% lifetime fuel savings. Defense programs seek CNT radomes that survive Mach 5 heat loads while staying radar transparent. Nanocyl’s NC7000 functionalization improves laminate dispersion, although aerospace qualification extends three to five years.
Additive Manufacturing Integration for Conductive Filaments
CNT-filled 3D-printing filaments enable rapid production of antenna housings, EMI gaskets, and flexible circuits, shrinking prototyping cycles from weeks to hours. Applied Nanostructures supplies single-walled grades for aerospace tooling where static dissipation is critical. Automotive plants print CNT-PLA sensor enclosures, achieving 10^6 S/m conductivity at 10 wt% loading, eliminating secondary metallization steps. Stratasys and Ultimaker ship printers with CNT filament profiles, moving technology from lab to factory. Nozzle abrasion challenges spurred ruby-tip designs that quintuple lifespan, cutting the total cost of ownership. ISO/ASTM 52900 amendments to cover CNT composites will speed adoption in regulated sectors.
Restraint Impact Analysis
| Restraints | (~) % Impact on CAGR Forecast | Geographic Relevance | Impact Timeline |
|---|---|---|---|
| Occupational toxicology and nano-regulation tightening in EU and US | -2.8% | EU, North America, monitoring in APAC | Short term (≤ 2 years) |
| Competition from graphene and boron-nitride nanotubes in thermal apps | -1.9% | Global, intense in electronics and composites | Medium term (2-4 years) |
| Volatility in petro-chemical feedstock supply during green transition | -1.5% | Global, acute where gas imports dominate | Short term (≤ 2 years) |
| Source: Mordor Intelligence | |||
Occupational Toxicology and Nano-Regulation Tightening in EU and US
The European Chemicals Agency listed multi-walled CNTs as substances of very great concern under REACH Annex XIV in 2024, triggering costly authorization filings for users above 1 ton/year[2]European Chemicals Agency, “REACH Annex XIV Decision 2024,” echa.europa.eu. NIOSH set a 1 µg/m³ exposure limit that forces enclosed handling and real-time aerosol monitoring, adding USD 2-5 million in capex for mid-scale plants. Long CNT fibers longer than 15 µm show asbestos-like inflammation in rodent lungs, though human epidemiology remains limited. Smaller European firms see compliance costs topping 15% of revenue, accelerating consolidation. ISO 80004 terminology harmonization helps, but divergent national rollouts still hamper cross-border supply chains. Producers invest in surface treatments that shorten aspect ratios below 10:1, a strategy that early in vitro assays suggest lowers cytotoxicity.
Competition from Graphene and Boron-Nitride Nanotubes in Thermal Apps
Graphene nanoplatelets reach in-plane thermal conductivities of 3,000-5,000 W/m-K, surpassing CNT composites in two-dimensional heat spreaders for smartphones and LED modules. Boron-nitride nanotubes deliver similar heat conduction while remaining electrically insulating, preferred in high-voltage power electronics. Scaled Chinese graphene plants cut multi-layer prices to USD 100-200/kg in 2025, squeezing CNT cost advantage in non-conductive roles. Hybrid graphene-CNT blends add complexity to supply chains and quality assurance. Patent filings for graphene conductive inks rose 40% YoY in 2024, hinting at displacement risk in printed electronics if print resolution issues resolve. CNT suppliers counter by stressing superior aspect ratios for percolation, flexibility for wearables, and validated aerospace pedigrees.
Segment Analysis
By Type: Multi-Walled Variants Dominate Cost-Sensitive Volumes
Multi-walled CNTs commanded 90.03% of carbon nanotubes market share in 2025 and are forecast to advance at a 20.67% CAGR through 2031. Pricing between USD 50-300/kg secures traction in battery, composite, and plastics lines where cost sensitivity overrides ultimate conductivity. Single-walled grades’ USD 1,500-2,000/kg prices confine them to semiconductor and quantum-computing uses that prize purity and narrow diameter spread. Emerging few-walled variants from OCSiAl preserve 70% of SWCNT conductivity at 40% of the cost, enticing battery makers aiming to slash additive loadings without sacrificing performance. Armchair SWCNTs target OLED conductive films once sheet resistance falls below 100 Ω/sq, a milestone expected within three years.
Supply scalability favors multi-walled feedstock because CVD mega-plants deliver volumes unattainable with HiPco or laser ablation. The carbon nanotubes market size for multi-walled products is projected to exceed USD 13 billion by 2031 under base-case demand scenarios. Regulatory clearance is smoother as larger diameters reduce fiber biopersistence. Yet premium single-walled lines keep margins high through IP-protected purification, commanding 30-40% EBIT. Producers that straddle both tiers hedge revenue streams, capturing high-volume commodity sales while cultivating specialty niches in photonics and quantum devices.
Note: Segment shares of all individual segments available upon report purchase
By Manufacturing Method: CVD Scales While Arc Discharge Retreats
CVD processes generated 70.21% of 2025 output and will sustain a 21.80% CAGR, cementing leadership as gas-looping reactors lift conversion efficiency to 95% and recycle catalysts. HiPco maintains a considerable market size for electronics-grade single-wall lines, although batch limits and high CO pressures cap daily throughput. Arc discharge shrank, and laser ablation volume is relegated to laboratory supply, where purity trumps economics. Raymor’s closed-loop methane recovery slashes feedstock costs by 60%, underpinning a USD 25 million battery-sector contract signed in 2025.
Prospects hinge on energy intensity and regulatory compliance. Plasma-enhanced CVD at 400 °C promises direct growth on polymer films for wearable electronics, a niche that could capture 5% of the carbon nanotubes market size over the forecast period if scalability tests succeed. Arc discharge remains essential for prototype research as it yields pristine crystals, yet the electricity use of 10 kWh/g undermines commercial viability. Producers pivot toward modular CVD lines that can track regional demand, trimming logistics lead times from quarters to weeks.
By End-Use Industry: Energy Leads While Healthcare Surges
Energy applications absorbed 31.06% of the 2025 volume, reflecting entrenched use in lithium-ion batteries and supercapacitors. Healthcare posts the fastest 32.42% CAGR as CNT-based biosensors and drug carriers move through Phase I trials. Electrical and electronics demand is propelled by conductive inks for PCBs and radio-frequency shielding films. In automotive, CNT-reinforced composites cut part weight without sacrificing stiffness. Demand from aerospace and defense is driven by lightning-strike protection and radar-transparent composites.
By 2031, the carbon nanotubes market size for healthcare is anticipated to gain significant momentum once biosensing, imaging, and targeted delivery platforms gain regulatory clearance. Automotive demand scales with EV output; 50-200 g CNTs per battery pack translates to multikiloton volumes when global EV production reaches 30 million units. Aerospace growth depends on qualification timelines, yet Boeing’s 777X wing-spar specification could consume 500 ton/year from 2027 onward. Construction and textiles remain niche but expand steadily as smart fabrics and RF-shielded concrete find new adopters.
Note: Segment shares of all individual segments available upon report purchase
Geography Analysis
Asia-Pacific dominated with 54.45% of the 2025 volume and is forecast to rise at a 21.67% CAGR during 2026-2031. China’s 12,000-ton/year Jiangsu Cnano complex and South Korea’s 6,100 tons/year LG Chem network anchor regional supply pipelines to CATL, BYD, Samsung SDI, and SK Innovation. Japan prioritizes high-purity lines for aerospace and semiconductors, leveraging Toray’s ¥5 billion prepreg expansion. India relies on imports today, but incentives under its PLI scheme could spark domestic CVD projects by 2028. Regional pricing sits at USD 50-80/kg for multi-walled grades due to integration into petrochemical feedstocks and scale economies.
North America's market growth is influenced by domestic sourcing from the aerospace, defense, and energy storage industries. Inflation Reduction Act tax credits support potential 2,000-ton/year new capacity colocated with battery gigafactories. Canada’s Raymor markets low-carbon plasma-torch CNTs powered by hydropower, while Mexico offers dispersion and compounding services for automotive suppliers.
Europe's captured CNT demand is bolstered by the European Battery Alliance’s drive for local conductive additives. Nanocyl and Arkema operate mid-scale plants serving Airbus and Stellantis platforms, yet REACH compliance adds cost layers that pressure smaller entrants. Thomas Swan’s U.K. lines secure defense demand where ITAR rules deter Asian imports. South America and the Middle East-Africa are witnessing gradual market growth, with Brazil importing CNTs for agrochemicals and Saudi Arabia studying petrochemical integration as part of Vision 2030.

Competitive Landscape
The carbon nanotubes market is moderately fragmented. Asian leaders pursue scale and price leadership, integrating feedstocks and locking customers under multi-year battery contracts. Western counterparts focus on high-margin aerospace, defense, and semiconductor niches where certifications and security-of-supply mandates outweigh price. Patent races center on catalyst design and functionalization; OCSiAl owns 180 floating-catalyst patents, Toray holds 95 composite-interface filings, and Hyperion Catalysis guards foundational fiber.
Disruptors emerge in methane pyrolysis and plasma-enhanced CVD. C-Zero targets negative-cost feedstocks via hydrogen coproducts, while FutureCarbon pursues low-temperature deposition on polymers. Vertical integration intensifies as LG Chem back-integrates into ethylene crackers and OCSiAl forward-integrates into masterbatches, capturing value across the chain. ISO 80004 standardization eases customer multisourcing, tilting the advantage toward cost-competitive suppliers. Companies offering ready-to-use dispersions in customer solvents capture 20-30% price premiums by simplifying downstream processing.
Carbon Nanotubes Industry Leaders
OCSiAl
LG Chem
Jiangsu Cnano Technology Co., Ltd.
Cabot Corporation
Toray Industries, Inc.
- *Disclaimer: Major Players sorted in no particular order
Recent Industry Developments
- October 2025: OCSiAl committed USD 300 million for a Luxembourg plant that will produce 10,000 ton/year single-walled CNTs from 2028, powered by renewable electricity and methane-pyrolysis feedstock.
- September 2025: LG Chem brought its fourth South Korean line online, lifting capacity to 6,100 ton/year and signing a USD 180 million five-year supply deal with a European automaker.
- May 2025: Jiangsu Cnano completed a 3,000-ton/year expansion six months early, pushing its single-site output to 12,000 tons/year to support BYD and CATL contracts.
Research Methodology Framework and Report Scope
Market Definitions and Key Coverage
Our study defines the carbon nanotubes market as the value of first-sale multi-walled and single-walled CNT materials, delivered as dry powders, slurries, or masterbatches, produced through chemical vapor deposition, arc-discharge, HiPco, or laser ablation routes and supplied to composites, energy storage, electronics, and biomedical value chains worldwide.
We explicitly exclude downstream parts, devices, or finished composites that only contain CNTs.
Segmentation Overview
- By Type
- Multi-Walled Carbon Nanotubes (MWCNT)
- Single-Walled Carbon Nanotubes (SWCNT)
- Other Types (Armchair, Zigzag, Double-Walled)
- By Manufacturing Method
- Chemical Vapor Deposition (CVD)
- High-Pressure Carbon Monoxide (HiPco)
- Arc Discharge
- Laser Ablation
- By End-Use Industry
- Electrical and Electronics
- Energy
- Automotive
- Aerospace and Defense
- Healthcare
- Other Industries (Textiles, Construction, Plastics and Composites)
- By Geography
- Asia-Pacific
- China
- India
- Japan
- South Korea
- Rest of Asia-Pacific
- North America
- United States
- Canada
- Mexico
- Europe
- Germany
- United Kingdom
- Italy
- France
- Spain
- Rest of Europe
- South America
- Brazil
- Argentina
- Rest of South America
- Middle East and Africa
- Saudi Arabia
- South Africa
- Rest of Middle East and Africa
- Asia-Pacific
Detailed Research Methodology and Data Validation
Primary Research
We validated secondary findings through interviews with CNT producers, cathode material formulators, and polymer compounders across Asia-Pacific, North America, and Europe, followed by targeted buyer surveys that clarified loading rates and price dispersion.
Desk Research
During desk work, we gathered official customs codes (HS-280300 series) for CNT flows, quarterly output statistics from China's MIIT, patent family counts on CVD reactor upgrades via Questel, and trade briefs from the Nanotechnology Industries Association. We also screened Carbon and ACS Nano for fresh average selling price benchmarks and mined company 10-Ks in D&B Hoovers to map capacity additions.
Complementary inputs came from Dow Jones Factiva newsfeeds that captured plant start-ups, regional safety regulations, and governmental R&D grants, allowing us to frame demand ceilings and policy catalysts.
The sources highlighted here are illustrative; many additional public and paid references were tapped for data collection, validation, and clarification.
Market-Sizing & Forecasting
A top-down reconstruction of global output, built from national production and trade data, anchors the 2025 baseline, while selective bottom-up checks such as supplier capacity roll-ups and sampled ASP × volume tests fine-tune totals. Key model variables include regional production capacity, blended ASP, lithium-ion battery cathode penetration, composite resin output, and patent momentum.
Forecasts to 2030 employ multivariate regression layered with scenario analysis; battery adoption trajectories and ASP compression act as primary drivers. Where bottom-up gaps persisted, regional growth proxies were interpolated before reconciling with primary research ranges.
Data Validation & Update Cycle
Results pass variance checks against independent series, anomaly flags, and multi-analyst review; the study refreshes annually, with interim updates triggered by material capacity shifts or regulatory changes, and a final pre-release sweep ensures clients receive the latest view.
Why Mordor's Carbon Nanotubes Baseline Commands Reliability
Published estimates diverge because firms apply unique scopes, currency years, and price sets, and our disciplined boundary setting, yearly refresh, and dual-layer modelling make the numbers we present the dependable starting point.
Key gap drivers include other studies limiting coverage to bulk powder sales, omitting masterbatch value, freezing FX rates to 2024, or relying on unpublished spot quotes, whereas we blend ASPs, cross-check capacity ramps, and adjust for regional premiums.
Benchmark comparison
| Market Size | Anonymized source | Primary gap driver |
|---|---|---|
| USD 6.89 B (2025) | Mordor Intelligence | |
| USD 3.71 B (2024) | Global Consultancy A | Bulk powder only, no masterbatch, older base year |
| USD 1.31 B (2024) | Global Consultancy B | Omits small Asian producers, conservative ASP, fixed 2024 FX |
These comparisons show that Mordor Intelligence's balanced scope and regularly refreshed inputs yield a transparent, repeatable baseline that decision-makers can trust.
Key Questions Answered in the Report
How large is the carbon nanotube market in 2026?
The carbon nanotubes market size is USD 6.93 billion in 2026 with a projected 21.13% CAGR to 2031.
Which segment holds the biggest share of global demand?
Multi-walled variants dominate with 90.03% of carbon nanotubes market share in 2025, driven by battery and composite use.
What region leads production and consumption?
Asia-Pacific accounts for 54.45% of 2025 volume and continues to expand as China and South Korea add large-scale CVD capacity.
Why are CNTs important for electric-vehicle batteries?
Adding 0.5-2.0 wt% CNTs boosts electrode conductivity, enabling higher rate capability and longer cycle life in lithium-ion packs.
What are the main regulatory challenges facing producers?
EU REACH classification as a substance of very high concern and NIOSH exposure limits require costly containment and compliance systems.
Which companies are investing in new capacity?
OCSiAl is building a 10,000 ton/year plant in Luxembourg, LG Chem raised South Korean output to 6,100 ton/year, and Jiangsu Cnano expanded to 12,000 ton/year.


