
Captive Insurance Market Size and Share
Market Overview
| Study Period | 2020 - 2031 |
|---|---|
| Market Size (2026) | USD 258.20 Billion |
| Market Size (2031) | USD 332.70 Billion |
| Growth Rate (2026 - 2031) | 5.20 % |
| Fastest Growing Market | Asia-Pacific |
| Largest Market | North America |
| Market Concentration | Low |
Major Players *Disclaimer: Major Players sorted in no particular order Image © Mordor Intelligence. Reuse requires attribution under CC BY 4.0. | |
Captive Insurance Market Analysis by Mordor Intelligence
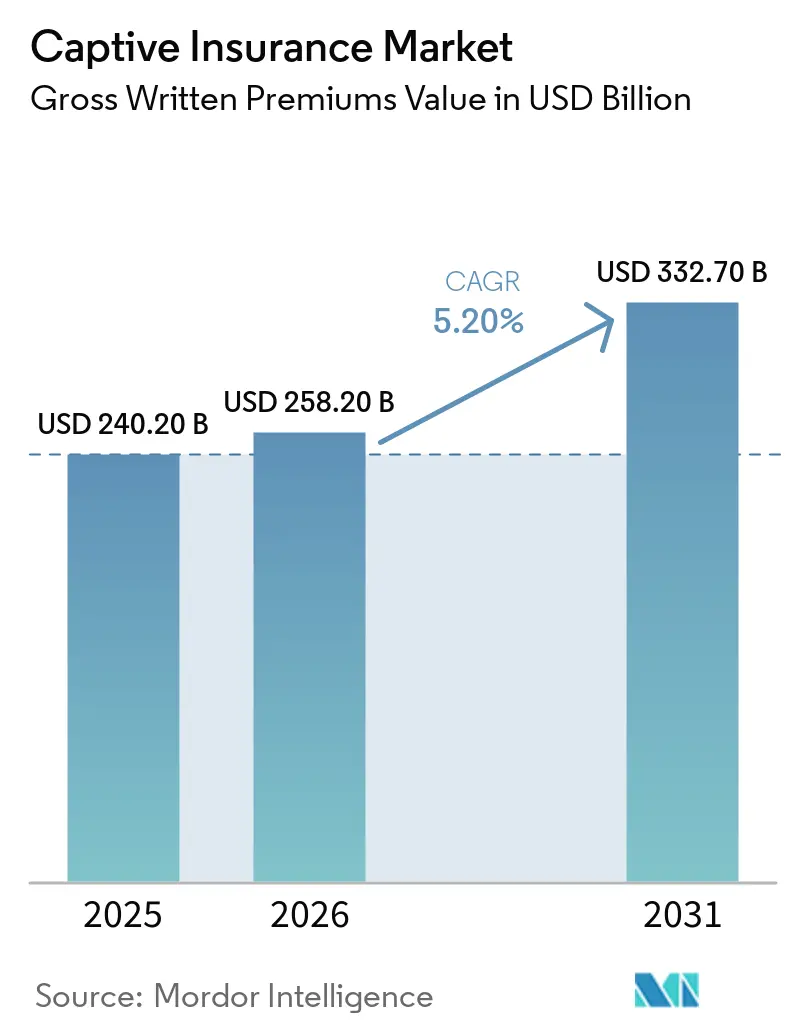
The captive insurance market size is projected to expand from USD 240.2 billion in 2025 and USD 258.2 billion in 2026 to USD 332.7 billion by 2031, registering a CAGR of 5.2% between 2026 and 2031. Commercial liability, excess, and specialty insurance remained difficult to place, which kept captive formation relevant for companies facing higher premiums, tighter capacity, and less certainty around the scope of cover available at renewal. Nuclear verdicts and third-party litigation funding continued to increase the cost of liability risks, encouraging companies to retain selected exposures through captive arrangements rather than relying entirely on commercial capacity for those risks. Marsh-managed captives wrote USD 79.1 billion in gross written premium during 2025, while Fortune 500 companies increased captive premium volume by 9%. The captive insurance market is also supported by the continued value of investment income on reserves, access to reinsurance, and the retention of underwriting profit within the parent group when loss experience is managed effectively. These factors support a broader role for captives in enterprise risk planning, even where selected commercial property rates have moderated, because companies can maintain established risk-financing programs across changing insurance cycles.
Key Report Takeaways
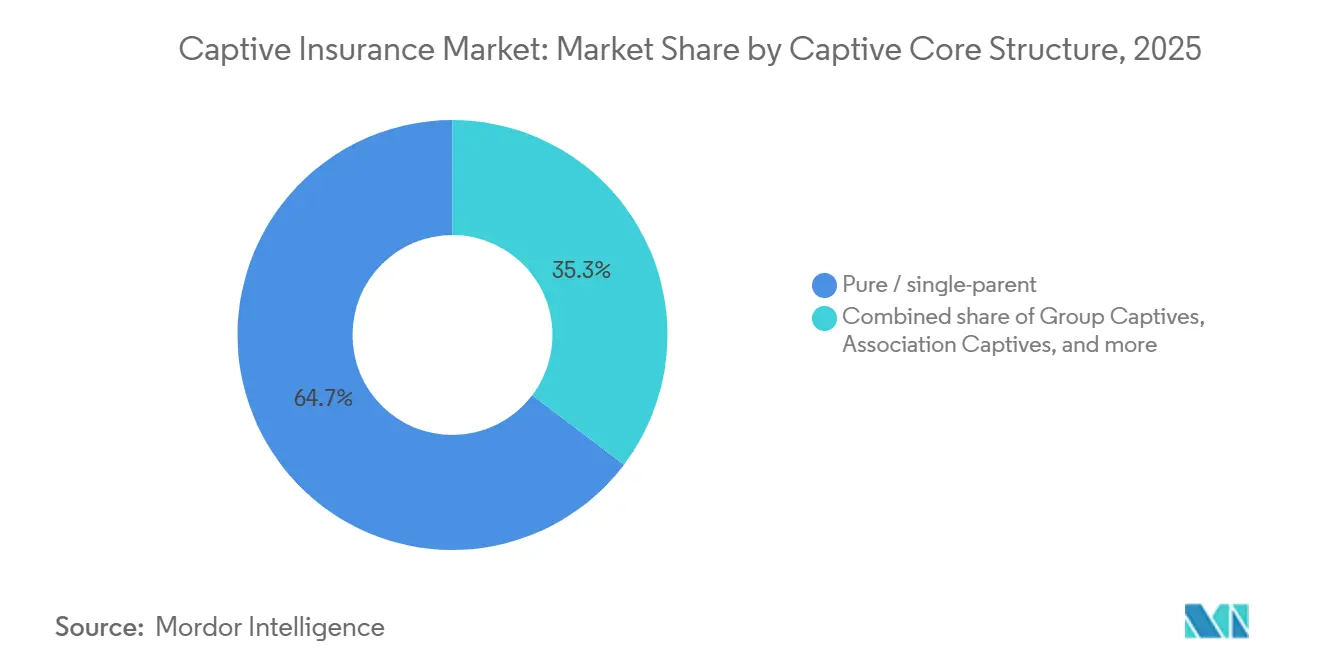
- By captive core structure, pure and single-parent captives captured 64.7% of the captive insurance market share in 2025, while sponsored and cell captive cores are projected to grow at 8.4% CAGR through 2031.
- By coverage written, property accounted for 24.6% of the captive insurance market size in 2025, while cyber is projected to grow at 10.2% CAGR through 2031.
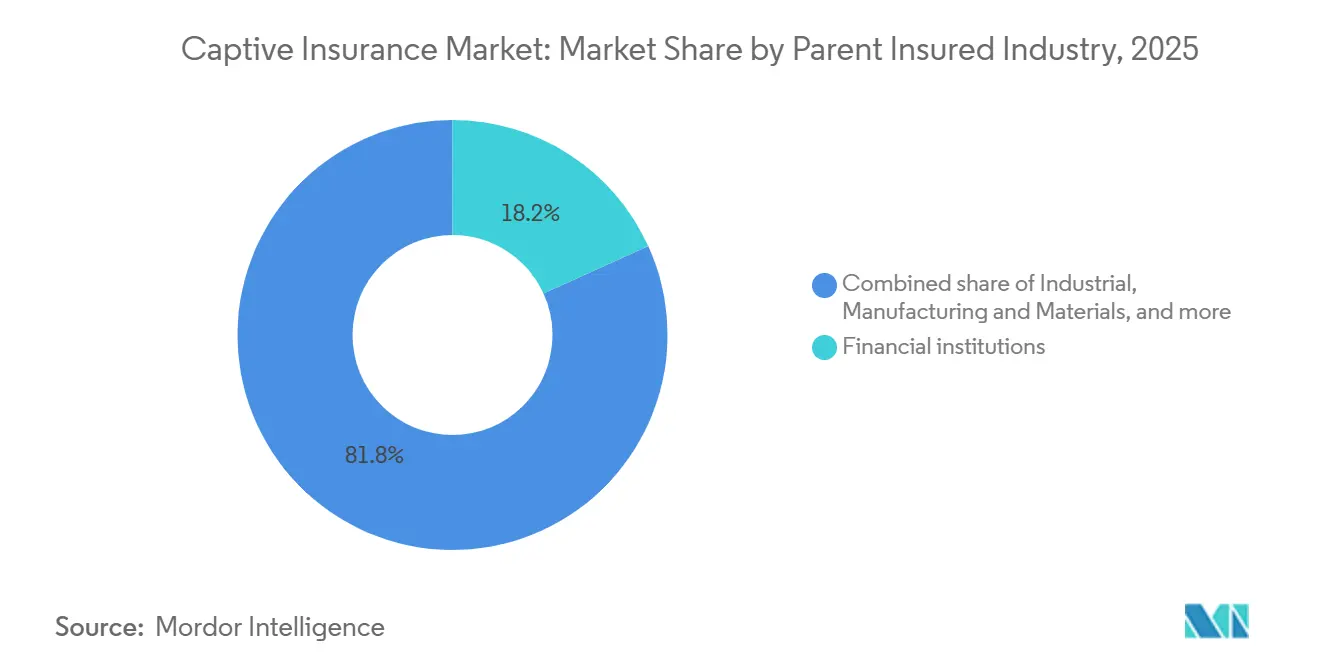
- By parent or insured industry, financial institutions held 18.2% share of the captive insurance market in 2025, while technology, media, and telecommunications is projected to grow at 8.1% CAGR through 2031.
- By parent scale, large and multinational enterprises captured 72.8% of the captive insurance market size in 2025, while mid-market enterprises are projected to grow at 7.7% CAGR through 2031.
- By geography, North America held 75.4% of the captive insurance marketDriver (~) % Impact on CAGR Forecast Geographic Relevance Impact Timeline
- Commercial Insurance Capacity Constraints and Pricing Volatility +1.8% Global, concentrated in North America and Europe Short term (≤ 2 years)
- Increasing Complexity of Cyber, Climate, and Supply-Chain Risks +1.4% Global Medium term (2-4 years)
- Expansion of Group and Cell Captive Structures +1.0% North America, Asia-Pacific core, spillover to Europe Medium term (2-4 years)
- Rising Employee-Benefit and Medical Stop-Loss Costs +0.8% North America and Europe Medium term (2-4 years)
- Innovation in Captive Fronting, Reinsurance, and Collateral Solutions +0.6% Global Long term (≥ 4 years)
- Growing Adoption of Data-Driven Risk Management and Captive Technology +0.4% Global Long term (≥ 4 years)
- in 2025, while Asia-Pacific is projected to grow at 8.5% CAGR through 2031.
Note: Market size and forecast figures in this report are generated using Mordor Intelligence’s proprietary estimation framework, updated with the latest available data and insights as of January 2026.
Global Captive Insurance Market Trends and Insights
Drivers Impact Analysis*
| Driver | (~) % Impact on CAGR Forecast | Geographic Relevance | Impact Timeline |
|---|---|---|---|
| Commercial Insurance Capacity Constraints and Pricing Volatility | +1.8% | Global, concentrated in North America and Europe | Short term (≤ 2 years) |
| Increasing Complexity of Cyber, Climate, and Supply-Chain Risks | +1.4% | Global | Medium term (2-4 years) |
| Expansion of Group and Cell Captive Structures | +1.0% | North America, Asia-Pacific core, spillover to Europe | Medium term (2-4 years) |
| Rising Employee-Benefit and Medical Stop-Loss Costs | +0.8% | North America and Europe | Medium term (2-4 years) |
| Innovation in Captive Fronting, Reinsurance, and Collateral Solutions | +0.6% | Global | Long term (≥ 4 years) |
| Growing Adoption of Data-Driven Risk Management and Captive Technology | +0.4% | Global | Long term (≥ 4 years) |
| Source: Mordor Intelligence | |||
Commercial Insurance Capacity Constraints and Pricing Volatility
Hard commercial insurance conditions remained an immediate reason for captive formation, although property rates showed moderation in selected areas. Auto liability, excess liability, professional liability, and construction risks continued to face adverse loss trends. Brown & Brown identified nuclear verdicts, social inflation, and third-party litigation funding as major forces affecting capacity and pricing in these lines[1]Brown & Brown, “Captives 2026 Market Trends Report,” Brown & Brown Commercial Insurance Insights, bbrown.com. Iowa’s insurance regulator stated that transportation auto, excess liability, and medical stop-loss were among the fastest-growing lines entering captive programs in 2026. The captive insurance market benefits when companies retain these difficult risks and add other lines to an existing captive, allowing the structure to serve a broader range of planned risk-financing needs. Captives formed during harder pricing cycles have therefore continued to operate as commercial conditions changed in some property classes.
Increasing Complexity of Cyber, Climate, and Supply-Chain Risks
Captives have become more relevant where commercial policies misprice risk, exclude material exposures, or provide limited policy breadth. Aon reported that 24% of captive owners underwrote cyber risk through their captives in 2025, compared with 1% in 2014[2]Aon, “Captives and Cyber: From Tactical Response to Strategic Risk Optimization,” Aon, aon.com. This shift reflects the growing importance of cyber risk within corporate risk retention decisions. Gallagher Re described shared-limit excess-of-loss structures that combine cyber tail risk with uncorrelated property catastrophe exposure to reduce the cost of tail protection. Captive-managed programs can apply this type of risk structuring across multiple coverage lines, particularly where the underlying risks have different loss characteristics and funding requirements. The captive insurance market is consequently serving a larger role in managing risks that standard insurance products may not address adequately, while supporting planned risk retention for exposures with limited capacity, narrow terms, or uncertainty at renewal.
Expansion of Group and Cell Captive Structures
Group captives, sponsored captives, and protected cell companies have extended access to companies below the largest enterprise tier. Vermont reported that sponsored captives represented 5 of 15 new formations during the first half of 2026[3]Vermont Department of Financial Regulation, “Vermont Sees Wave of Captive Restructurings in 2026,” Vermont Department of Financial Regulation, captiveinternational.com. Singapore’s Monetary Authority proposed a protected cell company framework in July 2026 to lower establishment and operating costs for smaller Asian companies. The proposed framework is targeted for implementation in 2028. Group and cell models reduce the capital and operational commitments needed for a standalone captive, making structured risk retention more practical for companies with lower premium volumes. The captive insurance market can therefore reach companies that are building experience with alternative risk financing before considering a standalone structure, and provide a practical entry point for companies not yet ready for a pure captive.
Rising Employee-Benefit and Medical Stop-Loss Costs
Healthcare expenses and specialty drug costs have increased employer interest in employee-benefit captives. WTW identified rising healthcare costs and specialty drug expenditures as key factors behind the use of captives for medical stop-loss and aggregate health program volatility[4]Willis Towers Watson, “Insurance Marketplace Realities 2026 Captives,” WTW, wtwco.com. Aon reported that 5 new clients committed to employee-benefit captive strategies in early 2025. That figure matched the historical global annual average of 5 to 6 new clients recorded since the mid-1990s. Marsh also reported double-digit growth in employee-benefit lines within its managed captive portfolio during 2025. The captive insurance market is benefiting as employers use these structures to manage stop-loss exposure and health program volatility while supporting closer oversight of claims patterns and retained costs within employee-benefit programs.
Restraints Impact Analysis*
| Restraint | (~) % Impact on CAGR Forecast | Geographic Relevance | Impact Timeline |
|---|---|---|---|
| High Capital, Collateral, and Liquidity Requirements | -1.2% | Global | Long term (≥ 4 years) |
| Regulatory, Tax, and Economic-Substance Complexity | -0.8% | Global, most acute in cross-border structures | Medium term (2-4 years) |
| High Formation, Governance, and Ongoing Management Costs | -0.5% | Global, more acute for mid-market entrants | Medium term (2-4 years) |
| Shortage of Specialized Captive Insurance and Actuarial Expertise | -0.5% | Global | Long term (≥ 4 years) |
| Source: Mordor Intelligence | |||
High Capital, Collateral, and Liquidity Requirements
Capital adequacy requirements remain a persistent barrier for companies considering a captive, especially below the large-enterprise level. The Basel III endgame phase-in began in July 2025 for United States banks with assets above USD 100 billion. It may increase letter-of-credit pricing and reduce the availability of collateral structures used in fronted captive programs. Large owners with stronger balance sheets can shift toward funded trust structures when needed. Mid-market and newer owners may face a more limited formation environment because they have fewer collateral options and less flexibility to absorb higher funding or letter-of-credit expenses. This condition also reinforces interest in cell captives, which generally require lower minimum capitalization than standalone structures and can provide an alternative where full collateral requirements would otherwise delay formation.
Regulatory, Tax, and Economic-Substance Complexity
Cross-border captive structures face increased scrutiny under the OECD Pillar Two framework, BEPS-aligned transfer pricing rules, and economic-substance requirements. These rules add documentation and governance work for companies moving premiums across jurisdictions, particularly where a captive serves operations, insurers, and risk programs in more than 1 country. The United Kingdom Prudential Regulation Authority and Financial Conduct Authority released consultation papers in 2026 on a dedicated captive regime outside Solvency United Kingdom. The proposal recognized that United Kingdom-linked captives operating offshore can move capital away from the London financial center. Iowa updated its captive insurance law in May 2026, including a new subchapter for life captive reinsurance companies and a tax waiver for redomestications. Companies with operations in several jurisdictions still need to reconcile local domicile rules with transfer pricing, substance tests, and reporting requirements before establishing a captive.
*Our forecasts treat driver/restraint impacts as directional, not additive. The impact forecasts reflect baseline growth, mix effects, and variable interactions.
Segment Analysis
By Captive Core Structure: Cell Structures Support Future Single-Parent Formations
Pure and single-parent captives held 64.7% share of the captive insurance market in 2025. Their position reflected direct ownership, full underwriting control, and the ability to retain investment income on reserves, features that are particularly relevant for large parents with mature risk-management and treasury operations. Large multinational companies often prefer these structures because they can support several risk lines and align with established governance processes. Group captives, association captives, and risk retention groups pool companies with similar risk needs. This pooling can improve access to underwriting capacity and reinsurance purchasing terms, while allowing participants to share administrative resources and program oversight.
Sponsored and cell captive cores are the fastest-growing structures, with a projected CAGR of 8.4% through 2031. Vermont recorded 5 sponsored captives among 15 new formations in the first half of 2026, while cell applications moved at a similar pace to standalone formations. Manager platforms allow small and medium-sized businesses to obtain tailored coverage without bearing the full cost of a standalone vehicle. These structures can create a path toward future standalone ownership as companies gain operating experience. The captive insurance industry, therefore, has a wider entry route for companies that previously lacked the scale for a pure captive, while keeping the option to move toward standalone ownership as their programs mature.


By Coverage Written: Property Anchors Premium While Cyber Gains Importance
Property represented 24.6% of captive coverage premiums in 2025, making it the largest individual line written. Marsh-managed captives wrote more than USD 9 billion in property gross written premium during 2025. Asset-intensive industrial, energy, and manufacturing companies use captive arrangements to retain property exposure, especially where high asset values make commercial deductibles, capacity limits, and layered insurance programs more significant. General liability and excess or umbrella liability formed the largest coverage group by total premium. Nuclear verdicts have increased the cost of commercial excess layers, which has supported retention through captive programs.
Cyber is the fastest-growing coverage line, with a projected CAGR of 10.2% through 2031. Aon found that 24% of captive owners used their captives to underwrite cyber in 2025. Verisk’s ISO Core Lines unit filed endorsements effective January 2026 that allow carriers to exclude generative artificial intelligence claims from standard commercial general liability policies. Employee benefits and medical stop-loss also represent a material and growing part of the captive portfolio. Marsh recorded double-digit growth in benefit lines within its managed portfolio in 2025.
By Parent or Insured Industry: Financial Institutions Lead While Technology, Media, and Telecommunications Grows Fastest
Financial institutions accounted for 18.2% of the captive insurance market size by parent industry in 2025. Banks, asset managers, and insurance groups use captives for regulatory capital management, catastrophe risk absorption, and investment strategies supported by reserve assets. Healthcare and life sciences companies also use captive structures to address medical malpractice and stop-loss complexity in self-funded health plans. Energy, utilities, and mining companies maintain multi-line programs for environmental, pollution, and parametric property exposures. These companies often face high-hazard risks that need customized retention and reinsurance structures, particularly where environmental, operational, and property exposures are material to the parent’s business.
Technology, media, and telecommunications is the fastest-growing parent industry in the captive insurance market, with a projected CAGR of 8.1% through 2031. Cyber exposure, intellectual property risk, and cloud dependency-related business interruption shape the risk profile of this group, creating a need for coverage structures that can reflect changing operational dependencies. These exposures correspond with commercial lines that can have restrictive coverage terms and exclusions, creating a stronger case for companies to assess captive retention alongside commercial insurance purchases. Iowa’s captive insurance director identified transportation auto and excess liability as rapidly growing captive lines during 2026. Industrial, manufacturing, and materials companies remain a large established group because of their property and workers’ compensation needs. Retail and consumer companies are also using captive arrangements for warranty and residual value exposures.
By Parent Scale: Mid-Market Demand Broadens Access Beyond Large Multinationals
Large and multinational enterprises captured 72.8% share of the captive insurance market by parent scale in 2025. Their premium volumes can support capitalization costs and permit diversified risk writing across several lines, while their larger operating footprints can provide broader loss data and more diversified risk pools. These companies commonly operate more than 1 captive across different domiciles and risk categories. They also have established access to fronting carriers and global reinsurance markets, which can support coverage design across several jurisdictions and retained risk layers. Small and micro enterprises remain the smallest group because standalone captive economics require sufficient premium volume and capital.
Mid-market enterprises are the fastest-growing parent-scale group, with a projected CAGR of 7.7% through 2031. Group captives, cell structures, and rent-a-captive platforms have lowered access barriers for companies with annual premium spending between USD 250,000 and USD 1 million. NFP established a property and casualty group captive practice in March 2026 through its acquisition of Trinity Risk Advisors. The move responded to mid-market demand and added group captive capability to NFP’s existing single-parent and segregated-cell consulting activity. The captive insurance market is becoming more accessible when companies can join group or cell structures before committing capital to a standalone entity and developing a full internal captive governance capability.
Geography Analysis
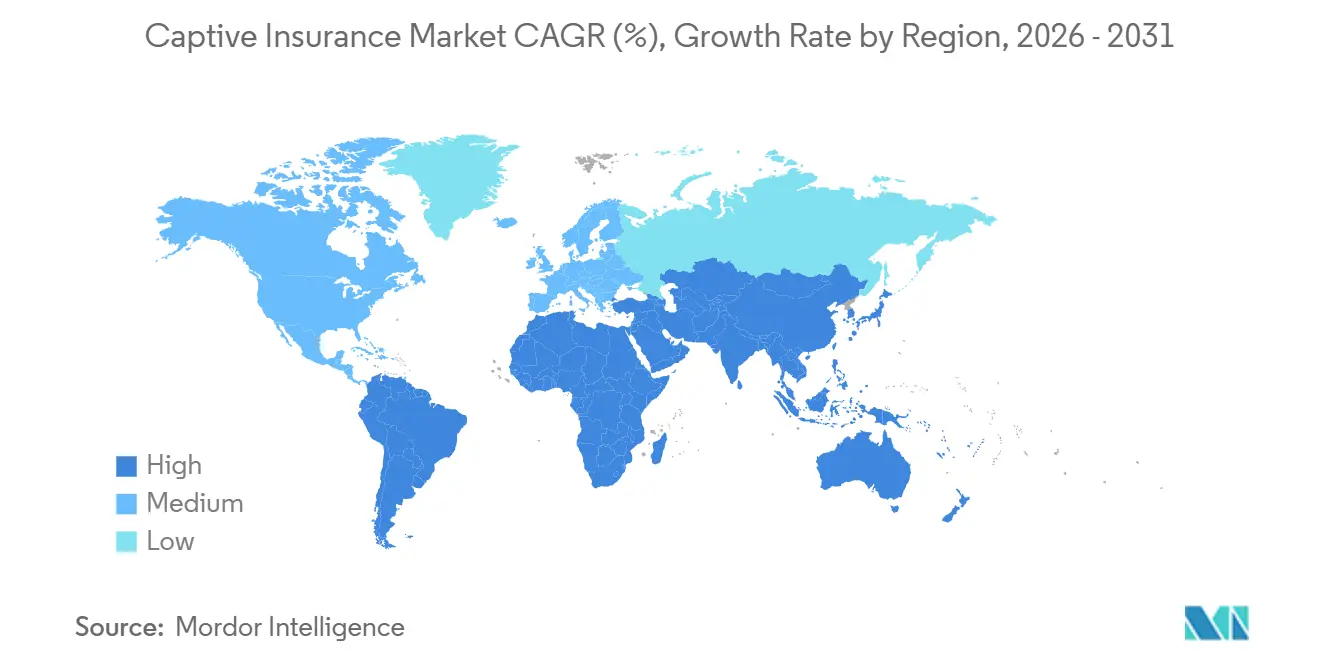
North America retained 75.4% share of the global captive insurance market in 2025. The United States has the largest and most established domicile infrastructure, including Vermont, South Dakota, Utah, and Tennessee, which provide different regulatory options for companies considering where to establish a captive. Vermont’s new formations during the first half of 2025 exceeded its full-year 2024 total. Captive gross written premium across 31 North American domiciles increased from USD 94.3 billion in 2021 to USD 118.5 billion in 2025. Canada also provides a complementary option through Alberta’s captive regime, which took effect in July 2022 and now hosts 45 licensed captives under a regulatory framework intended to support captive growth.
Asia-Pacific is the fastest-growing region, with a projected CAGR of 8.5% through 2031. Asian parent companies owned only 5% to 6% of global captives, despite the region’s contribution to global economic activity. Natural disasters caused USD 65 billion in economic losses across Asia during 2025, and more than 90% of those losses were uninsured. Singapore is consulting on a protected cell company framework that is targeted for implementation in 2028. China, India, and South Korea represent major opportunities as companies expand internationally and seek risk-financing options that local commercial insurance capacity does not fully provide for complex corporate exposures.
Europe represents the second-largest captive insurance market by global premium after North America, supported by several established domiciles and by demand from companies with complex cross-border operations. Luxembourg, Ireland, the Netherlands, and the United Kingdom are leading European domiciles, offering established locations for captive owners that need to manage insurance and reinsurance arrangements within a cross-border operating model. France’s captive population rose from 6 to 23 by 2026 after captive-focused tax and accounting legislation was enacted in 2023. South America is supported by Brazilian and Argentine industrial and financial groups. The Middle East and Africa remain at an earlier stage, with the United Arab Emirates and South Africa seeking to develop domicile roles for regional multinational companies.

Competitive Landscape
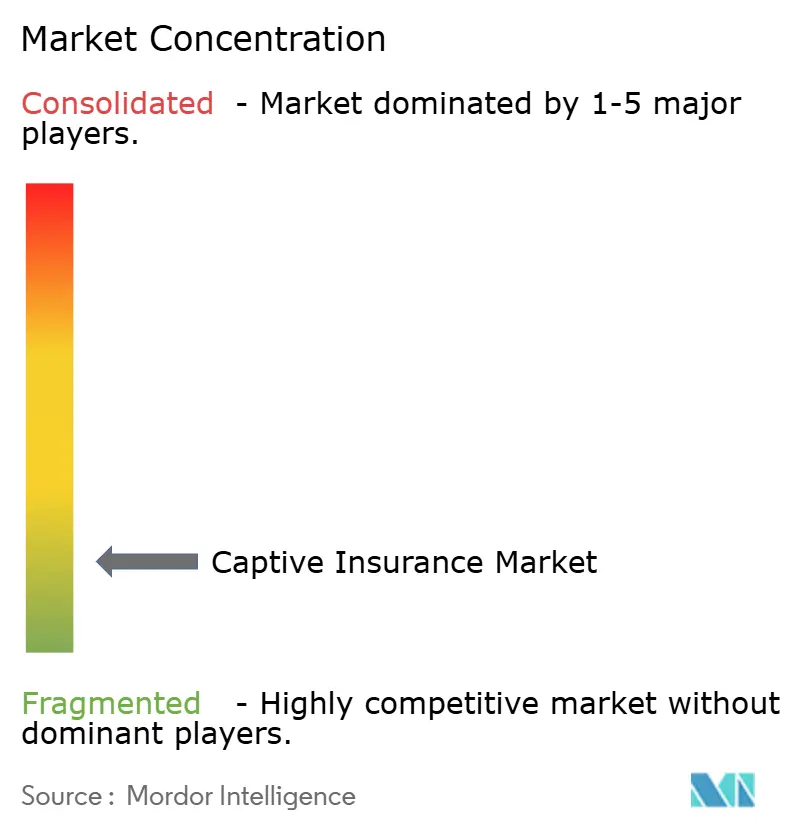
The captive insurance market is fragmented. Marsh Captive Solutions, Aon Insurance Managers, and Willis Towers Watson manage a substantial share of global premium volume. Marsh managed USD 79.1 billion in gross written premium across 1,500 captives during 2025. Its position is supported by global fronting networks, reinsurance relationships, and proprietary data platforms, which help large captive managers coordinate underwriting, program administration, and capital arrangements for clients operating across several risk classes. Strategic Risk Solutions, Artex Risk Solutions, Hylant Global Captive Solutions, Captive Resources, and USA Risk Group compete through sector knowledge and service models aimed below the Fortune 500 tier.
Large insurance groups have used acquisitions to add regulatory and mid-market captive management capability. NFP acquired Trinity Risk Advisors in March 2026 and created a property and casualty group captive practice within Aon’s broker network. Gallagher Re proposed shared-limit structures that combine cyber tail risk with uncorrelated property catastrophe exposures. The structure was designed to lower rates online for tail protection. DICEUS partnered with the Vermont Captive Insurance Association in June 2026 to provide members with technology covering policy administration, financials, claims management, reinsurance accounting, and compliance reporting.
Technology is becoming a clearer area of competition among captive service providers, particularly where managers seek to improve the timeliness and consistency of administration, financial reporting, and compliance work. Hartwell selected INTX Insurance Software, while the DICEUS partnership focused on digital tools for captive managers. These initiatives address policy administration, reinsurance accounting, and real-time solvency monitoring. Specialist managers continue to compete where clients need industry-specific knowledge or lower-cost structures that reflect the requirements of smaller companies and specialized risk programs, rather than the broad platform services offered by larger global managers. The mix of large global managers and specialist providers is consistent with a moderately concentrated competitive environment in the captive insurance market, because leadership in premium management coexists with active competition in mid-market and specialized client segments where service depth, pricing, and knowledge of particular coverage lines can influence provider selection.
Captive Insurance Industry Leaders
Aon plc
Marsh McLennan
Strategic Risk Solutions
Willis Towers Watson plc
American International Group, Inc.
- *Disclaimer: Major Players sorted in no particular order

Recent Industry Developments
- July 2026: The Monetary Authority of Singapore released a consultation paper proposing a Protected Cell Company legislative framework for captive insurance, insurance-linked securities, and sovereign risk pools. The framework is targeted for implementation in 2028. Natural disasters caused USD 65 billion in economic losses across Asia during 2025, and more than 90% of those losses were uninsured, underscoring the insurance gap addressed by the proposal.
- June 2026: DICEUS partnered with the Vermont Captive Insurance Association as an official technology partner. The arrangement gave the association’s 400+ member organizations access to a captive management platform for policy administration, financials, claims management, reinsurance accounting, and compliance reporting. It also supports real-time reporting needs for captive managers and their client organizations.
- May 2026: Iowa Governor Kim Reynolds signed H.F. 2766 on May 15, 2026. The law established a new subchapter for life captive reinsurance companies, introduced a tax waiver for redomestications, and expanded permitted special-purpose captive structures. The changes took effect on July 1, 2026.
- March 2026: NFP, an Aon company, acquired Trinity Risk Advisors to launch a property and casualty group captive practice. The practice complemented NFP’s existing single-parent and segregated-cell captive consulting activity in Burlington, Vermont. Trinity’s founder became managing director of the new practice.


Global Captive Insurance Market Report Scope
| Pure/Single-Parent Captives |
| Group Captives |
| Association Captives |
| Risk Retention Groups (RRGs) |
| Sponsored/Cell Captive Cores |
| Other Limited-Purpose Captive Structures |
| Property | |
| General, Products and Excess/Umbrella Liability | |
| Workers’ Compensation and Employers’ Liability | |
| Commercial Auto and Fleet | |
| Professional Liability | Medical Professional/Malpractice |
| Other Professional Liability | |
| Employee Benefits and Medical Stop-Loss | |
| Cyber | |
| Specialty | Marine, Aviation and Transport |
| Energy, Environmental and Pollution | |
| Credit, Surety and Political Risk | |
| Warranty, Residual Value and Other Specialty | |
| Parametric and Other Structured/ART Covers |
| Industrial, Manufacturing and Materials |
| Energy, Utilities, Mining and Resources |
| Construction and Real Estate |
| Transportation and Logistics |
| Retail, Wholesale and Consumer |
| Technology, Media and Telecommunications |
| Financial Institutions |
| Healthcare and Life Sciences |
| Professional and Business Services |
| Public Sector, Education and Social/Nonprofit Institutions |
| Large/Multinational Enterprises |
| Mid-Market Enterprises |
| Small and Micro Enterprises |
| North America | United States |
| Canada | |
| Mexico | |
| South America | Brazil |
| Argentina | |
| Rest of South America | |
| Europe | United Kingdom |
| Germany | |
| France | |
| Italy | |
| Spain | |
| Rest of Europe | |
| Asia-Pacific | China |
| Japan | |
| India | |
| South Korea | |
| Australia | |
| Indonesia | |
| Thailand | |
| Malaysia | |
| Singapore | |
| Vietnam | |
| Rest of Asia-Pacific | |
| Middle East and Africa | Saudi Arabia |
| United Arab Emirates | |
| Turkey | |
| South Africa | |
| Egypt | |
| Rest of Middle East and Africa |
| By Captive Core Structure | Pure/Single-Parent Captives | |
| Group Captives | ||
| Association Captives | ||
| Risk Retention Groups (RRGs) | ||
| Sponsored/Cell Captive Cores | ||
| Other Limited-Purpose Captive Structures | ||
| By Coverage/Line Written | Property | |
| General, Products and Excess/Umbrella Liability | ||
| Workers’ Compensation and Employers’ Liability | ||
| Commercial Auto and Fleet | ||
| Professional Liability | Medical Professional/Malpractice | |
| Other Professional Liability | ||
| Employee Benefits and Medical Stop-Loss | ||
| Cyber | ||
| Specialty | Marine, Aviation and Transport | |
| Energy, Environmental and Pollution | ||
| Credit, Surety and Political Risk | ||
| Warranty, Residual Value and Other Specialty | ||
| Parametric and Other Structured/ART Covers | ||
| By Parent/Insured Industry | Industrial, Manufacturing and Materials | |
| Energy, Utilities, Mining and Resources | ||
| Construction and Real Estate | ||
| Transportation and Logistics | ||
| Retail, Wholesale and Consumer | ||
| Technology, Media and Telecommunications | ||
| Financial Institutions | ||
| Healthcare and Life Sciences | ||
| Professional and Business Services | ||
| Public Sector, Education and Social/Nonprofit Institutions | ||
| By Parent Scale | Large/Multinational Enterprises | |
| Mid-Market Enterprises | ||
| Small and Micro Enterprises | ||
| By Geography | North America | United States |
| Canada | ||
| Mexico | ||
| South America | Brazil | |
| Argentina | ||
| Rest of South America | ||
| Europe | United Kingdom | |
| Germany | ||
| France | ||
| Italy | ||
| Spain | ||
| Rest of Europe | ||
| Asia-Pacific | China | |
| Japan | ||
| India | ||
| South Korea | ||
| Australia | ||
| Indonesia | ||
| Thailand | ||
| Malaysia | ||
| Singapore | ||
| Vietnam | ||
| Rest of Asia-Pacific | ||
| Middle East and Africa | Saudi Arabia | |
| United Arab Emirates | ||
| Turkey | ||
| South Africa | ||
| Egypt | ||
| Rest of Middle East and Africa | ||


Key Questions Answered in the Report
What is driving captive insurance adoption?
Higher liability costs, capacity constraints, cyber exposure, and employee-benefit risks are increasing interest in risk retention structures. Captives can also give companies more direct control over retained risks, related funding decisions, investment income on reserves, and the use of reinsurance to manage loss volatility.
How large is the captive insurance market in 2026?
The captive insurance market was valued at USD 258.2 billion in 2026 and is projected to reach USD 332.7 billion by 2031. The forecast represents a CAGR of 5.2% between 2026 and 2031, as companies continue to use captives for a broader range of liability, specialty, property, and employee-benefit exposures.
Which captive structure has the largest share?
Pure and single-parent captives held 64.7% share in 2025 because they offer direct governance and underwriting control. These structures also allow large parents to retain investment income on reserves and coordinate risk financing across several coverage lines, domiciles, and operating entities.
Which coverage line is growing fastest in captive programs?
Cyber is projected to grow at a 10.2% CAGR through 2031, reflecting greater corporate use of captives for cyber risk retention. The growth follows ongoing concerns around restrictive commercial coverage terms and exclusions, as well as cyber exposures that may require customized limits, retentions, and reinsurance support.
Which region is growing fastest for captive insurance?
Asia-Pacific is projected to grow at an 8.5% CAGR through 2031, supported by underinsurance and proposed protected cell company rules in Singapore. The region also has significant potential as more companies develop international operations, assess natural catastrophe exposure, and seek alternatives to local commercial coverage constraints.
Why are mid-market companies using captive structures?
Group captives, cell structures, and rent-a-captive platforms can lower entry barriers for companies with annual premium spending from USD 250,000 to USD 1 million. These alternatives can reduce the cost and capital burden associated with standalone captive formation, while allowing participants to access program administration, governance support, and shared reinsurance purchasing arrangements.
Page last updated on:





