Global Cannabis Testing Market Size and Share
Market Overview
| Study Period | 2020 - 2031 |
|---|---|
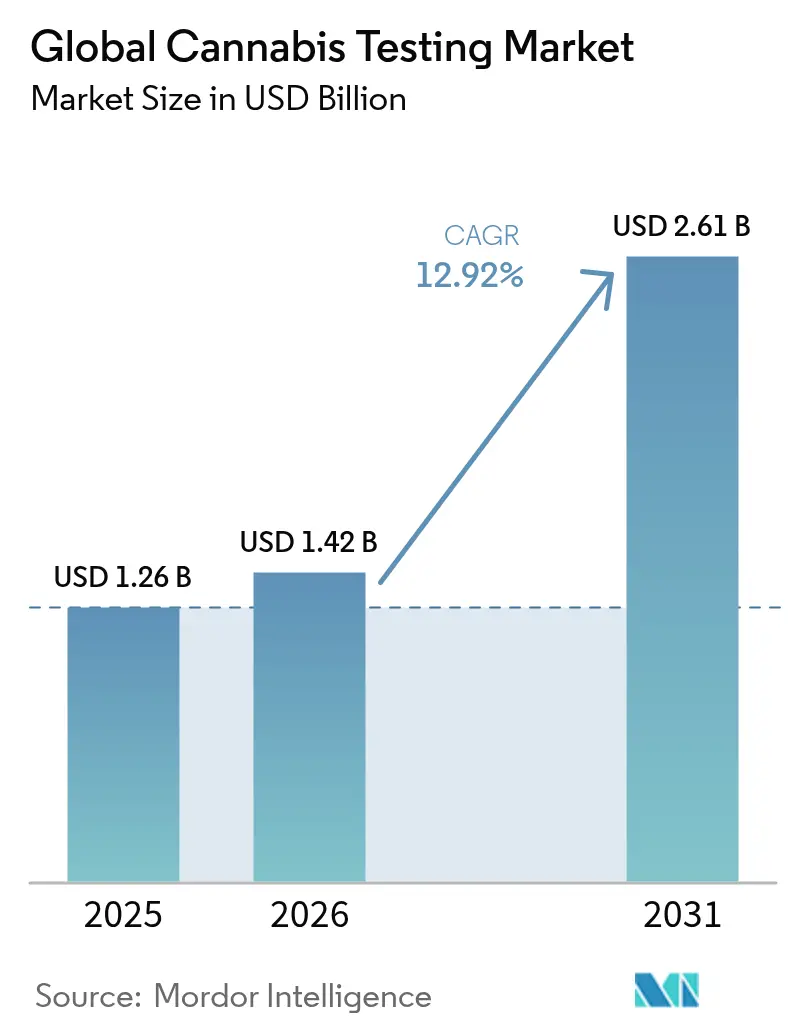
| Market Size (2026) | USD 1.42 Billion |
| Market Size (2031) | USD 2.61 Billion |
| Growth Rate (2026 - 2031) | 12.92% CAGR |
| Fastest Growing Market | Asia Pacific |
| Largest Market | North America |
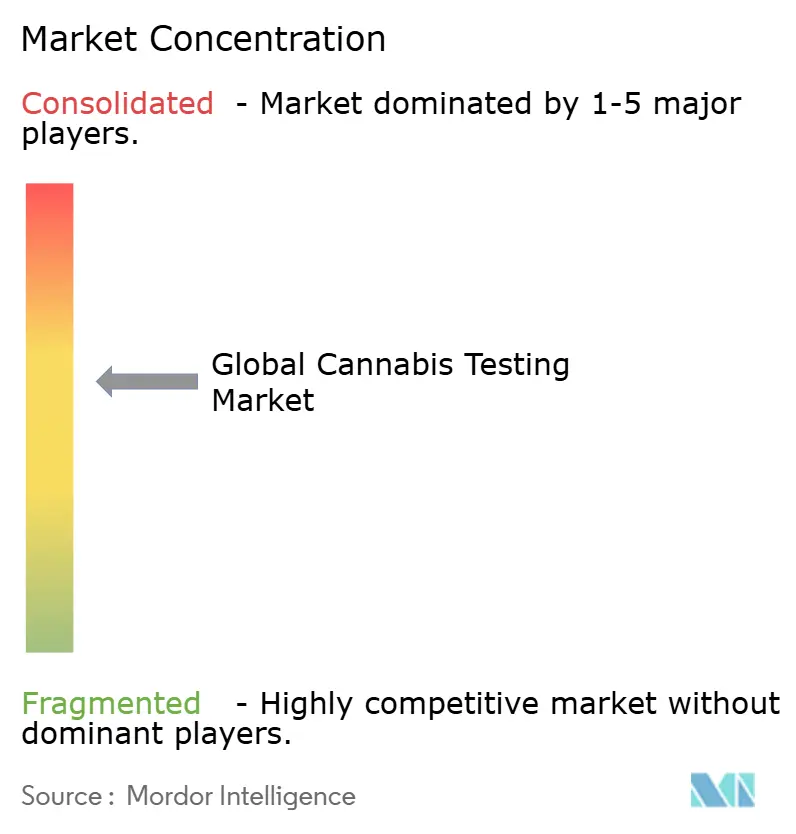
| Market Concentration | Medium |
Major Players *Disclaimer: Major Players sorted in no particular order Image © Mordor Intelligence. Reuse requires attribution under CC BY 4.0. | |
Global Cannabis Testing Market Analysis by Mordor Intelligence
The cannabis testing market size is expected to grow from USD 1.26 billion in 2025 to USD 1.42 billion in 2026 and is forecast to reach USD 2.61 billion by 2031 at 12.92% CAGR over 2026-2031. Sustained legalization momentum, mandatory quality-and-safety protocols, and rising pharmaceutical‐grade requirements keep demand strong while forcing laboratories to upgrade analytical depth and data traceability. Laboratories able to meet multi-jurisdictional standards secure early-mover gains, particularly in Europe, where the July 2024 European Pharmacopoeia monographs set standard contaminant limits and methods. Strategic mergers such as the SC Laboratories–Agricor–Botanacor combination signal an era of scale seeking, even as “lab shopping” scandals pressure regulators to tighten oversight. Emerging opportunities are most visible in Asia Pacific, where Thailand and Australia refine medical cannabis laws, while North America retains absolute leadership despite intensified license reviews.
Key Report Takeaways
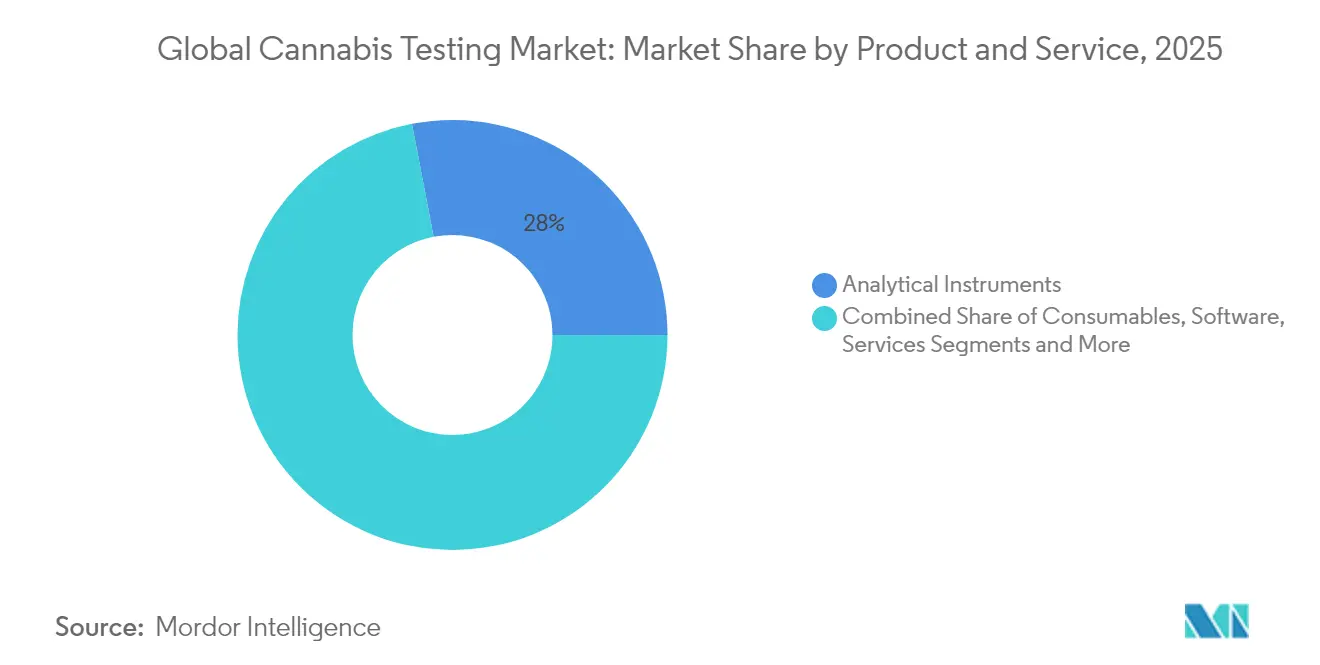
- By product category, Analytical Instruments led with 28.02% revenue share in 2025; Software is projected to expand at a 15.19% CAGR through 2031.
- By testing type, Potency Testing accounted for 22.05% of the cannabis testing market share in 2025; Terpene Profiling is advancing at a 14.39% CAGR through 2031.
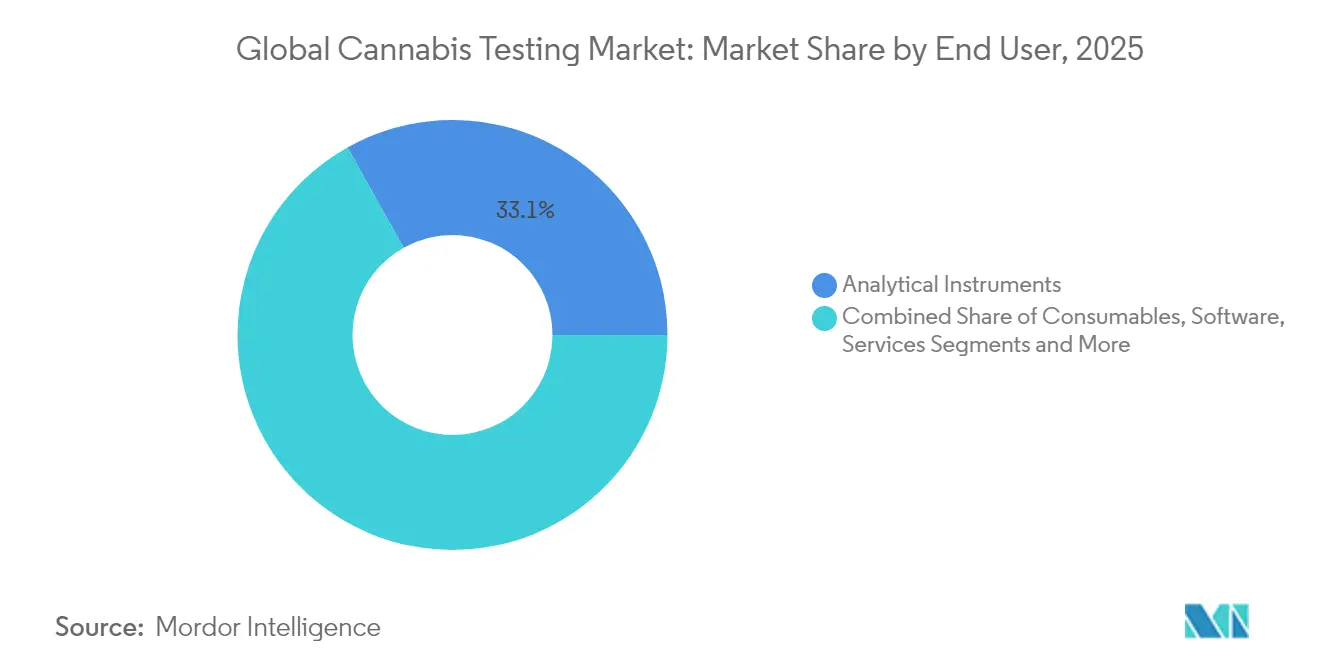
- By end user, Independent Testing Laboratories held 33.12% share of the cannabis testing market size in 2025, while Pharmaceutical & Research Institutes post the fastest CAGR at 13.33% to 2031.
- By geography, North America dominated with 28.15% revenue share in 2025; Asia Pacific is forecast to grow at 11.92% CAGR between 2026-2031
Note: Market size and forecast figures in this report are generated using Mordor Intelligence’s proprietary estimation framework, updated with the latest available data and insights as of 2026.
Global Cannabis Testing Market Trends and Insights
Drivers Impact Analysis*
| Driver | (~) % Impact on CAGR Forecast | Geographic Relevance | Impact Timeline |
|---|---|---|---|
| Legalization of Cannabis Wave Across Few Countries | +2.80% | Global, with concentration in North America & Europe | Medium term (2-4 years) |
| Mandatory Quality-&-Safety Compliance Testing In All Regulated Markets | +3.20% | Global | Short term (≤ 2 years) |
| Growing R&D Spend On Cannabinoid-Based Pharmaceuticals | +1.90% | North America & EU, expanding to APAC | Long term (≥ 4 years) |
| Proliferation Of Contract Testing Laboratories In Emerging LATAM & APAC | +1.70% | LATAM & APAC core, spill-over to MEA | Medium term (2-4 years) |
| Premiumization: Minor-Cannabinoid & Terpene Differentiation Needs | +1.40% | North America & EU premium markets | Medium term (2-4 years) |
| Complex Edible/Beverage Matrices Requiring Multi-Residue Methods | +1.20% | Global, with early adoption in mature markets | Short term (≤ 2 years) |
| Source: Mordor Intelligence | |||
Legalization of Cannabis Wave Across Few Countries
Germany’s Cannabis Act in 2024 created the first G-20 adult-use blueprint, prompting other EU members to review prohibition-era rules.[1]German Bundestag, “Cannabisgesetz 2024,” bundestag.de Maryland’s 2025 law permitting on-site consumption lounges mandates full-panel testing for lounge sales, opening a secondary laboratory market. The DEA proposal to move cannabis to Schedule III would remove the federal–state conflict and may unify laboratory standards once hearings conclude in 2025. Thailand’s medical framework positions Bangkok as an Asia Pacific testing hub as regional regulators benchmark its protocols.
Mandatory Quality-&-Safety Compliance Testing In All Regulated Markets
New Jersey’s 2025 rules make a Certificate of Analysis a consumer-facing document listing cannabinoids, contaminants, and water activity.[2]New Jersey Cannabis Regulatory Commission, “Laboratory Testing Guidance 2025,” nj.gov Massachusetts expanded safety panels to include new pesticide classes in 2025, rewarding labs with LC-MS/MS capability. USDA requires hemp labs to register with the DEA by 31 December 2025, foreshadowing a federal gatekeeper role for cannabis once rescheduling clears. Canada raised micro-class production ceilings in March 2025 while keeping full testing, illustrating how mature markets cut red tape without reducing safety.
Growing R&D Spend On Cannabinoid-Based Pharmaceuticals
FDA-aligned inhaler projects, such as Rapid Therapeutic Science Laboratories, require stability, dose uniformity, and extractable leachables studies beyond the scope of normal cannabis panels. Brazil’s ANVISA demands pharmaceutical-quality validation for CBD oral solutions, spurring outsourcing of chromatographic and microbiological assays.[3]Rodrigo P. Piochi, “Medicinal Cannabis in Brazil: Regulatory Advances and Analytical Challenges,” Química Nova, quimicanova.sbq.org.br Raman microscopy coupled with AI now delivers 99.83% cannabinoid classification accuracy, shortening turnaround and raising the bar for potency-plus-profile tests.
Proliferation Of Contract Testing Laboratories In Emerging LATAM & APAC
ONAC accreditation prepares Colombian labs to service regional exports once quota hurdles ease, yet revenue remains muted until customs simplification arrives. Australia’s Therapeutic Goods Administration proposes aligning import and domestic GMP for medicinal cannabis, giving national labs a regional advantage. Hong Kong’s zero-THC mandate on CBD cosmetics forces high-resolution mass spectrometry deployment, a capability few regional labs currently hold.
Restraints Impact Analysis*
| Restraint | (~) % Impact on CAGR Forecast | Geographic Relevance | Impact Timeline |
|---|---|---|---|
| High Capital & Operating Cost Of Advanced Analytical Platforms | -1.80% | Global, with higher impact in emerging markets | Short term (≤ 2 years) |
| Fragmented Global Regulatory Standards Cause Result Variability | -2.10% | Global, with concentration in multi-jurisdictional operators | Medium term (2-4 years) |
| Shortage Of Skilled Analysts & Reference Standards | -1.30% | Global, with acute impact in APAC & LATAM | Medium term (2-4 years) |
| "Lab-Shopping" Scandals Eroding Data Credibility | -1.60% | North America & emerging regulated markets | Short term (≤ 2 years) |
| Source: Mordor Intelligence | |||
High Capital & Operating Cost Of Advanced Analytical Platforms
Triple quadrupole LC-MS/MS units optimized for 200+ pesticides can exceed USD 450,000, limiting adoption in start-ups. A ballistic GC-MS reducing terpene run time to six minutes still demands skilled analysts and custom gases that smaller laboratories cannot absorb. A full cannabis-specific LIMS averages USD 100,000 for licensing and validation, adding to cash burn before revenue scales.
Fragmented Global Regulatory Standards Cause Result Variability
Each US state sets its own action limits, so a California-compliant edible can fail in Oregon, forcing multi-state operators to run duplicate panels. Up to 30% of labs inflated THC in a 2024 California audit, prompting reference methods and proficiency testing by the Department of Cannabis Control. The EU caps industrial hemp THC at 0.2%, while Australia allows 1%, compelling transnational labs to maintain multiple SOPs.
*Our forecasts treat driver/restraint impacts as directional, not additive. The impact forecasts reflect baseline growth, mix effects, and variable interactions.
Segment Analysis
By Product and Service: Instruments Drive Infrastructure Investment
Analytical Instruments dominated the cannabis testing market in 2025 with 28.02% revenue share, reflecting heavy expenditures on LC-MS/MS, GC-MS, and ICP-MS systems needed for multiresidue panels. Consumables scale proportionally with test volume, securing predictable revenues. Software is projected to grow at a 15.19% CAGR to 2031 as laboratories automate chain-of-custody and integrate AI-based chromatogram review. LC-APCI-MS/MS that quantifies both terpenes and cannabinoids in a single injection demonstrates why software capable of multivariate data interpretation is now imperative.
Instruments account for the largest capital slice, but services capture a rising share as multi-jurisdictional operators outsource validation and method transfer. SaaS LIMS modules embedded with regulatory change alerts help laboratories keep SOPs current, reducing non-conformance risk. Cloud-hosted platforms also enable remote audit, a core requirement for pharmaceutical sponsors.


By Testing Type: Potency Testing Dominance Challenged by Specialization
Potency Testing held 22.05% of the cannabis testing market share in 2025, remaining compulsory in every regulated jurisdiction. Yet specialization is accelerating. Terpene Profiling, growing at 14.39% CAGR, benefits from brands marketing “effect-based” SKUs whose sensory claims hinge on validated terpene ratios. Residual Solvent and Pesticide Screening expand as extraction technologies diversify and as governments tighten food safety alignment. The National Institute of Justice validated DART-HRMS for rapid THC characterization, indicating future throughput gains for law-enforcement seizures and possibly commercial labs.
Minor cannabinoid panels covering CBG, CBC, and CBDV emerge as differentiators in premium SKUs. Water activity, microbial enumeration, and mycotoxin testing become critical for edibles and inhalables, aligning cannabis test menus with pharmaceutical and food codes.
By End User: Independent Labs Face Pharmaceutical Competition
Independent Testing Laboratories captured 33.12% share of the cannabis testing market size in 2025 and remains the backbone for compliance certificates. However, Pharmaceutical & Research Institutes outpace the field at a 13.33% CAGR as inhalers, transdermals, and nano-emulsion drinks demand cGMP validation. In-house producer labs grow but face conflict-of-interest scrutiny. Vertical integration cases, such as Aurora Cannabis acquiring Anandia Labs, show producers seeking analytical intellectual property alongside compliance cost savings. Academic centers, such as the University of Mississippi’s cannabis program, continue to pioneer reference analytics that diffuse into the commercial sector.
Geography Analysis
North America contributed 28.15% to global revenue in 2025 and maintains leadership through well-developed regulatory regimes. California revoked four lab licenses between 2024-2025, signaling tougher oversight that favors high-quality operators. Canada raised micro-producer thresholds in 2025 yet retained full mandatory panels, encouraging throughput growth within existing labs. The DEA rescheduling debate continues to cloud interstate commerce, but laboratories prepare SOP harmonization ahead of potential federal standardization.
Europe scaled quickly after Germany legalized non-medical adult use in 2024. The European Pharmacopoeia monographs standardize test limits for flower and CBD products, harmonizing methods and increasing equipment spend. France, Italy, and Spain expand medical programs, each requiring EU-GMP compliance that mirrors pharmaceutical quality norms. Laboratories able to certify products for multiple EU tender markets gain pricing power.
Asia Pacific is the fastest-growing geography at a projected 11.92% CAGR from 2026-2031. Thailand’s Government Pharmaceutical Organization manufactures medical oils and sets domestic analytic benchmarks adopted by neighbors. Australia’s TGA consults on GMP harmonization that could allow domestic labs to certify imports for ASEAN markets. Hong Kong’s zero-THC rule on CBD mandates high-resolution mass spectrometry, opening niche demand for ultra-low limit assays. Conversely, South Korea retains strict narcotics classification for CBD, restricting lab investment.


Competitive Landscape
The cannabis testing market remains fragmented; the top five networks hold far below 30% of global revenue, keeping entry opportunities alive. Competitive vectors revolve around analytical speed, breadth of contaminant panels, and data integrity. SC Laboratories combined with Agricor and Botanacor to create a multi-state footprint able to service large multistate operators while maintaining ISO 17025 accreditation. Eurofins Scientific’s historical acquisition strategy in broader analytical services suggests that once federal clarity emerges, similar roll-up plays may advance in cannabis testing.
Technology adoption produces step changes. High-resolution accurate-mass instruments halve turnaround time for metabolite profiling. AI-assisted chromatogram review lowers labor cost and reduces reporting errors. Labs marketing same-day terpene plus potency results command premium fees. Meanwhile, regulatory scrutiny of “lab shopping” forces a race to audit-proof LIMS and proficiency testing participation.
Regional leaders expand through joint ventures rather than outright purchase to navigate license caps. Canadian lab Valens entered Mexico via a service agreement, leveraging GMP credentials without ownership, illustrating the workaround to foreign equity limits.
Global Cannabis Testing Industry Leaders
Shimadzu Scientific Instruments.
Merck KGaA (Sigma Aldrich)
Restek Corporation
PerkinElmer Inc.
Agilent Technologies, Inc
- *Disclaimer: Major Players sorted in no particular order

Recent Industry Developments
- March 2025: Canada amended the Cannabis Act to raise micro-class thresholds while keeping all test requirements.
- February 2025: Allegations of data falsification surfaced in New York, prompting state audits of testing labs.
- January 2025: New Jersey issued laboratory guidance mandating Certificates of Analysis for retail display.


Research Methodology Framework and Report Scope
Market Definitions and Key Coverage
Our study defines the cannabis testing market as the revenue earned from analytical instruments, consumables, software, and third-party laboratory services used to verify potency, contaminants, and overall quality of marijuana or hemp products before they reach patients or adult-use consumers.
Scope exclusion: in-house compliance testing performed by vertically integrated cultivators solely for process control is not counted.
Segmentation Overview
- By Product and Service
- Analytical Instruments
- Consumables
- Software
- Services
- By Testing Type
- Potency (THC/CBD)
- Terpene Profiling
- Residual Solvent Screening
- Pesticide Screening
- Heavy Metal Analysis
- Mycotoxin & Microbial Testing
- Other Specialized Assays
- By End User
- Independent Testing Laboratories
- Pharmaceutical & Research Institutes
- Other End Users
- By Geography
- North America
- United States
- Canada
- Mexico
- Europe
- Germany
- United Kingdom
- France
- Italy
- Spain
- Rest of Europe
- Asia Pacific
- China
- Japan
- India
- South Korea
- Australia
- Rest of Asia Pacific
- Middle East & Africa
- GCC
- South Africa
- Rest of Middle East & Africa
- South America
- Brazil
- Argentina
- Rest of South America
- North America
Detailed Research Methodology and Data Validation
Primary Research
Our team interviewed independent lab directors across North America and Europe, instrument distributors in Asia-Pacific, and regulators overseeing ISO 17025 accreditation. Discussions clarified true batch-size trends, average sample-turnaround times, and the discount structures that impact realized service revenue.
Desk Research
We began with public regulators such as the US Food & Drug Administration, Health Canada, the European Monitoring Centre for Drugs and Drug Addiction, and state-level cannabis control boards, which publish annual test-volume, failure-rate, and license data. Trade bodies like ASTM's D37 committee, the American Herbal Products Association, and the Cannabis Industry Alliance supply guidance on sampling frequencies and cost benchmarks. Company 10-Ks, S-1 filings, and investor decks help us link test demand to extraction output, while news feeds from Dow Jones Factiva and financials in D&B Hoovers add pricing and capacity insights. These references illustrate, though do not exhaust, the wide desk-research base we, as Mordor analysts, accessed.
Market-Sizing & Forecasting
A top-down model starts with legal cannabis production volumes, cross-checked against import-export and state seed-to-sale registries; these volumes are multiplied by compulsory test counts per kilogram to derive potential samples, which are then valued using blended average selling prices reported in interviews. We corroborate totals through selective bottom-up roll-ups of major laboratory revenues and equipment shipments. Key variables include: 1) number of active cultivation licenses, 2) mandatory test panels per lot, 3) median panel fee, 4) THC-limit change frequency, and 5) instrument replacement cycles. Multivariate regression, fed by five-year histories of legalization milestones and patient-card growth, underpins our 2025-2030 forecast, while scenario analysis adjusts for federal rescheduling probabilities. Where bottom-up data were thin, regional ASPs were flexed within interview-validated ranges before final alignment.
Data Validation & Update Cycle
Outputs pass a three-layer review: automated variance checks, peer analyst scrutiny, and senior sign-off. We re-run the model each year and issue interim refreshes when major policy shifts, such as Germany's 2024 adult-use law, materially alter test demand. Before release, an analyst updates every macro driver so clients receive the freshest view.
Why Our Cannabis Testing Baseline Is Reliable
Published figures often diverge because firms pick uneven scopes, apply flat global ASPs, or neglect gray-market volumes. We anchor our baseline on regulated production and verified fee ladders, revisit inputs annually, and, unlike other publishers, adjust currency and inflation at the country level before aggregation.
Benchmark comparison
| Market Size | Anonymized source | Primary gap driver |
|---|---|---|
| USD 1.26 billion (2025) | Mordor Intelligence | |
| USD 1.80 billion (2024) | Global Consultancy A | Excludes software revenue; applies single ASP across regions |
| USD 2.08 billion (2024) | Trade Journal B | Counts in-house QA labs and assumes uniform 17% CAGR without policy breakpoints |
These comparisons show that our disciplined license-based volume build-up and region-specific pricing deliver a balanced, transparent baseline that decision-makers can confidently adopt.


Key Questions Answered in the Report
How big is the Global Cannabis Testing Market?
The Global Cannabis Testing Market size is expected to reach USD 1.42 billion in 2026 and grow at a CAGR of 12.92% to reach USD 2.61 billion by 2031.
What is the current Global Cannabis Testing Market size?
In 2026, the Global Cannabis Testing Market size is expected to reach USD 1.42 billion.
Who are the key players in Global Cannabis Testing Market?
Shimadzu Scientific Instruments., Merck KGaA (Sigma Aldrich), Restek Corporation, PerkinElmer Inc. and Agilent Technologies, Inc are the major companies operating in the Global Cannabis Testing Market.
Which is the fastest growing region in Global Cannabis Testing Market?
Asia Pacific is estimated to grow at the highest CAGR over the forecast period (2025-2030).
Which region has the biggest share in Global Cannabis Testing Market?
In 2025, the North America accounts for the largest market share in Global Cannabis Testing Market.
What years does this Global Cannabis Testing Market cover, and what was the market size in 2025?
In 2025, the Global Cannabis Testing Market size was estimated at USD 1.42 billion. The report covers the Global Cannabis Testing Market historical market size for years: 2019, 2020, 2021, 2022, 2023 and 2024. The report also forecasts the Global Cannabis Testing Market size for years: 2026, 2027, 2028, 2029, 2030 and 2031.
Page last updated on:


