Market Overview
| Study Period | 2019 - 2031 |
|---|---|
| Forecast Data Period | 2026 - 2031 |
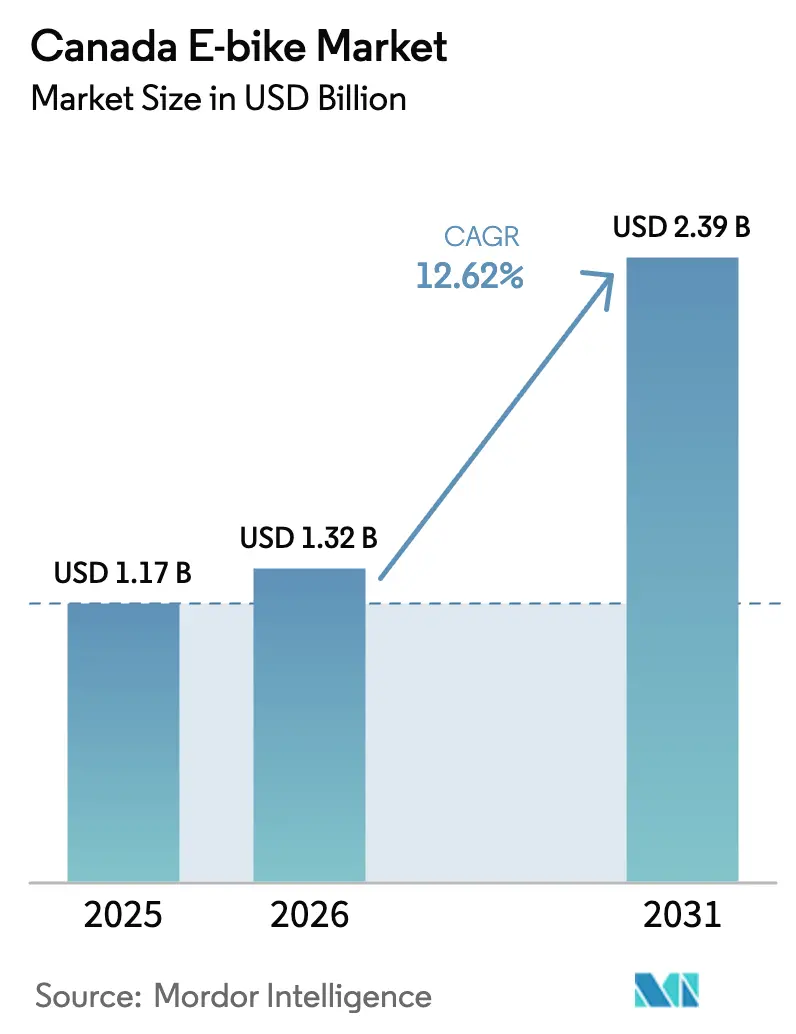
| Base Year Market Size (2025) | USD 1.17 Billion |
| Market Size (2026) | USD 1.32 Billion |
| Market Size (2031) | USD 2.39 Billion |
| Growth Rate (2026 - 2031) | 12.62% CAGR |
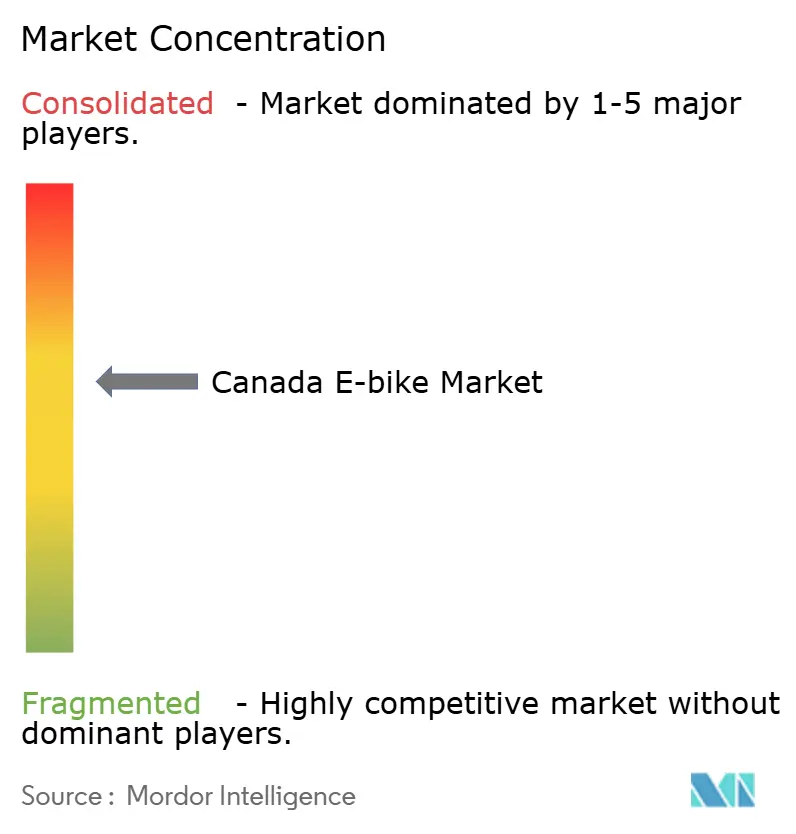
| Market Concentration | Medium |
Major Players*Disclaimer: Major Players sorted in no particular order Image © Mordor Intelligence. Reuse requires attribution under CC BY 4.0. | |
Canada E-bike Market Analysis by Mordor Intelligence
The Canada E-bike Market size is expected to grow from USD 1.17 billion in 2025 to USD 1.32 billion in 2026 and is forecast to reach USD 2.39 billion by 2031 at 12.62% CAGR over 2026-2031. A widening menu of provincial purchase rebates, brisk urban adoption of cargo models, and the steady drop in lithium-ion battery costs are nudging commuters away from cars and toward two-wheel electrified mobility. Brands that can pivot inventories between incentive-rich provinces such as British Columbia and incentive-scarce Ontario are capturing disproportionate sell-through. Large-capacity packs and 500-watt-plus motors are now standard on mainstream models, yet UL-certified battery systems remain a critical differentiator as municipalities tighten fire-safety rules. Meanwhile, direct-to-consumer financing tools such as zero-percent APR programs are lowering the up-front hurdle for premium mid-drive e-bikes, compressing price tiers and accelerating replacement cycles.
Key Report Takeaways
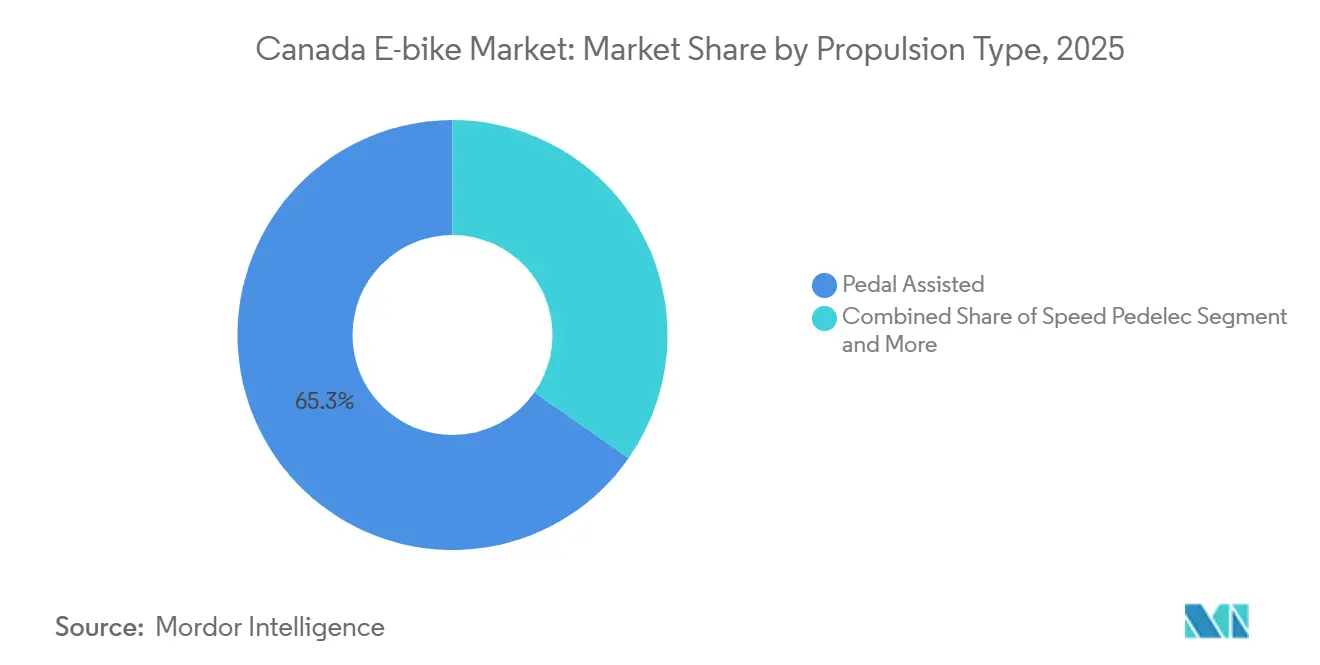
- By propulsion type, pedal-assist configurations held 65.27% of the e-bike market share in Canada in 2025, while speed pedelecs are forecast to expand at a 13.18% CAGR through 2031.
- By application, city/urban riding led with 43.51% revenue share in 2025; cargo/utility models are poised to grow at a 13.41% CAGR to 2031.
- By battery chemistry, lithium-ion packs captured 84.15% of the market share in 2025 and are projected to post the segment-best 13.13% CAGR through 2031.
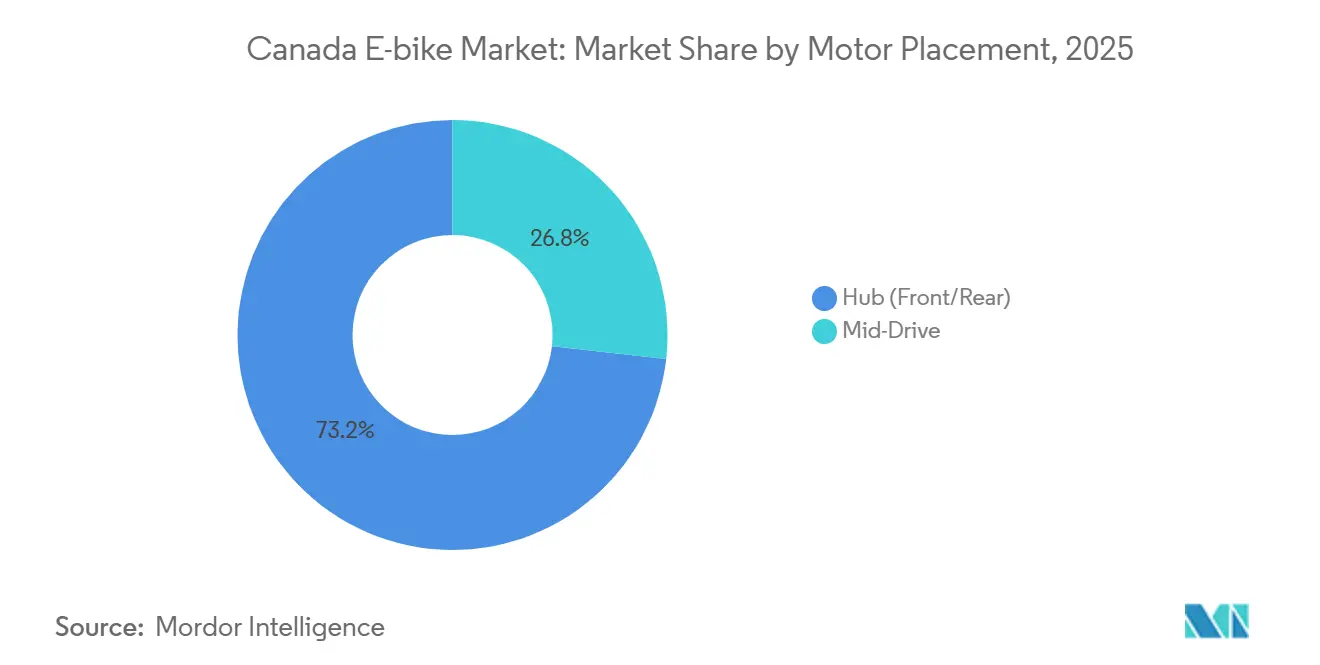
- By motor placement, hub motors retained a 73.22% share in 2025, whereas mid-drive systems are expected to grow at 13.31% through 2031.
- By drive system, chain drives accounted for 67.37% of the market in 2025; belt-drive variants are projected to grow at a 12.98% CAGR through 2031.
- By motor power, sub-250-watt units held 47.81% share in 2025, yet the 501-to-600-watt band should increase at 13.19% through 2031.
- By price band, the USD 3,500–USD 5,999 tier is set to expand at a 13.49% CAGR, overtaking the USD 1,500–USD 2,499 bracket, which led with a 26.17% share in 2025.
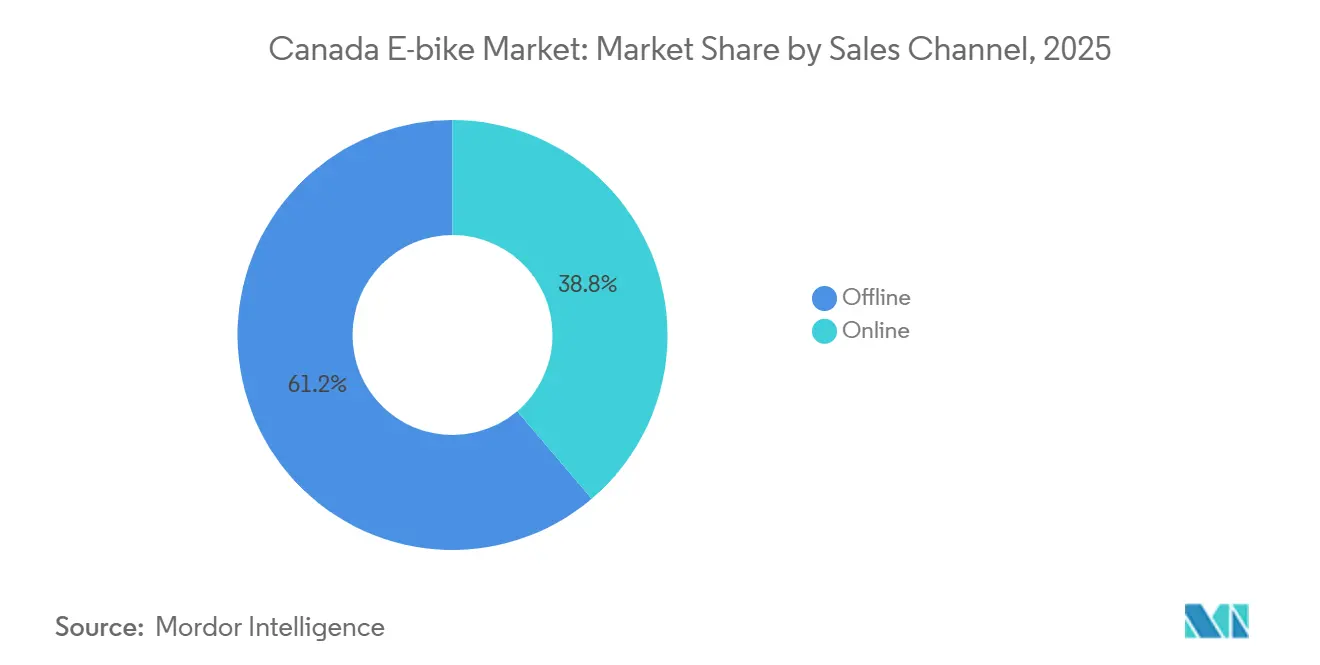
- By sales channel, offline retail accounted for 61.22% of sales in 2025, but online direct-to-consumer sales are forecast to grow by 13.47% through 2031.
- By end use, personal and family riders accounted for 47.78% of 2025 revenue, while commercial delivery fleets are expected to grow at a 13.72% CAGR through 2031.
Note: Market size and forecast figures in this report are generated using Mordor Intelligence’s proprietary estimation framework, updated with the latest available data and insights as of 2026.
Canada E-bike Market Trends and Insights
Drivers Impact Analysis*
| Driver | (~) % Impact on CAGR Forecast | Geographic Relevance | Impact Timeline |
|---|---|---|---|
| Purchase-Rebate Programs | +2.8% | National, with early gains in BC, Nova Scotia, PEI | Short term (≤ 2 years) |
| Declining Lithium-Ion Battery | +2.1% | Global, with Canadian cold-weather applications | Long term (≥ 4 years) |
| Direct-to-consumer E-commerce | +1.9% | National, concentrated in urban centers | Medium term (2-4 years) |
| Product Line-Up Expansion | +1.5% | National, spill-over to rural markets | Medium term (2-4 years) |
| Corporate Micromobility Fleets | +1.4% | Urban centers, Toronto, Vancouver, Montreal | Short term (≤ 2 years) |
| Class-3 Legalization Pilots | +0.8% | Provincial, with Alberta and BC leading | Long term (≥ 4 years) |
| Source: Mordor Intelligence | |||


Government Purchase-Rebate Programs
British Columbia offers residents rebates for standard e-bikes and additional incentives for cargo models[1]“Income-Qualified E-Bike Rebates,”, Government of British Columbia, gov.bc.ca. In contrast, Ontario provides no provincial incentive. This discrepancy compels brands to adjust their product mix and pricing by postal code. With funding windows often closing quickly, manufacturers who consign inventory to dealers can benefit from sudden demand spikes. Additionally, the Yukon provides a rebate for cargo bikes, highlighting the growing emphasis on freight-substitution goals in policy discussions [2]“Good Energy Rebate Program,”, Government of Yukon, yukon.ca.
Declining Lithium-Ion Battery USD/kWh
Pack prices continue to decline, enabling assemblers to integrate larger-capacity batteries without altering retail prices. Extended-range features are now being offered on mid-tier commuter models, narrowing the price gap between entry-level and premium trims. This price reduction diminishes the remaining market share of lead-acid systems and clears the way for lithium iron phosphate packs, which are both safer and have longer cycle life. Municipalities, highlighting the reduced risk of thermal runaway, are leaning towards UL-label preferences in their upcoming safety bylaws.
Growth of Direct-to-Consumer E-Commerce
Rad Power Bikes, a prominent brand, offers fully-featured models priced between USD 1,199 and USD 2,399. These models come equipped with UL-certified batteries and IP-rated wiring harnesses, and are shipped directly to consumers. With the allure of interest-free financing and convenient one-click accessories, mid-tier shoppers are increasingly turning away from traditional brick-and-mortar showrooms. In response, traditional dealers have pivoted, focusing on service-only revenue streams and establishing rental fleets. However, online-first sellers still grapple with challenges, including parts logistics, the intricacies of warranty claims, and elevated return rates.
Product Line-Up Expansion by Global Brands
Global incumbents are slicing their catalogs into more precise sub-segments. For example, Giant's lineup includes city, trekking, and mountain builds, all equipped with Yamaha's SyncDrive mid-motors and EnergyPak batteries with varying capacities. In response, Rad Power Bikes introduces the Radster Trail, featuring high torque and UL-certified SafeShield packs. While quicker launch cycles intensify pressure on dealer inventories, they also ensure that model line-ups remain fresh in a market driven by reviews.
Restraints Impact Analysis*
| Restraint | (~) % Impact on CAGR Forecast | Geographic Relevance | Impact Timeline |
|---|---|---|---|
| Dealer Service-Network Gaps | -1.6% | Rural and secondary urban centers | Medium term (2-4 years) |
| Winter Range Degradation Perception | -1.2% | National, particularly northern regions | Medium term (2-4 years) |
| Fire-Safety Concerns | -0.9% | National, concentrated in multi-unit housing | Short term (≤ 2 years) |
| Import Duties on Chinese Kits | -0.7% | National, affecting budget segments | Long term (≥ 4 years) |
| Source: Mordor Intelligence | |||
Dealer Service-Network Gaps Outside Metros
The four largest metros host the majority of authorized repair centers. With a limited number of dealers nationwide, OHM Electric Bikes has restricted access in Atlantic Canada and northern Ontario. Pedego, which once operated a significant number of outlets, has seen a decline in its franchise count, reflecting economic challenges for small-town stores. Rural buyers, weighing the risk of extended downtime, will likely adjust their purchasing decisions until manufacturers either roll out mobile service vans or widely certify independent mechanics.
Fire-Safety Concerns Around Home Charging
Following lithium-ion incidents in Toronto high-rises, a municipal bylaw was introduced to restrict indoor e-bike charging in shared hallways. Property managers now require certified battery packs, dedicated outlets, or outdoor storage, creating additional challenges for apartment residents. As insurance premiums increase, condo boards are debating whether to implement blanket bans or establish managed charging rooms. Although compliance with UL 2849 standards helps reduce risks, ongoing media coverage continues to heighten public concern. This situation has highlighted a clear divide in urban demand patterns between single-family homeowners with garage space and renters in multi-unit buildings.
*Our forecasts treat driver/restraint impacts as directional, not additive. The impact forecasts reflect baseline growth, mix effects, and variable interactions.
Segment Analysis
By Propulsion Type: Pedal-Assist Dominance Continues
Pedal-assisted models led with 65.27% of 2025 revenue, whereas the speed-pedelec category is forecast to post a 13.18% CAGR between 2026 and 2031. The electric bicycle market in Canada is forecast to grow steadily but cede share as speed-pedelec use cases multiply. Tight 32 km/h limits frustrate suburban commuters who regularly travel through arterial corridors, prompting growing interest in 45 km/h assistance once pilot schemes are introduced.
Municipal trail access policies further entrench pedal-assist popularity: throttle-only Class 2 bikes face restrictions in Toronto’s mixed-use parks. British Columbia’s two-tier light-versus-standard categorization divides the teen and adult markets, which could serve as a blueprint for provinces debating how to treat higher-speed class-3 formats. Should insurance products and helmet rules crystallize, speed-pedelec CAGR may outpace the broader electric bicycle market in Canada through 2031.


By Application Type: Cargo Utility Spurs Commercial Adoption
City/urban e-bikes accounted for 43.51% of sales in 2025; cargo/utility platforms are projected to expand at a 13.41% CAGR through 2031, transforming parcel distribution in dense downtown cores. FedEx, Purolator, and Canada Post continue expanding pilot fleets equipped with insulated cargo boxes and integrated telematics.
Commercial buyers value hourly operating costs as much as environmental gains. Fleet managers in Toronto report up to one-third faster deliveries in curbside-restricted zones versus vans. Municipalities offer preferred curb access and zero-emission delivery zones, reinforcing economics. Recreational trekking, bolstered by better battery range and trail investments, provides a third leg of demand, particularly in Alberta’s mountain parks, where e-bikes open longer routes to casual cyclists.
By Battery Type: Lithium-Ion Remains Unchallenged
Lithium-ion packs dominated with 84.15% share in 2025 and are also the fastest-growing chemistry, advancing at a 13.13% CAGR over 2026-31 on the back of integrated cell-heating pads that maintain voltage in sub-zero weather. Lead-acid persists in entry-level kits imported for hobbyists, but its heavy weight and winter voltage sag keep it niche.
Domestic cathode R&D receives federal and Quebec backing, fostering a local supply chain that could cut lead times and import dependency. Manufacturers standardize on innovative battery management systems with Bluetooth monitoring, letting owners pre-warm packs via smartphone before venturing out on −15 °C mornings. Such upgrades reduce range anxiety and support longer commutes in Ottawa or Calgary winters.
By Motor Placement: Mid-Drive Units Gain Loyalists
Front- and rear-hub units commanded 73.22% share in 2025, yet mid-drive systems are set to grow the quickest, registering a 13.31% CAGR to 2031 due to improved weight distribution and torque multiplication on snowy inclines. Riders navigating Montreal’s Mont Royal or Vancouver’s hilly West End value this natural handling feel.
Mid-drive reliability has risen as manufacturers add fully sealed housings and cold-rated lubricants. Integration with continuously variable transmissions further reduces cadence spikes when roads turn slick. Cost gaps continue narrowing as global suppliers scale production, nudging commuters toward premium configurations once exclusive to mountain bikes.
By Drive System: Belt Drives Trim Winter Maintenance
Chain drives captured 67.37% of 2025 unit sales, while belt-drive configurations are on track for a 12.98% CAGR during the forecast window, propelled by corrosion resistance to de-icing salts spread on Winnipeg streets. Commuters accept higher up-front costs to avoid monthly lubrication rituals and stained pant legs.
OEMs bundle weather-sealed gearboxes with carbon belts that last 20,000 km between changes. Urban couriers praise silent operation during predawn deliveries, boosting neighborhood acceptance as mid-drive motors standardize belt pulleys, compatibility barriers fall, widening the addressable audience beyond enthusiast circles.
By Motor Power: Mid-Range Wattage Builds Momentum
Sub-250-watt motors accounted for 47.81% of the market in 2025; the 501–600-watt band is expected to log a 13.19% CAGR from 2026 to 2031 as riders in Edmonton and Quebec City upgrade to handle icy headwinds and steep, snow-packed bridges.
Higher wattage pairs with dual-battery setups to preserve range under load. Regulators in Alberta allow 750 W on multi-use paths during Class 3 pilots, legitimizing muscular builds designed for cargo couriers and ski resort staff. Software-limited torque curves restrict acceleration until speed rises, satisfying safety watchdogs while delivering hill-climbing punch.
By Price Band: Rebates Shift Demand to Premium Tiers
The USD 1,500–2,499 tier accounted for 26.17% of 2025 revenue, whereas the USD 3,500–5,999 segment is expected to grow at a 13.49% CAGR through 2031 as provincial rebates offset sticker shock, encouraging upgrades to fat-tire frames and heated battery packs.
Premium shoppers justify investment by calculating fuel savings against winterized car use. Dealers report that customers spend rebates on accessories such as studded tires and bar mitts rather than lowering monthly financing costs. This behavior keeps manufacturer margins healthy while fulfilling broader electrified mobility policy goals.
By Sales Channel: Online Platforms Build Scale
Offline retail delivered a 61.22% share in 2025, but online direct-to-consumer sales are forecast to rise at a 13.47% CAGR over 2026-31. Online direct-to-consumer storefronts, free of significant retail mark-ups, are attracting budget-conscious shoppers in bustling urban centers. Tools like augmented-reality fitting, modular shipping boxes, and pay-over-time checkout options are diminishing the hesitations many had about purchasing without seeing the product first.
Direct-to-consumer firms open regional experience hubs where buyers schedule fittings, ensuring fit accuracy and legal compliance. Logistics partners now classify e-bike batteries under specialized hazmat codes, cutting transit delays to Nunavut and Newfoundland. The hybrid sales model proves resilient, allowing customers to order bespoke color schemes online and collect fully tuned bikes at local pop-ups.
By End Use: Commercial Fleets Reshape Urban Logistics
Personal and family riders generated 47.78% of 2025 volume; commercial delivery fleets are projected to accelerate at a 13.72% CAGR during the outlook period as corporate fleets recognize cost advantages. FedEx expanded e-cargo pilot routes in Toronto and Montreal after pilot data showed 20% faster parcel drop rates downtown versus van routes.
Fleet operators demand data connectivity to monitor battery health in freezing weather and to assign predictive maintenance. Municipal pilot zones that waive parking fees for zero-emission vehicles further boost ROI calculations. Universities and hospitals are joining the trend toward intra-campus transport, ordering cargo trikes with heated compartments for medical samples.
Geography Analysis
Western Canada leads in adoption owing to supportive rebates and milder coastal climates. British Columbia’s Vancouver boasts 246 km of high-comfort bikeways, enabling commuters to replace car trips year-round. The province’s terrain encourages upscale mid-drive purchases, raising average selling prices above the national mean. Ontario remains the most significant provincial market by unit count, given its population size. However, growth trails BC due to limited provincial incentives and patchy infrastructure beyond the Greater Toronto Area.
Quebec positions itself as a battery-innovation hub, coupling Montreal’s 360 km protected-lane network with provincial R&D funds that attract cathode makers. Local winters encourage fat-tire sales and accessories like heated grips, fueling vendor specialization. Atlantic provinces gain momentum through targeted rebates. Nova Scotia covers up to CAD 500 per e-bike, while durable frames suited to briny sea air become selling points in Halifax and Charlottetown.
Prairie provinces display mixed dynamics. Calgary and Edmonton city councils offer municipal vouchers that spur urban uptake, yet vast rural distances and scarce service centers temper wider penetration. Manitoba’s harsh cold pushes riders toward high-capacity packs and belt drives that survive salt exposure. Northern territories remain nascent markets, as extreme temperatures and limited daylight shorten riding seasons, but pilot programs in Whitehorse assess the feasibility of fat-tire commuting on groomed winter paths.
Competitive Landscape
The Canadian e-bike market is moderately concentrated. Global giants like Giant, Trek, and Specialized leverage broad supplier networks and nationwide dealerships. Homegrown brands like Biktrix, Surface 604, ENVO, and OHM capitalize on climate-specific know-how, often designing frames with extra fender clearance for slush buildup. UL 2849 certification became a de facto requirement in 2024, raising compliance costs that smaller importers struggle to bear.
Strategic moves underline the race for winter differentiation. Biktrix promotes a lifetime frame warranty that covers corrosion from road salt, banking on Prairie's reputation to command loyalty. Trek deploys pop-up winter service centers that offer same-day studded tire installations, keeping suburban commuters rolling through blizzards.
Partnerships form another pillar of competition. Surface 604 collaborates with telecom providers to embed LTE trackers, minimizing theft risk in dense Montreal boroughs. ENVO pairs with utility companies to co-market off-peak charging plans, tapping favorable household electricity rates in Ontario. Consolidation surfaced in May 2025 when Chaos Sports acquired Rocky Mountain Bicycles, positioning the new parent to cross-sell premium e-mountain bikes through Rocky’s established dealer lattice.
Canada E-bike Industry Leaders
Accell Fitness North America Inc
Cervélo Cycles Inc.
Cycling Sports Group, Inc.
Dorel Industries Inc.
Giant Manufacturing Co.
- *Disclaimer: Major Players sorted in no particular order

Recent Industry Developments
- June 2025: BCAA's Evolve has been appointed as the new operator for the North Shore E-bike Share Program, a move welcomed by both the City of North Vancouver and the District of North Vancouver. Building on the success of a pilot initiative, the North Shore's e-bike program is set to provide residents and visitors with a convenient, eco-friendly mode of transport for commuting, running errands, or exploring the area.
- May 2025: Chaos Sports Inc. acquired Rocky Mountain Bicycles, expanding its premium outdoor portfolio and leveraging Rocky’s national dealer network for electric product roll-outs.


Canada E-bike Market Report Scope
The Canada e-bike market report is segmented by propulsion type (pedal assisted, speed pedelec, and throttle assisted), application (cargo/utility, city/urban, and trekking/mountain), battery (lead acid, lithium-ion, and others), motor placement (hub and mid-drive), drive system (chain and belt), motor power (<250w to >600w), price band (up to USD 1,000 to above USD 6,000), sales channel (online and offline), and end use (commercial, personal, institutional, and others). The market forecasts in value (USD) and volume (units).
By Propulsion Type
| Pedal Assisted |
| Speed Pedelec |
| Throttle Assisted |
By Application Type
| Cargo/Utility |
| City/Urban |
| Trekking/Mountain |
By Battery Type
| Lead Acid Battery |
| Lithium-ion Battery |
| Others |
By Motor Placement
| Hub (Front/Rear) |
| Mid-Drive |
By Drive Systems
| Chain Drive |
| Belt Drive |
By Motor Power
| Less than 250 W |
| 251-350 W |
| 351-500 W |
| 501-600 W |
| More than 600 W |
By Price Band
| Up to USD 1,000 |
| USD 1,001-1,499 |
| USD 1,500-2,499 |
| USD 2,500-3,499 |
| USD 3,500-5,999 |
| Above USD 6,000 |
By Sales Channel
| Online | |
| Offline | Specialized E-Bike Retailers |
| Traditional Bike Shops | |
| Department Stores & Sporting Goods Chains |
By End Use
| Commercial Delivery | Retail & Goods Delivery |
| Food & Beverage Delivery | |
| Service Providers | |
| Personal & Family Use | |
| Institutional | |
| Others |
| By Propulsion Type | Pedal Assisted | |
| Speed Pedelec | ||
| Throttle Assisted | ||
| By Application Type | Cargo/Utility | |
| City/Urban | ||
| Trekking/Mountain | ||
| By Battery Type | Lead Acid Battery | |
| Lithium-ion Battery | ||
| Others | ||
| By Motor Placement | Hub (Front/Rear) | |
| Mid-Drive | ||
| By Drive Systems | Chain Drive | |
| Belt Drive | ||
| By Motor Power | Less than 250 W | |
| 251-350 W | ||
| 351-500 W | ||
| 501-600 W | ||
| More than 600 W | ||
| By Price Band | Up to USD 1,000 | |
| USD 1,001-1,499 | ||
| USD 1,500-2,499 | ||
| USD 2,500-3,499 | ||
| USD 3,500-5,999 | ||
| Above USD 6,000 | ||
| By Sales Channel | Online | |
| Offline | Specialized E-Bike Retailers | |
| Traditional Bike Shops | ||
| Department Stores & Sporting Goods Chains | ||
| By End Use | Commercial Delivery | Retail & Goods Delivery |
| Food & Beverage Delivery | ||
| Service Providers | ||
| Personal & Family Use | ||
| Institutional | ||
| Others | ||


Market Definition
- By Application Type - E-bikes considered under this segment include city/urban, trekking, and cargo/utility e-bikes. The common types of e-bikes under these three categories include off-road/hybrid, kids, ladies/gents, cross, MTB, folding, fat tire, and sports e-bike.
- By Battery Type - This segment includes lithium-ion batteries, lead-acid batteries, and other battery types. The other battery type category includes nickel-metal hydroxide (NiMH), silicon, and lithium-polymer batteries.
- By Propulsion Type - E-bikes considered under this segment include pedal-assisted e-bikes, throttle-assisted e-bikes, and speed pedelec. While the speed limit of pedal and throttle-assisted e-bikes is usually 25 km/h, the speed limit of speed pedelec is generally 45 km/h (28 mph).
| Keyword | Definition |
|---|---|
| Pedal Assisted | Pedal-assist or pedelec category refers to the electric bikes that provide limited power assistance through torque-assist system and do not have throttle for varying the speed. The power from the motor gets activated upon pedaling in these bikes and reduces human efforts. |
| Throttle Assisted | Throttle-based e-bikes are equipped with the throttle assistance grip, installed on the handlebar, similarly to motorbikes. The speed can be controlled by twisting the throttle directly without the need to pedal. The throttle response directly provides power to the motor installed in the bicycles and speeds up the vehicle without paddling. |
| Speed Pedelec | Speed pedelec is e-bikes similar to pedal-assist e-bikes as they do not have throttle functionality. However, these e-bikes are integrated with an electric motor which delivers power of approximately 500 W and more. The speed limit of such e-bikes is generally 45 km/h (28 mph) in most of the countries. |
| City/Urban | The city or urban e-bikes are designed with daily commuting standards and functions to be operated within the city and urban areas. The bicycles include various features and specifications such as comfortable seats, sit upright riding posture, tires for easy grip and comfortable ride, etc. |
| Trekking | Trekking and mountain bikes are special types of e-bikes that are designed for special purposes considering the robust and rough usage of the vehicles. These bicycles include a strong frame, and wide tires for better and advanced grip and are also equipped with various gear mechanisms which can be used while riding in different terrains, rough grounded, and tough mountainous roads. |
| Cargo/Utility | The e-cargo or utility e-bikes are designed to carry various types of cargo and packages for shorter distances such as within urban areas. These bikes are usually owned by local businesses and delivery partners to deliver packages and parcels at very low operational costs. |
| Lithium-ion Battery | A Li-ion battery is a rechargeable battery, which uses lithium and carbon as its constituent materials. The Li-Ion batteries have a higher density and lesser weight than sealed lead acid batteries and provide the rider with more range per charge than other types of batteries. |
| Lead Acid Battery | A lead acid battery refers to sealed lead acid battery having a very low energy-to-weight and energy-to-volume ratio. The battery can produce high surge currents, owing to its relatively high power-to-weight ratio as compared to other rechargeable batteries. |
| Other Batteries | This includes electric bikes using nickel–metal hydroxide (NiMH), silicon, and lithium-polymer batteries. |
| Business-to-Business (B2B) | The sales of e-bikes to business customers such as urban fleet and logistics company, rental/sharing operators, last-mile fleet operators, and corporate fleet operators are considered under this category. |
| Business-to-Customers (B2C) | The sales of electric scooters and motorcycles to direct consumers is considered under this category. The consumers acquire these vehicles either directly from manufacturers or from other distributers and dealers through online and offline channel. |
| Unorganized Local OEMs | These players are small local manufacturers and assemblers of e-bikes. Most of these manufacturers import the components from China and Taiwan and assemble them locally. They offer the product at low cost in this price sensitive market which give them advantage over organized manufacturers. |
| Battery-as-a-Service | A business model in which the battery of an EV can be rented from a service provider or swapped with another battery when it runs out of charge |
| Dockless e-Bikes | Electric bikes that have self-locking mechanisms and a GPS tracking facility with an average top speed of around 15mph. These are mainly used by bike-sharing companies such as Bird, Lime, and Spin. |
| Electric Vehicle | A vehicle which uses one or more electric motors for propulsion. Includes cars, scooters, buses, trucks, motorcycles, and boats. This term includes all-electric vehicles and hybrid electric vehicles |
| Plug-in EV | An electric vehicle that can be externally charged and generally includes all-electric vehicles as well as plug-in hybrids. In this report we use the term for all-electric vehicles to differentiate them from plug-in hybrid electric vehicles. |
| Lithium-Sulphur Battery | A rechargeable battery that replaces the liquid or polymer electrolyte found in current lithium-ion batteries with sulfur. They have more capacity than Li-ion batteries. |
| Micromobility | Micromobility is one of the many modes of transport involving very-light-duty vehicles to travel short distances. These means of transportation include bikes, e-scooters, e-bikes, mopeds, and scooters. Such vehicles are used on a sharing basis for covering short distances, usually five miles or less. |
| Low Speed Electric Vehicls (LSEVs) | They are low speed (usually less than 25 kmph) light vehicles that do not have an internal combustion engine, and solely use electric energy for propulsion. |


Research Methodology
Mordor Intelligence follows a four-step methodology in all its reports.
- Step-1: Identify Key Variables: To build a robust forecasting methodology, the variables and factors identified in Step-1 are tested against available historical market numbers. Through an iterative process, the variables required for market forecast are set and the model is built based on these variables.
- Step-2: Build a Market Model: Market-size estimations for the historical and forecast years have been provided in revenue and volume terms. Market revenue is calculated by multiplying the volume demand with volume-weighted average battery pack price (per kWh). Battery pack price estimation and forecast takes into account various factors affecting ASP, such as inflation rates, market demand shifts, production costs, technological developments, and consumer preferences, providing estimations for both historical data and future trends.
- Step-3: Validate and Finalize: In this important step, all market numbers, variables, and analyst calls are validated through an extensive network of primary research experts from the market studied. The respondents are selected across levels and functions to generate a holistic picture of the market studied.
- Step-4: Research Outputs: Syndicated Reports, Custom Consulting Assignments, Databases & Subscription Platforms


