Market Overview
| Study Period | 2020 - 2031 |
|---|---|
| Forecast Data Period | 2026 - 2031 |
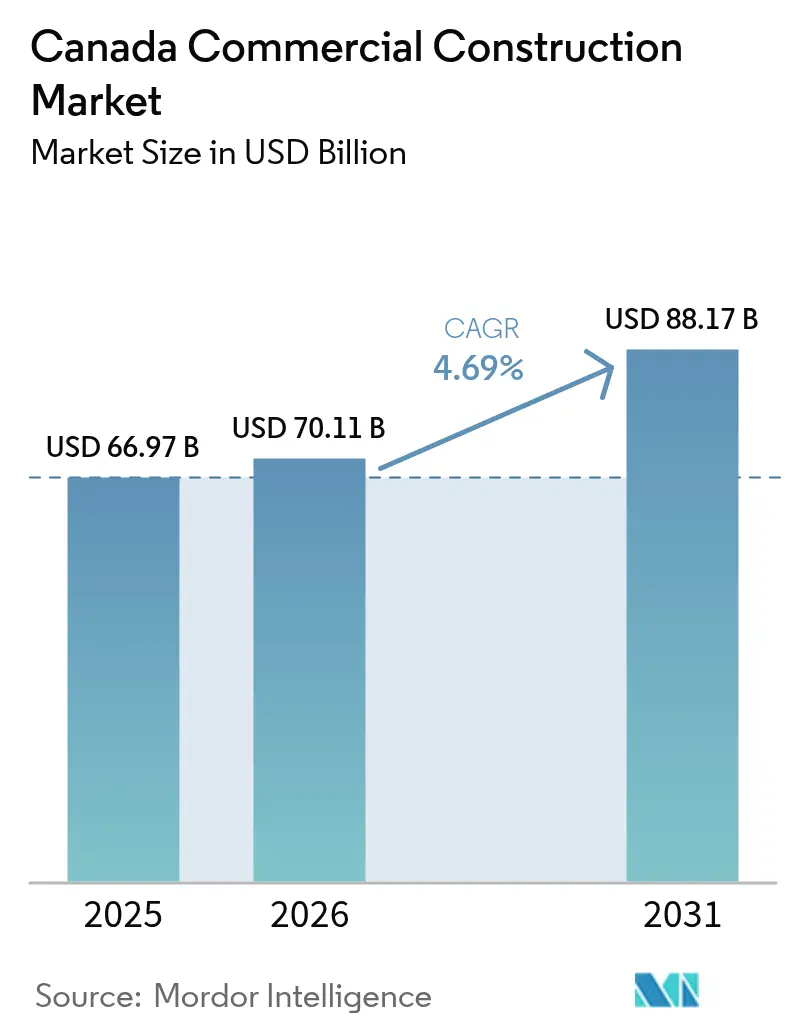
| Base Year Market Size (2025) | USD 66.97 Billion |
| Market Size (2026) | USD 70.11 Billion |
| Market Size (2031) | USD 88.17 Billion |
| Growth Rate (2026 - 2031) | 4.69% CAGR |
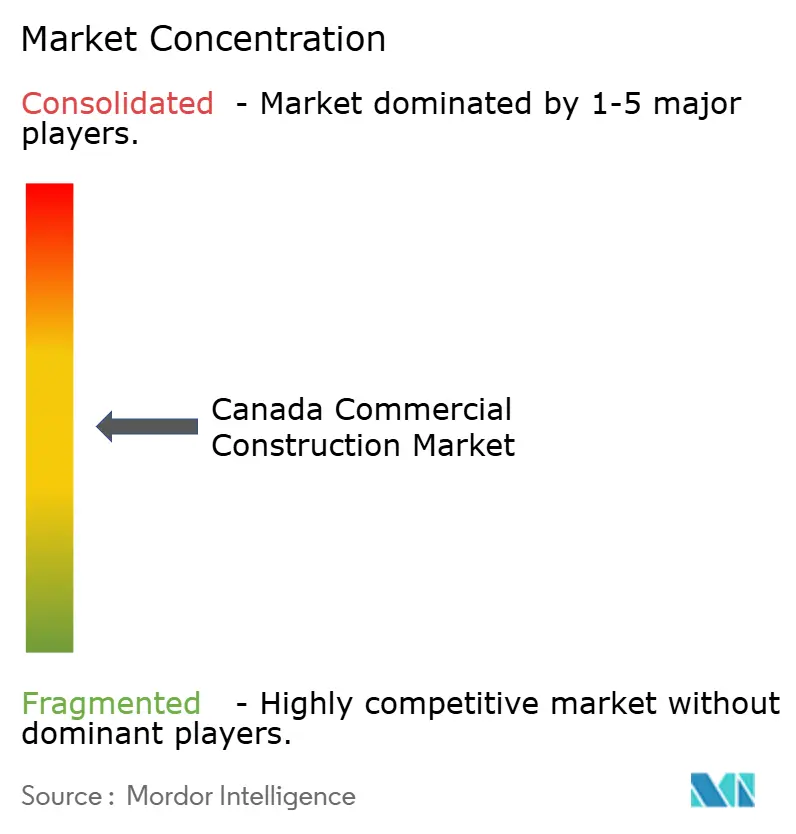
| Market Concentration | Medium |
Major Players *Disclaimer: Major Players sorted in no particular order Image © Mordor Intelligence. Reuse requires attribution under CC BY 4.0. | |
Canada Commercial Construction Market Analysis by Mordor Intelligence
The Canada Commercial Construction Market size is expected to grow from USD 66.97 billion in 2025 to USD 70.11 billion in 2026 and is forecast to reach USD 88.17 billion by 2031 at 4.69% CAGR over 2026-2031.
Shifting demand toward data centers and logistics hubs is redirecting capital away from legacy office towers, while a USD 159 billion public-works pipeline is anchoring mixed-use precincts that intertwine civic, retail, and hospitality uses. Financing conditions have eased since the January 2025 policy-rate cut, yet developers remain selective because construction-cost inflation is still outrunning the consumer price index. Modular delivery is gaining traction as contractors look to compress schedules and hedge against skilled-labor shortages, but inconsistent municipal approvals slow widespread adoption. Taken together, these forces are altering how, where, and by whom the Canada commercial construction market is built.
Key Report Takeaways
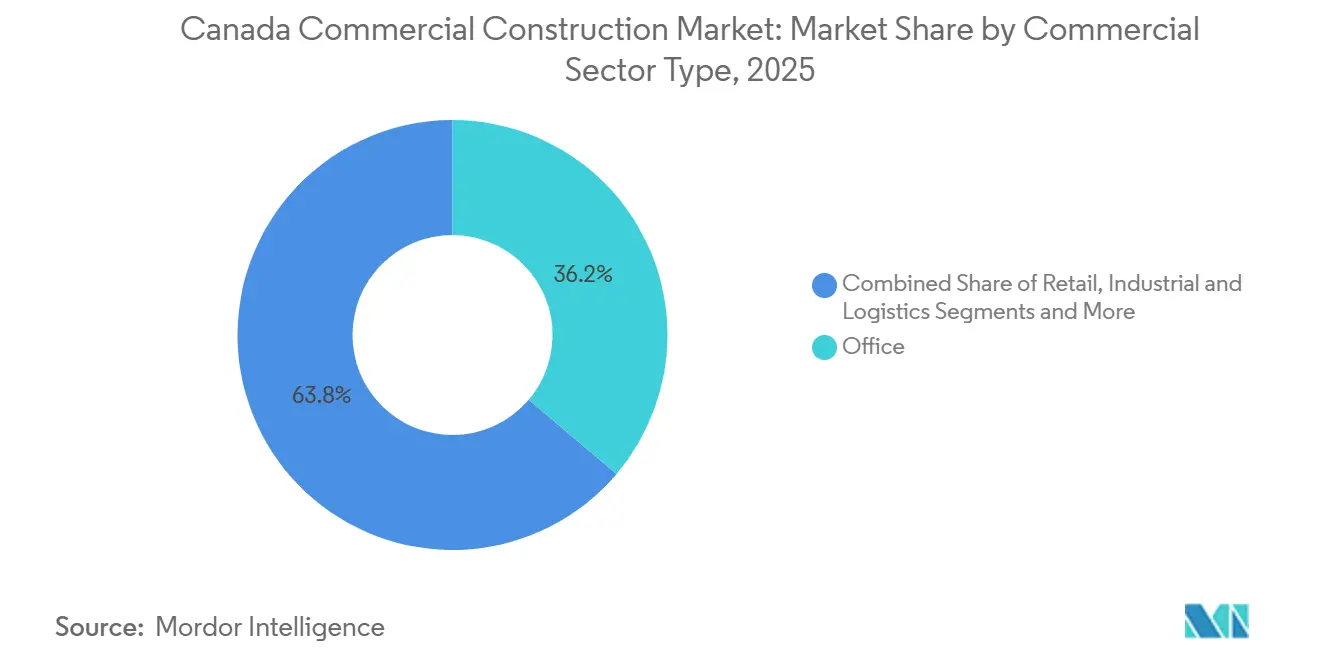
- By commercial sector type, office space led with 36.2% of the Canada commercial construction market share in 2025, while industrial and logistics facilities are forecast to expand at a 5.23% CAGR through 2031.
- By construction type, new-build activity accounted for 77.2% of the Canada commercial construction market size in 2025, whereas renovation work is advancing at a 5.09% CAGR over 2026-2031.
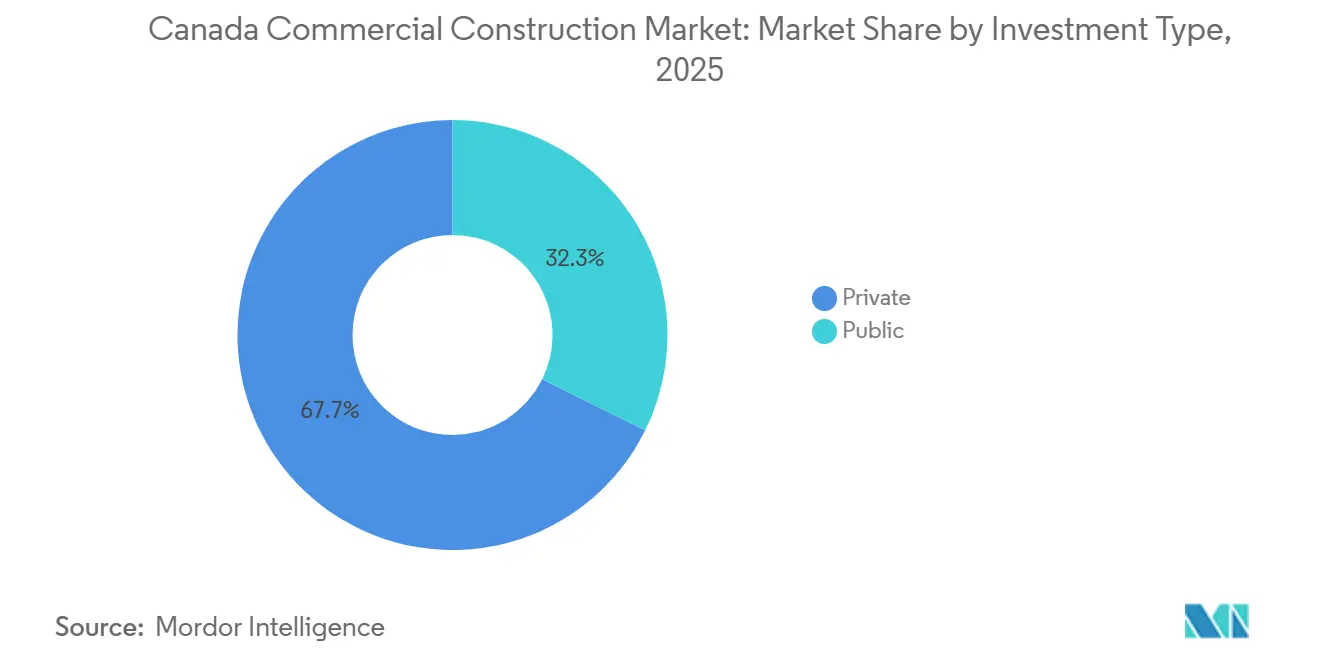
- By investment source, private capital contributed 67.7% of total spending in 2025, but public spending is projected to post a 5.05% CAGR to 2031.
- By province, Ontario captured 34.1% of the Canada commercial construction market size in 2025, and British Columbia is expected to register the fastest 5.41% CAGR through 2031.
Note: Market size and forecast figures in this report are generated using Mordor Intelligence’s proprietary estimation framework, updated with the latest available data and insights as of 2026.
Canada Commercial Construction Market Trends and Insights
Drivers Impact Analysis*
| Drivers | (~) % IMPACT ON CAGR FORECAST | Geographic Relevance | Impact Timeline |
|---|---|---|---|
| Growth in data centers and critical facilities | +1.4% | British Columbia, Alberta, Ontario, Quebec | Short term (≤ 2 years) |
| Expansion of logistics and warehouse facilities | +1.2% | Ontario, British Columbia, Quebec | Short term (≤ 2 years) |
| Public-sector infrastructure pipelines supporting institutional and civic construction | +0.8% | Ontario, Quebec, British Columbia | Medium term (2-4 years) |
| Retrofit and decarbonization programs | +0.6% | Urban cores nationwide | Long term (≥ 4 years) |
| Adoption of modular and prefabricated construction | +0.5% | Major metros | Medium term (2-4 years) |
| Source: Mordor Intelligence | |||
Growth in Data Centers and Critical Facilities Boosting Specialized Construction Demand
Hyperscale projects are soaking up skilled trades and substation capacity. BCE opened the first 73 MW phase of its Kamloops campus in June 2025, while eStruxture and Vantage each secured nine-figure funding rounds to grow in hydro-rich provinces. QScale’s proposed USD 1.85-2.96 billion Ontario complex would rank among the country’s largest one-phase builds. Utilities in British Columbia and Quebec are fast-tracking interconnections for digital-infrastructure clients, occasionally deferring other industrial hookups to free capacity. These capital-intensive builds keep specialized contractors booked well past 2027[1]BCE Inc., “BCE Opens First Phase of 73 MW Kamloops Data Campus, June 2025,” bce.ca.
Expansion of Logistics and Warehouse Facilities Driving Industrial Project Activity
Rising e-commerce penetration is sustaining demand for large-format warehouses with cold-chain and last-mile capability. Metro British Columbia completed 4.3 million ft² of industrial space in 2025, half of it built-to-suit for specialized tenants. National availability tightened to 5.0%, even as groundbreaking hit a five-year low, implying potential supply gaps by 2027. Port upgrades in British Columbia and Quebec are spurring new logistics parks in adjacent municipalities where land prices continue to rise at double-digit rates. Major retailers such as Amazon and Walmart are anchoring fulfillment clusters that draw third-party providers and packaging firms[2]Montréal Port Authority, “2025 Container Terminal Expansion Update,” port-montreal.com.
Public-Sector Infrastructure Pipelines Supporting Institutional and Civic Construction
Governments are using multi-year capital budgets to seed commercial precincts around transit stations and hospital campuses. Budget 2025 outlined USD 85 billion for transport corridors and USD 22.2 billion for defense facilities, accelerating permit approvals and signaling long-dated demand. Health-care redevelopments in British Columbia and Ontario are attracting private retail and hospitality projects that follow clinical staff and patient footfall. The Eglinton Crosstown LRT and Ontario Line have unlocked hundreds of hectares for rezoning, prompting land assemblies in Ontario midtown. Similar momentum is visible in Quebec, where new REM stations are compressing development cycles[3]Parliamentary Budget Officer, “Infrastructure and Communities Portfolio Outlook 2025-26,” pbo-dpb.gc.ca .
Retrofit and Decarbonization Programs Increasing Commercial Renovation Work
Federal incentives are redirecting capital toward existing buildings. The Deep Retrofit Accelerator backs envelope upgrades and heat-pump installs that can cut energy use by 30% or more. Utility rebates covering up to 40% of retrofit costs are shortening payback periods, even at elevated borrowing rates. Office owners chasing premium rents are pursuing LEED recertification, which commanded 8-12% higher rents in 2025. Updated municipal codes now require deep retrofits when major permits are pulled, locking a steady backlog through the decade.
Restraints Impact Analysis*
| Restraints | (~) % IMPACT ON CAGR FORECAST | Geographic Relevance | Impact Timeline |
|---|---|---|---|
| High interest rates and tight financing | −0.9% | Calgary, Edmonton, secondary markets | Short term (≤ 2 years) |
| Skilled labor shortages | −0.7% | British Columbia, Ontario | Medium term (2-4 years) |
| Material price volatility and long lead times | −0.4% | Steel-intensive projects nationwide | Short term (≤ 2 years) |
| Source: Mordor Intelligence | |||
High Interest Rates and Tight Financing Delaying Private Developments
Even after the January 2025 rate cut, banks are cautious. Equity requirements now exceed 30% for speculative builds, freezing new office starts in Alberta’s high-vacancy markets. Construction-loan spreads widened to 250 basis points by late 2025, pushing mid-tier developers toward costlier private debt. Public and build-to-suit projects dominate current pipelines as they offer stronger covenants. Until vacancy normalizes, conventional offices will see limited groundbreakings.
Skilled Labor Shortages, Increasing Costs, and Execution Risks
Canada needs more than 85,000 additional construction workers by 2032, yet apprenticeship completions lag retirements. Median electrician wages in Ontario reached USD 25.16 per hour in 2025, up 14% in two years. Contractors often forgo bidding because they cannot do staff jobs, masking true demand. A new Housing & Construction Alliance aims to streamline foreign credential recognition, but provincial differences slow rollout. Rising labor costs are now cited more often than materials as the top budget-risk item.
*Our forecasts treat driver/restraint impacts as directional, not additive. The impact forecasts reflect baseline growth, mix effects, and variable interactions.
Segment Analysis
By Commercial Sector Type: Data Centers Redefine Industrial Growth
Industrial and logistics properties are set for a 5.23% CAGR through 2031, energized by hyperscale data centers and e-commerce hubs that demand complex power and cooling systems. Office space still captured 36.2% of 2025 construction value, yet fresh starts declined as vacancy, although lower at 18.0%, remains far above 2019 levels. Return-to-office rules from major banks and Ontario’s five-day mandate added 2.2 million ft² of net absorption, but excess sublease inventory keeps developers cautious. Retail building now favors food halls and entertainment anchors, while hospitality, healthcare-linked, and mixed-use sites benefit from large institutional tenants nearby. Overall, adaptive reuse and downtown activation incentives are steering retail toward converting underused offices into experiential ground-floor venues.
Tenant flight to quality is widening the class divide, with Class AAA and A vacancy at 9.3% versus 17.8% for Class B and C. CIBC Square Phase 2 delivered 1.75 million ft² in 2026 and secured full pre-leasing from financial firms seeking consolidation. Metro British Columbia added 4.3 million ft² of industrial space in 2025, half of it built-to-suit for cold chain and last-mile delivery. Data centers inside this category now cost more than USD 300 per ft² because of redundant power, liquid cooling, and seismic engineering. Retail developers continue to prioritize adaptive reuse, aided by municipal grants that incentivize downtown revitalization projects.


By Construction Type: Renovation Gains Momentum Under Decarbonization Mandates
New builds still held 77.2% of 2025 volume, but renovations are forecast to rise at a 5.09% CAGR as stricter energy codes take hold. The Deep Retrofit Accelerator Initiative’s USD 148 million fund targets pre-2000 buildings for envelopes, HVAC, and automation upgrades. Ontario and British Columbia landlords securing LEED Gold or Platinum in 2025 captured 8–12% rent premiums that justify USD 20–30 per ft² retrofit budgets. Office-to-residential conversions are growing in Calgary and Edmonton, where vacancy rates above 25% make some towers obsolete. Provincial codes adopted in 2024-2025 now trigger comprehensive retrofits whenever major permits are pulled.
Industrial and logistics users still favor new construction because older shells cannot meet 40-ft clear heights or heavy floor loads. All data centers are ground-up projects, stretching specialized labor for liquid-cooling installs and redundant power feeds. Retail and legacy offices dominate renovation pipelines, adding food halls, gyms, and co-working to stay competitive with e-commerce. The Canada Infrastructure Bank’s program requires at least 30% energy savings to release capital, forcing deep rather than incremental improvements. These regulatory and financial forces lock renovation into sustained demand through 2031.
By Investment Source: Public Spending Anchors Institutional Precincts
Private investors supplied 67.7% of 2025 capital, but public funding is expected to grow at a 5.05% CAGR, led by hospitals, transit lines, and civic projects that seed mixed-use precincts. Ottawa’s USD 159 billion infrastructure plan running to 2030 bundles courthouses and offices with adjacent development rights. Hospital redevelopments in British Columbia and Ontario are sparking waves of retail, housing, and office demand within walkable distances. Transit P3s such as the Ontario Line and Quebec's REM let consortia monetize air rights while governments finance base infrastructure. Federal green grants worth USD 298 million for 2025-2026 further tilt spending toward upgrading community assets.
Private capital now concentrates on build-to-suit industrial space and data centers, where tenant credit and long leases de-risk lending. Speculative office towers have paused in high-vacancy markets, shifting investors toward adaptive reuse and lighter-risk renovations. Public spending acts counter-cyclically, smoothing contractor backlogs when private projects stall. Ontario and Quebec capture nearly 60% of federal infrastructure dollars, leaving other provinces with thinner pipelines. Pension funds and REITs increasingly self-finance or tap private debt markets, bypassing banks’ tighter construction-loan standards.
Geography Analysis
Ontario held 34.1% of national construction in 2025 as CIBC Square Phase 2 and Union Centre advanced, yet an 18.0% office vacancy shifted capital to suburban data-center and logistics projects in Mississauga, Brampton, and Vaughan. Net absorption reached 2.2 million ft² after banks restored office mandates and Ontario ordered five-day in-office work from January 2026, while QScale’s planned CAD 2.5–4.0 billion (USD 1.85–2.96 billion) campus underscored surging demand for specialist contractors and power. Industrial strength continued around Amazon and Walmart hubs, backed by February 2025 building permits of USD 3.7 billion and annual non-residential intentions of USD 57 billion.
British Columbia is projected to grow at a 5.41% CAGR to 2031, with Metro industrial vacancy at 6.0% and 1.3 million ft² of 2026 speculative starts. The city delivered 4.3 million ft² of largely build-to-suit industrial space in 2025, while data-center operators such as BCE and eStruxture tapped sub-USD 0.05/kWh hydro power. Office vacancy of 11.6%, coupled with high land costs, is steering investment to adaptive reuse, as major transit and hospital projects lift surrounding commercial demand amid tight labor that has pushed electrician wages to CAD 34 (USD 25.16) per hour.
Ontario's depth of contractors, transit-driven land releases, and finance-tenant base sustain its scale, whereas British Columbia's land scarcity drives pricier multi-story warehouses and greater wage pressure. Both metros court data-center growth, but Ontario relies on nuclear and gas power, while British Columbia's hydro mix offers cost and sustainability advantages. Retail work in each market now favors food halls and entertainment-anchored formats repurposing ground floors of older towers.
Competitive Landscape
Canada’s contractor universe is moderately fragmented. SNC-Lavalin, PCL, and EllisDon routinely win mega-projects because of balance-sheet depth and advanced BIM platforms, whereas mid-sized regionals compete on conventional office fit-outs. Data-center clients prefer builders that self-perform electrical scopes, giving EllisDon and Pomerleau an edge once capacity tops 20 MW.
Strategic pivots are underway. SNC-Lavalin redeployed USD 2.41 billion from its Highway 407 sale into nuclear-plant upgrades, tilting its backlog toward infrastructure with inflation pass-through clauses. Bird Construction scaled up self-perform divisions to buffer margin risk from subcontractor shortages, a tactic noted in its USD 2.07 billion backlog disclosure. Joint ventures dominate transit projects such as the Ontario Line, enabling risk sharing but dissolving upon completion, so durable alliances remain rare.
Technology adoption widens the performance gap. Top-tier firms leverage digital twins and drone progress scans for real-time cost control, whereas many smaller companies lack the capital to adopt similar tools. Modular specialists and design-build upstarts are chipping at niche markets like hotel room pods, bypassing general contractors and contracting directly with owners. As fixed-price steel packages grow riskier, only firms with strong hedging strategies can maintain historical margins.
Canada Commercial Construction Industry Leaders
SNC-Lavalin Group Inc.
PCL Construction
EllisDon Group
Pomerleau Inc.
Bird Construction Company
- *Disclaimer: Major Players sorted in no particular order

Recent Industry Developments
- February 2026: Employment and Social Development Canada projected a 1.4 million trades shortfall by 2033, spotlighting construction labor risk.
- January 2026: Ontario mandated five-day office attendance for public employees, trimming downtown sublease space.
- December 2025: Qu Data Centres opened nine modular facilities totaling 49 MW and 374,000 ft².
- July 2025: eStruxture raised USD 1 billion to expand data halls in Quebec, Ontario, and British Columbia.


Canada Commercial Construction Market Report Scope
By Commercial Sector Type
| Office |
| Retail |
| Industrial and Logistics |
| Others |
By Construction Type
| New Construction |
| Renovation |
By Investment Source
| Public |
| Private |
By Province
| Ontario |
| Quebec |
| British Columbia |
| Alberta |
| Rest of Canada |
| By Commercial Sector Type | Office |
| Retail | |
| Industrial and Logistics | |
| Others | |
| By Construction Type | New Construction |
| Renovation | |
| By Investment Source | Public |
| Private | |
| By Province | Ontario |
| Quebec | |
| British Columbia | |
| Alberta | |
| Rest of Canada |


Key Questions Answered in the Report
How large is the Canada commercial construction market in 2026?
The Canada commercial construction market size is estimated at USD 70.11 billion in 2026.
Which province is expected to grow fastest through 2031?
British Columbia is forecast to post the quickest 5.41% CAGR, driven by industrial land scarcity and data-center builds.
What segment dominates current spending?
Office assets still lead with 36.2% of 2025 spending, though industrial projects are gaining share fast.
How severe is the labor gap facing builders?
Canada may lack more than 85,000 construction workers by 2032, pushing wages and schedules higher.
Why are data centers influencing construction trends?
Hyperscale data centers demand specialized cooling and redundant power, creating high-value contracts that absorb skilled trades and materials.
Is renovation or new-build activity growing faster?
Renovation work tied to decarbonization mandates is growing at a 5.09% CAGR, outpacing overall market growth.
Page last updated on:


