
Calcium Oxide Market Size and Share
Market Overview
| Study Period | 2021 - 2031 |
|---|---|
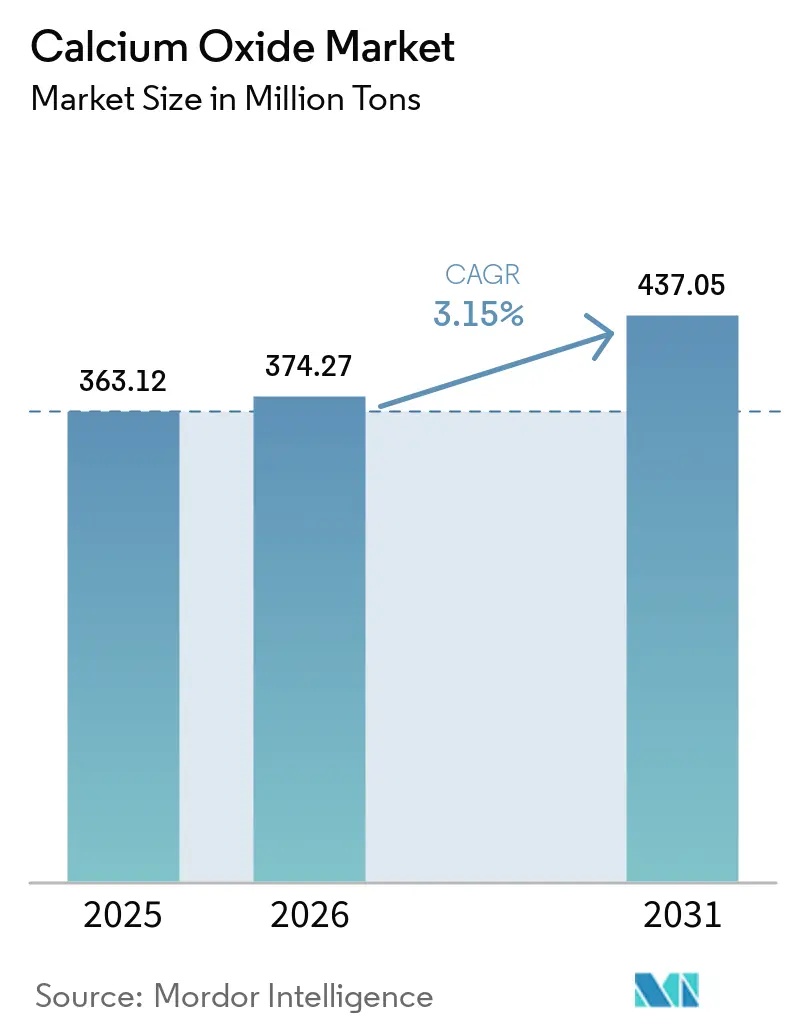
| Market Volume (2026) | 374.27 Million tons |
| Market Volume (2031) | 437.05 Million tons |
| Growth Rate (2026 - 2031) | 3.15 % |
| Fastest Growing Market | Middle East and Africa |
| Largest Market | Asia Pacific |
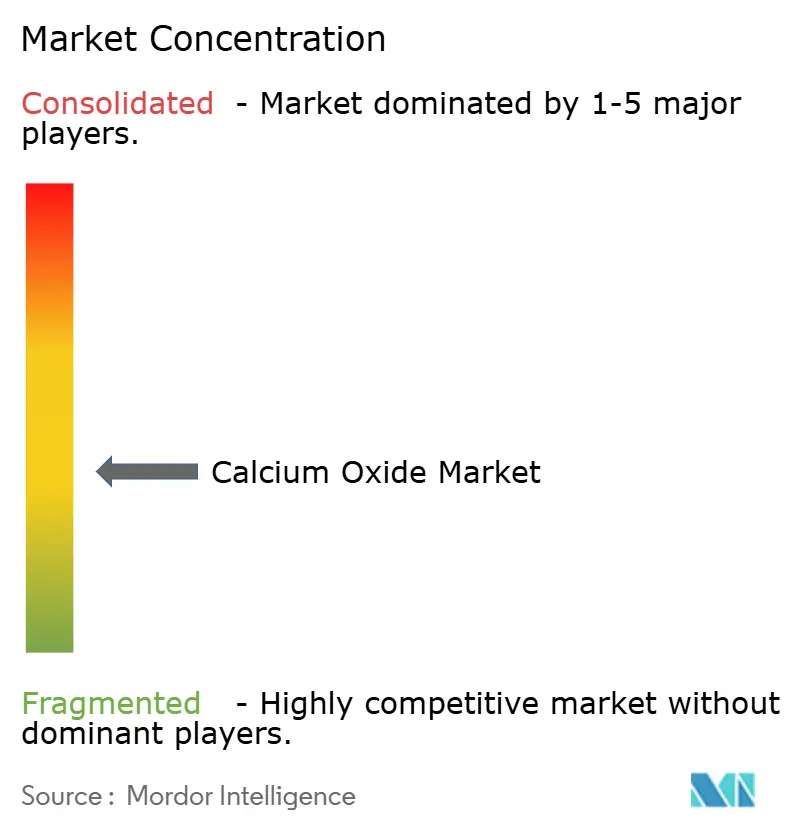
| Market Concentration | Medium |
Major Players *Disclaimer: Major Players sorted in no particular order Image © Mordor Intelligence. Reuse requires attribution under CC BY 4.0. | |
Calcium Oxide Market Analysis by Mordor Intelligence
The Calcium Oxide Market size was valued at 363.12 Million tons in 2025 and is estimated to grow from 374.27 Million tons in 2026 to reach 437.05 Million tons by 2031, at a CAGR of 3.15% during the forecast period (2026-2031). Blast-furnace/basic-oxygen steelmaking continues to anchor demand, yet the gradual shift toward electric arc furnaces is lowering per-ton quicklime intensity even while absolute crude-steel tonnage remains high. Stricter sulfur-dioxide limits under the U.S. Clean Air Act and the EU Industrial Emissions Directive are compelling coal-fired utilities and cement kilns to retrofit flue-gas-desulfurization systems that rely on lime slurries, creating a stable compliance-driven demand pool. In parallel, low-carbon cement pilots across Europe and North America are lifting the premium segment for high-purity CaO, which trades 20-30% above commodity grades. Energy-price volatility and carbon-emission costs remain the principal headwinds, accelerating investment in carbon-capture-ready kilns and alternative fuels.
Key Report Takeaways
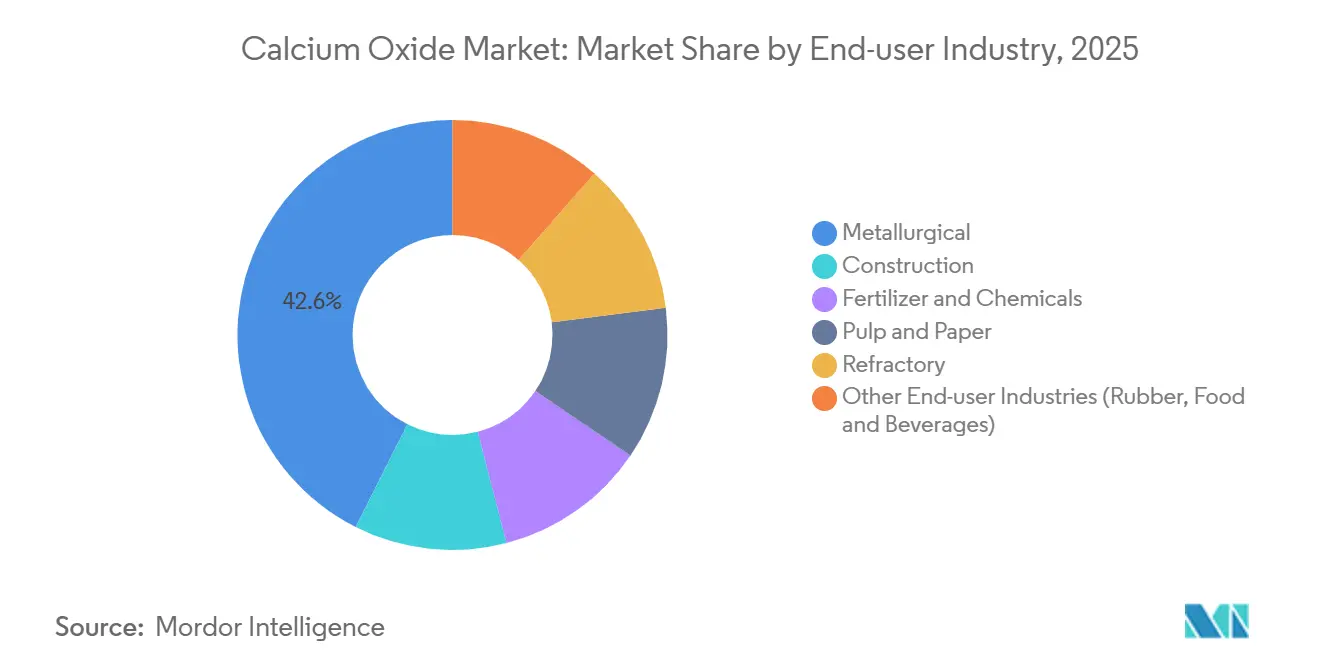
- By end-user industry, the metallurgical segment led with 42.57% of the calcium oxide market share in 2025, while the fertilizer and chemicals segment is forecast to expand at a 4.16% CAGR through 2031.
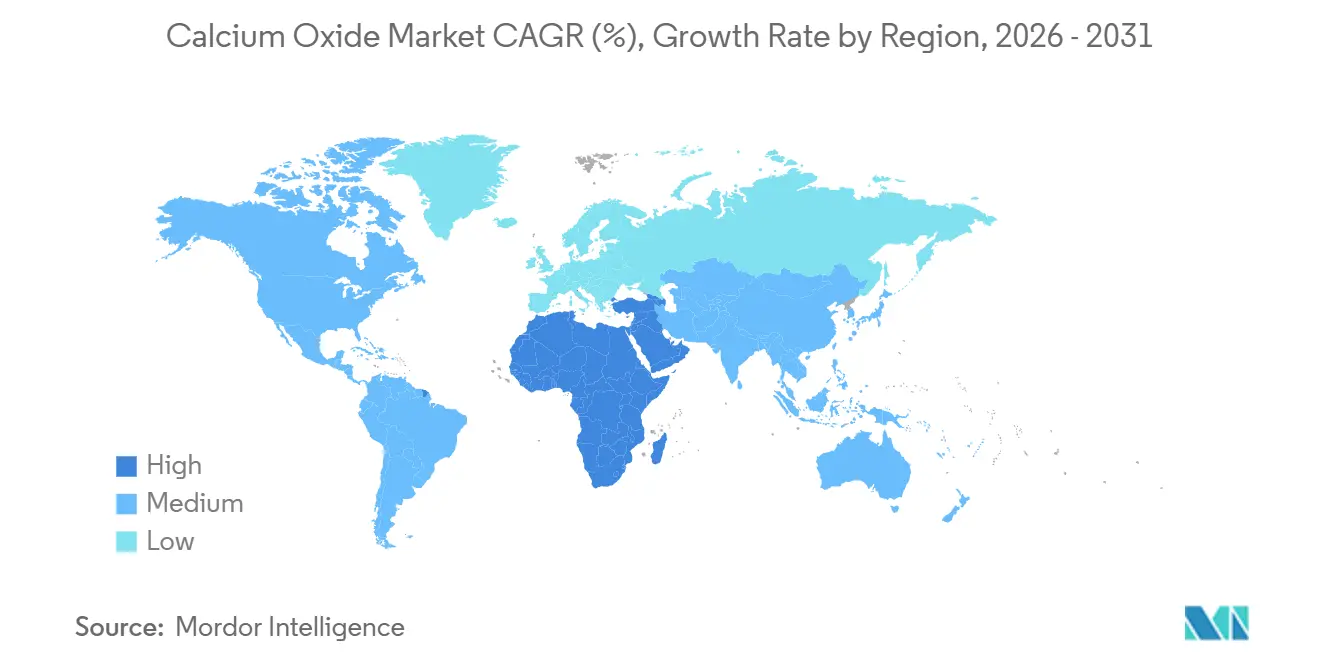
- By geography, Asia-Pacific captured 49.32% of the calcium oxide market share in 2025, while the Middle-East and Africa region is projected to post the fastest growth at 3.98% CAGR to 2031.
Note: Market size and forecast figures in this report are generated using Mordor Intelligence’s proprietary estimation framework, updated with the latest available data and insights as of 2026.
Market Trends and Insights
Drivers Impact Analysis of Calcium Oxide Market*
| Driver | (~) % Impact on CAGR Forecast | Geographic Relevance | Impact Timeline |
|---|---|---|---|
| Surging global crude-steel output | +0.7% | APAC core (China, India, Japan), spill-over to Middle-East | Medium term (2-4 years) |
| Rapid infrastructure and cement demand in Asia-Pacific and Africa | +0.8% | APAC (India, ASEAN), Middle-East (Saudi Arabia, UAE), Sub-Saharan Africa | Long term (≥ 4 years) |
| Stricter emissions rules boosting CaO use in FGD and water treatment | +0.4% | Global, with concentration in North America, EU, and China | Short term (≤ 2 years) |
| Agricultural soil-health programs in emerging economies | +0.5% | Sub-Saharan Africa, Brazil, India, Argentina | Long term (≥ 4 years) |
| Low-carbon cement and carbon-looping technologies requiring high-purity CaO | +0.4% | EU, North America, early pilots in APAC | Long term (≥ 4 years) |
| Source: Mordor Intelligence | |||
Surging Global Crude-Steel Output
Steel remains the single-largest consumer of calcium oxide, using 15-50 kilograms of quicklime per ton of crude steel, depending on furnace technology. China produced just over 1.0 billion tons of crude steel in 2024, a marginal decline yet still outsizing every other market. The OECD projects that 40.5% of new steel capacity through 2030 will continue to use the BF-BOF route, preserving lime intensity even as EAF penetration inches higher. India’s National Steel Policy targets 300 million tons of capacity by 2030, largely BF-BOF, effectively locking in sustained quicklime offtake. The International Energy Agency calculates that fluxes in steelmaking account for 0.3 gigatons of process CO₂ annually, underscoring the climate case for CCS-equipped kilns. Collectively, these factors underpin a demand floor for the calcium oxide market even under conservative steel-growth scenarios.
Rapid Infrastructure and Cement Demand in Asia-Pacific and Africa
Cement output reached 453 million tons in India during fiscal 2025, supported by a clinker-to-cement ratio near 0.75. Major ASEAN economies are plowing public budgets into rail, highways, and affordable housing, lifting regional cement production by 4-5% each year through 2030. Saudi Arabia’s Vision 2030 megaprojects require huge volumes of low-carbon concrete; a 5,000-ton-per-day clinker-free line at Yanbu showcases how high-purity CaO can substitute Portland clinker while cutting embodied carbon by up to 80%. In Sub-Saharan Africa, 32.7 million hectares of acid soils are depressing crop yields, spurring agricultural-lime programs that dovetail with construction growth. These converging infrastructure and agricultural initiatives reinforce a robust volume trajectory for the calcium oxide market.
Stricter Emissions Rules Boosting CaO Use in FGD and Water Treatment
Revised National Ambient Air Quality Standards in the United States and tighter SO₂ caps in the EU are forcing older coal units and cement kilns to install or upgrade lime-based scrubbers[1]U.S. Environmental Protection Agency, “Revised NAAQS for SO₂,” epa.gov . China’s Ministry of Ecology and Environment now mandates SO₂ concentrations below 50 mg/m³ for cement kilns, accelerating lime demand for desulfurization. Municipal utilities continue to rely on lime softening and Calcium Hydroxide for pH control and phosphorus removal; the American Water Works Association notes dosing rates of 100-300 mg/L, volumes that move independently of construction and steel cycles. These regulatory levers create a relatively price-inelastic floor for the calcium oxide market.
Low-Carbon Cement and Carbon-Looping Technologies Requiring High-Purity CaO
The EU Regulation 2024/2620 recognizes mineral carbonates as permanent carbon sinks, enabling producers to claim credits when CaO reacts with CO₂ during curing. Lhoist’s EUR 250 million investment in a carbon-capture-ready dolime plant exemplifies the pivot toward CCS-equipped assets targeting one million tons of annual CO₂ sequestration by 2031. Carmeuse is piloting calcium-looping to capture kiln emissions by cycling CaO and CaCO₃ in separate reactors. All such technologies specify CaO purities above 90% to minimize inert buildup, opening a premium niche within the broader calcium oxide market.
Restraints Impact Analysis of Calcium Oxide Market*
| Restraint | (~) % Impact on CAGR Forecast | Geographic Relevance | Impact Timeline |
|---|---|---|---|
| High energy and CO₂ costs, tightening kiln-emission limits | -0.3% | EU, North America, with emerging pressure in APAC | Short term (≤ 2 years) |
| Limestone and natural-gas price volatility | -0.2% | Global, acute in regions dependent on imported gas (EU, Japan, South Korea) | Medium term (2-4 years) |
| Alternative sorbents/fluxes gaining share in steel | -0.2% | Global steel markets, concentrated in China, EU, and North America EAF clusters | Medium term (2-4 years) |
| Source: Mordor Intelligence | |||
High Energy and CO₂ Costs, Tightening Kiln-Emission Limits
Producing one ton of quicklime consumes 3.2-4.5 GJ of thermal energy, and natural gas can represent 60% of cash costs for gas-fired kilns. EU carbon prices near EUR 80 per ton of CO₂ translate into an additional EUR 60-70 per ton of quicklime for legacy kilns emitting roughly 0.8 tons CO₂ per ton product. Free-allowance reductions under ETS Phase IV intensify this burden each year. In the United States, emerging state-level programs and stricter New Source Performance Standards compel selective catalytic reduction and fabric-filter retrofits that raise capex without expanding capacity. Small, standalone producers find it increasingly difficult to finance such upgrades, feeding a consolidation trend in the calcium oxide market.
Limestone and Natural-Gas Price Volatility
High-grade (more than 95% CaCO₃) limestone reserves are becoming deeper and farther from transport nodes, raising haulage costs by up to 25% over the past five years[2]U.S. Geological Survey, “Mineral Commodity Summary: Lime 2025,” usgs.gov . Import dependence is acute in regions such as Japan, South Korea, and parts of the Middle-East, where freight premiums add USD 10-15 per ton to landed cost. LNG prices in Northeast Asia oscillated between USD 12 and USD 25 per MMBtu during 2024-2025, feeding unpredictable kiln costs. Alternative fuels such as biomass and hydrogen mitigate exposure but require expensive burner retrofits and, in hydrogen’s case, infrastructure that remains nascent. Volatility therefore suppresses margin visibility and slows project sanctioning in the calcium oxide market.
*Our forecasts treat driver/restraint impacts as directional, not additive. The impact forecasts reflect baseline growth, mix effects, and variable interactions.
Calcium Oxide Market Segment Analysis
By End-user Industry:
Metallurgical Dominance Faces Structural HeadwindsThe Metallurgical segment accounted for 42.57% of calcium oxide market share in 2025, reflecting its critical function as a flux in BF-BOF steelmaking. Although the global shift toward EAF technology lowers lime intensity to 5-15 kg per ton of steel, India’s BF-centric expansion and persistent integrated capacity in China sustain absolute volume demand. Refractory-grade CaO for ladle linings commands price premiums, underpinned by quality certifications that limit new entrants.
Construction is energized by India’s 453-million-ton cement output and ASEAN’s infrastructure boom. Fertilizer and Chemicals is the fastest-expanding end-user industry, advancing at a 4.16% CAGR through 2031. Pulp and Paper mills retain stable quicklime usage of 80-120 kg per ton of pulp in kraft causticizing loops. Collectively, non-metallurgical industries provide diversification that cushions the calcium oxide market against steel-cycle volatility.



Geography Analysis
APAC Calcium Oxide Market
Asia-Pacific led the calcium oxide market with 49.32% of 2025 volume, anchored by China’s massive steel and cement sectors and India’s accelerating infrastructure pipeline. Ultra-low-emission mandates for Chinese cement kilns are generating fresh demand for FGD-grade lime even as construction growth moderates. India’s government has allocated USD 1.4 trillion under its National Infrastructure Pipeline, sustaining cement capacity additions and farm-lime distribution across 10 million hectares of acid soils.
North America Calcium Oxide Market
North America benefits from the Infrastructure Investment and Jobs Act, which funds highway resurfacing, bridge rehabilitation, and water-system upgrades, all of which employ CaO in asphalt modification and water-softening treatments. While the U.S. steel sector’s pivot toward EAF mini-mills reduces lime intensity, overall demand remains resilient due to automotive and appliance output. Mexico’s nearshoring-boosted construction growth prompted Grupo Calidra to expand Bajío capacity, reinforcing the regional calcium oxide market.
EMEA and South America Calcium Oxide Market
Europe operates under high energy costs and stringent carbon targets. Regulation 2024/2620 classifies mineral carbonates as permanent sinks, encouraging CCS-ready kilns and high-purity CaO for alkali-activated binders. Germany and France lead low-carbon cement trials, whereas Poland and Romania emphasize cost-competitive grades for steel. The Middle-East and Africa region, projected to grow at 3.98% CAGR, leverages Saudi Vision 2030 megaprojects and sub-Saharan soil-liming programs. South America’s demand hinges on Brazil’s Cerrado agriculture and Argentina’s lithium brine processing, both reliant on quicklime for pH moderation and impurity removal.

Value Chain Analysis
The calcium oxide value chain starts with securing high-calcium limestone or dolomite and developing quarry operations, followed by crushing, sizing, and calcination in shaft or rotary kilns. Producers then cool, screen, and grade output, including high-reactivity and high-purity streams, with downstream hydration into calcium hydroxide where required. Integrated suppliers such as Lhoist, Carmeuse, Graymont, Mississippi Lime, and Nordkalk combine quarry access with kiln assets to manage feedstock quality and supply continuity for metallurgical flux, FGD sorbents, water-treatment dosing, and construction soil stabilization.
Distribution relies heavily on bulk logistics (truck, rail, and, in some corridors, marine), with storage and handling designed to limit moisture pickup and maintain reactivity. The main bottlenecks are energy intensity (quicklime production depends on high-temperature calcination and is exposed to natural gas and coal costs), decarbonization-related capex (CCS readiness, oxyfuel, or electrification upgrades), and the high delivered-cost sensitivity of heavy, low-value bulk volumes over distance. These constraints tend to reinforce regional supply footprints and vertical integration, while technology partnerships aimed at lowering process CO2 have become more visible as compliance pressure increases.
Competitive Landscape
The calcium oxide market is moderately concentrated: the top five suppliers—Lhoist, Carmeuse, Graymont, Minerals Technologies Inc., and Mississippi Lime—command roughly 45% of global capacity. Capital is flowing into carbon-abatement projects rather than greenfield tonnage. Lhoist has earmarked EUR 250 million for a carbon-capture-ready dolime plant in Belgium that will sequester one million tons of CO₂ annually once fully online in 2031. Carmeuse has partnered with a European cement major to pilot calcium-looping at a French kiln, targeting commercial rollout by 2028.
Regional challengers capitalize on logistics: CAO Industries exploits Malaysia’s proximity to ASEAN construction hubs, while Grupo Calidra leverages rail links to Mexico’s steel belt. Technology disruptors such as Hoffmann Green are licensing clinker-free cement that replaces Portland-clinker with high-purity CaO, shrinking embodied carbon by 80% and monetizing EU carbon credits. The European Patent Office registered 47 lime-decarbonization patents during 2024-2025, signaling intensified R&D race around electric kilns, oxyfuel designs, and microwave calcination. In this landscape, producers with integrated quarries, multi-fuel kilns, and early-stage CCS pilots enjoy structural cost and compliance advantages.
Calcium Oxide Industry Leaders
Carmeuse
Lhoist
Minerals Technologies Inc.
GRAYMONT
Mississippi Lime Company d/b/a MLC.
- *Disclaimer: Major Players sorted in no particular order
Calcium Oxide Market Companies Covered in this Report
- AKJ Minchem Private Limited
- American Elements
- Astrra Chemicals
- CAO Industries Sdn Bhd
- Carmeuse
- GRAYMONT
- GREER LIME COMPANY
- Grupo Calidra
- Imerys
- Kemipex
- Lhoist
- Linwood Mining & Minerals Corporation
- Minerals Technologies Inc.
- Mississippi Lime Company d/b/a MLC.
- Nordkalk
- Pacific Lime and Cement Limited
- Pete Lien & Sons, Inc.
- Sibelco
- Sigma Minerals Ltd
- United States Lime & Minerals

Market Opportunities and Future Outlook
Decarbonization is creating an upgrade cycle for lime assets, with a premium niche for high-purity CaO used in low-carbon binders and carbon-looping concepts. The evidence in the segment includes Origen Power completing large-scale testing of a zero-emission oxyfuel lime kiln platform at EERC in North Dakota (January 2026) and thyssenkrupp Polysius with SMA Mineral starting work on a 120 tpd Electric Arc Calcination (EAC) pilot plant in Mo i Rana, Norway (December 2025). On the supplier side, Maerz commissioned two 800 tpd lime kilns for Jiangsu Huaye Calcium Industry in Jiangsu, China (April 2026) and commissioned the first EcoKiln Ready unit at Schaefer Kalk Malaysia (June 2026), showing that new kiln configurations are being designed with oxyfuel and CCUS transitions in mind.
Commercial whitespace is also apparent where demand is growing, but freight economics and tightening specifications limit nearby supply. Maerz upgrading an older kiln for Grupo Calidra at La Laja, Argentina (May 2026) reflects how producers are extending asset life while improving energy performance and product quality, helping them meet FGD-grade and high-reactivity requirements without relying only on greenfield builds. With Asia-Pacific holding 49.32% of 2025 volume and emissions-driven consumption rising across utilities and cement kilns, localized capacity additions, retrofit programs, and higher-grade product streams (including CaO purity levels above 90% required for looping and specialty applications) are the most actionable paths for suppliers to capture value under tightening energy and CO2 constraints.
Recent Industry Developments in Calcium Oxide Market
- June 2026: Lhoist North America and Martin Marietta Materials announced a definitive agreement to combine their lime and building materials platforms, consolidating industrial lime operations and strengthening logistics reach across North America. The announcement points to ongoing consolidation as producers seek scale and asset integration to support decarbonization investments across industrial applications.
- July 2025: Pacific Lime and Cement Limited launched its calcium oxide business in Western Australia, targeting mining customers with an integrated supply chain model. The direct-to-site approach supports service levels for remote operations where reliable quicklime supply matters for processing and environmental control. It also adds regional competitive pressure in a market where logistics costs and reliability influence supplier selection.
- June 2024: Grupo Calidra commissioned a new Maerz lime calcination kiln at its La Laja plant in San Juan, Argentina, with 600 tons per day of high-grade, high-reactivity calcium oxide capacity (about 219,000 tons per year). The added capacity improves local supply for metallurgical and industrial demand while reducing reliance on longer-haul imports. It also raises the competitive bar for product reactivity and consistency across the Southern Cone.


Calcium Oxide Market Report Scope and Research Methodology
Market Definition and Coverage
For this methodology, the calcium oxide market covers commercially sold quicklime used as an input material across industry. Demand is tied to output in steel, construction materials, chemicals, and environmental treatment.
Scope exclusions: The sizing excludes limestone, hydrated lime, and other downstream calcium derivatives when they are sold as separate products rather than quicklime.
Segments Covered in This Report
- By End-user Industry
- Metallurgical
- Construction
- Fertilizer and Chemicals
- Pulp and Paper
- Refractory
- Other End-user Industries (Rubber, Food and Beverages)
- By Geography
- Asia-Pacific
- China
- India
- Japan
- South Korea
- ASEAN Countries
- Rest of Asia-Pacific
- North America
- United States
- Canada
- Mexico
- Europe
- Germany
- United Kingdom
- Italy
- France
- Russia
- Spain
- Rest of Europe
- South America
- Brazil
- Argentina
- Rest of South America
- Middle-East and Africa
- Saudi Arabia
- South Africa
- Rest of Middle-East and Africa
- Asia-Pacific
Data Sources, Market Sizing, and Validation
Desk Research
Desk work started with building a fact base on lime and calcium oxide production, trade flow direction, and key consuming industries, so the model is anchored to visible industrial activity. We relied on public sources such as the USGS for minerals and lime statistics, UN Comtrade for trade data, World Steel Association steel output series, and the US EPA plus EU industrial emissions references that point to treatment-related demand.
To tighten assumptions, we also reviewed company filings and investor presentations for capacity additions, kiln utilization commentary, and regional mix. We then used trade association pages and reputed press for plant starts and policy changes. In a few cases, analysts used paid subscriptions for company financials and intelligence, patent databases, and shipment-level import and export records to cross-check production footprints and trade intensity. These desk sources are illustrative, and many other public references were used for collection, validation, and clarification during the research.
Primary Interviews and Surveys
Primary work focused on interviews and surveys with calcium oxide producers, distributors, and large end users in steel, construction materials, chemicals, and water and flue gas treatment. Since this is a global market, inputs were validated across APAC, EMEA, and the Americas, and then used to confirm average selling price ranges, typical contract structures, and the practical split between captive and merchant quicklime volumes.
Distribution of primary research fieldwork respondents
| Company type | Respondent position | Region |
|---|---|---|
| Top tier: 30% | CXOs: 18% | APAC: 50% |
| Mid tier: 51% | Functional/Unit leaders: 25% | EMEA: 29% |
| Smaller Players: 19% | Managers: 57% | Americas: 21% |
Market-Sizing & Forecasting
Sizing was first built using a top-down structure where steel output, cement and construction activity indicators, and known environmental treatment demand were used to reconstruct the addressable consumption pool for quicklime, and then translated into volume and value. After the core total was formed, it was corroborated with selective bottom-up approximations, such as supplier roll-ups in sampled countries, channel checks on merchant shipments, and sampled price-per-ton ranges applied to implied volumes.
A few practical variables were treated as the main model levers, because they connect directly to calcium oxide pull. These included crude steel production (as a proxy for flux needs), construction and cement production momentum, water and wastewater treatment activity levels, flue gas desulfurization and similar emission-control intensity, and energy and carbon cost pressure that affects kiln operating rates and pricing. Forecasts used scenario analysis based on expert consensus on how these drivers move by region, and then the assumptions were converted into year-by-year demand and price paths. Where bottom-up visibility was weak, gaps were handled by applying conservative utilization and trade-share ranges that were rechecked through follow-up calls before finalizing totals.
Data Validation & Update Cycle
Outputs were checked in more than one way so the final numbers do not rely on a single data series. Analysts compared implied quicklime demand against independent signals like steel output trends, trade movements, and visible capacity changes, and then investigated unusual jumps that did not match those indicators.
Before sign-off, assumptions and calculations go through stepwise internal review. Any large variance triggers a re-contact with industry participants to confirm what changed and why. The report is refreshed annually, and interim updates are done when material events occur, such as major kiln shutdowns, plant starts, or policy shifts that affect environmental treatment demand. Right before delivery, a fresh pass is completed so clients receive the latest updated view.
Mordor Intelligence's Calcium Oxide Market Size Compared Against Other Published Estimates
Published market sizes for calcium oxide often look different because the unit of measurement, product boundaries, and what is counted as market sales can shift from one publisher to another. Differences also come from how prices are built up across regions and how often assumptions are refreshed when energy costs and industrial output change.
The key gap drivers in this market are usually whether the estimate is volume-first (tons) or value-first (USD), whether captive quicklime used inside steel and cement sites is included as part of market value, and whether hydrated lime and other calcium derivatives are mixed into the same number. Currency timing and the treatment of contract pricing versus spot pricing also move totals, especially when fuel costs swing. Some estimates extend forecast assumptions without revalidating kiln utilization and trade intensity each year.
The table below summarizes how these methodological differences show up in reported market totals.
Benchmark comparison
| Source | Market Size | Gaps in Research Methodology |
|---|---|---|
| Mordor Intelligence | USD 374.27 M (2026) | |
| Global Consultancy A | USD 5.33 B (2025) | Value-only sizing can be higher when captive consumption is monetized and when adjacent lime products are grouped, which also amplifies the impact of assumed price per ton levels. |
| Research Platform B | USD 5.17 B (2024) | A different base year and a broader product and end-use interpretation can shift totals, and the spread widens if price progression is driven mainly by headline inflation rather than energy-linked kiln economics. |
The table shows that most of the spread is explained by unit choice and what gets treated as a sellable market number, especially around captive volumes and adjacent lime products. When volumes are modeled from steel, construction, and treatment demand indicators and then priced using region-specific ranges that are rechecked with industry contacts, the result stays traceable to real consumption signals, which is the approach applied here by Mordor Intelligence.


Key Questions Answered in the Report
How large is the calcium oxide market?
The calcium oxide market stands at 374.27 million tons in 2026 and is projected to reach 437.05 million tons by 2031, with a 3.15% CAGR.
Which region contributes the most to global calcium oxide demand?
Asia-Pacific leads with 49.32% of 2025 volume thanks to China’s steel and India’s cement sectors.
What is driving the fastest growth in end-use demand?
Precision agriculture is lifting Fertilizer and Chemicals demand, projected to expand at 4.16% CAGR to 2031.
How are emission rules influencing calcium oxide consumption?
Stricter SO₂ caps in the U.S., EU, and China are spurring installations of lime-based flue-gas-desulfurization systems, creating a compliance-driven demand floor.
Page last updated on:


 Your data is secure and never sold or shared.


