
Building Insulation Materials Market Size and Share
Market Overview
| Study Period | 2021 - 2031 |
|---|---|
| Market Size (2026) | USD 33.79 Billion |
| Market Size (2031) | USD 40.99 Billion |
| Growth Rate (2026 - 2031) | 3.94 % |
| Fastest Growing Market | Asia Pacific |
| Largest Market | Europe |
| Market Concentration | Medium |
Major Players *Disclaimer: Major Players sorted in no particular order Image © Mordor Intelligence. Reuse requires attribution under CC BY 4.0. | |
Building Insulation Materials Market Analysis by Mordor Intelligence
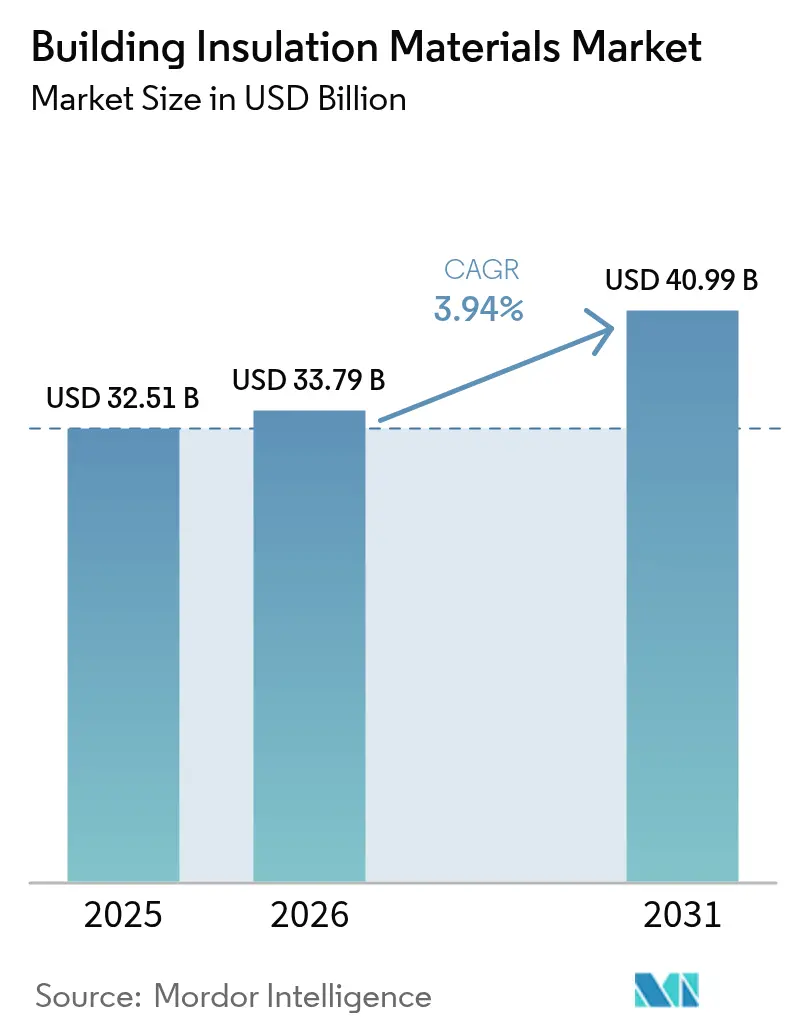
The Building Insulation Materials Market size is expected to increase from USD 32.51 billion in 2025 to USD 33.79 billion in 2026 and reach USD 40.99 billion by 2031, growing at a CAGR of 3.94% over 2026-2031. Demand is migrating from discretionary spending toward mandated compliance as energy-performance codes tighten worldwide. Material suppliers are reformulating foams to meet low-GWP blowing-agent rules, while contractors push mineral and fiber products that avoid future regulatory risk. Petrochemical price swings and labor shortages are compressing margins, elevating prefabricated panels and digital specification tools that save time on-site. Asia-Pacific’s dual-carbon policies and North American retrofit incentives underpin medium-term volume growth, although installation-cost inflation continues to slow adoption in price-sensitive regions.
Key Report Takeaways
- By material type, fiberglass led with 34.65% of the building insulation materials market share in 2025, while polystyrene is projected to expand at a 4.18% CAGR through 2031.
- By application, roof installations captured a 29.19% share in 2025; acoustic partition and HVAC duct demand are advancing at a 4.85% CAGR over 2026-2031.
- By end-user, residential construction accounted for a 56.77% share in 2025 and is growing at a 4.05% CAGR to 2031.
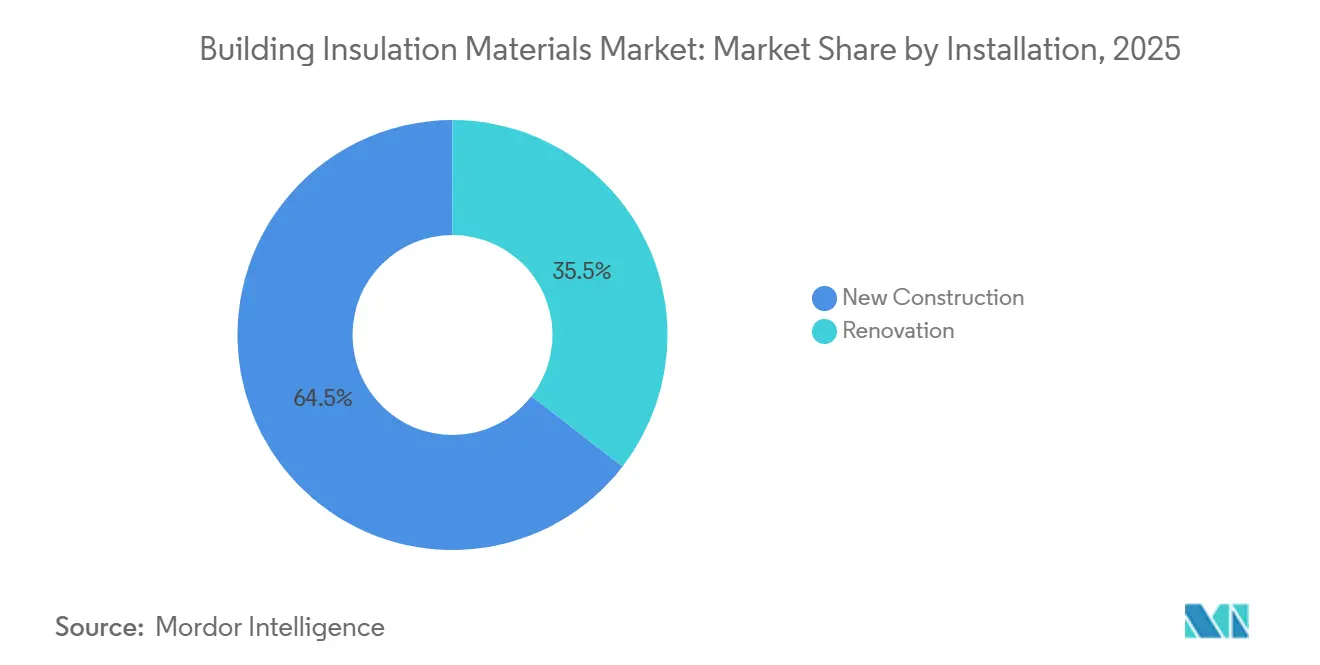
- By installation, new construction held a 64.52% share in 2025, whereas renovation is set to rise at a 5.36% CAGR through 2031.
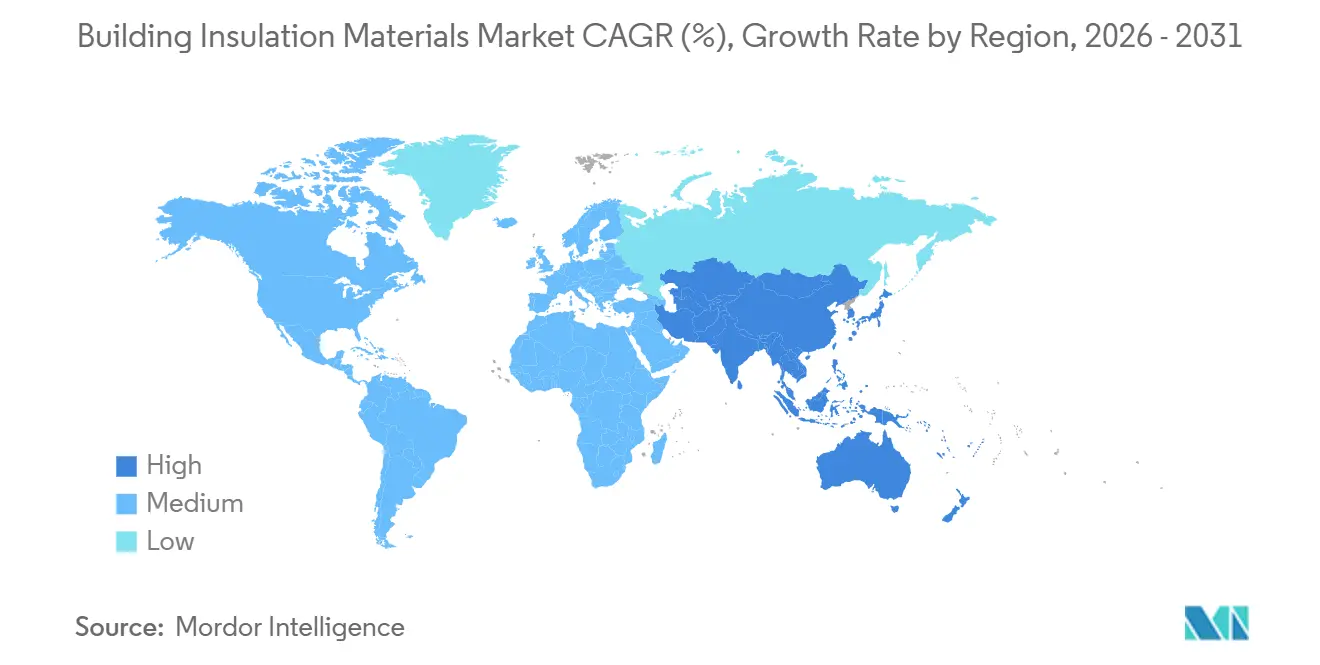
- By geography, Europe retained a 36.91% share in 2025, yet Asia-Pacific is tracking the fastest growth at a 4.89% CAGR to 2031.
Note: Market size and forecast figures in this report are generated using Mordor Intelligence’s proprietary estimation framework, updated with the latest available data and insights as of 2026.
Market Trends and Insights
Drivers Impact Analysis of Building Insulation Materials Market*
| Drivers | (~) % Impact on CAGR Forecast | Geographic Relevance | Impact Timeline |
|---|---|---|---|
| Growing Demand for Energy Efficient Buildings | +1.2% | Global, with peak intensity in EU, California, Japan | Medium term (2-4 years) |
| Increasing Green Retrofitting Incentives in North America | +0.8% | North America, spill-over to Canada and Mexico | Short term (≤ 2 years) |
| Increasing Government Support for Eco-Friendly and Sustainable Materials | +0.6% | EU, APAC core (China, South Korea), emerging in MEA | Long term (≥ 4 years) |
| Growing Preference for Low-VOC Bio-based Foams | +0.4% | North America and EU, early adoption in Australia | Medium term (2-4 years) |
| Rising Infrastructure and Industrialization in Asia-Pacific | +1.1% | APAC core (China, India, ASEAN), spill-over to South Asia | Long term (≥ 4 years) |
| Source: Mordor Intelligence | |||
Growing Demand for Energy-Efficient Buildings
Forty-seven countries strengthened envelope standards in 2024 as buildings consumed 30% of global final energy[1]International Energy Agency, “Energy Efficiency 2024,” iea.org. California’s Title 24-2025 increased attic minimums to R-49, displacing lower-value fiberglass in favor of blown-in cellulose[2]California Energy Commission, “2025 Building Energy Efficiency Standards,” energy.ca.gov. The EU EPBD recast obliges member states to upgrade 3% of public floor area each year, adding roughly 240 million m² of façade insulation by 2030. Japan now requires third-party certification for non-residential structures above 300 m², which is accelerating continuous-insulation systems that eliminate thermal bridges. These rules collectively position high-R-value products as default specifications rather than premium add-ons.
Increasing Green Retrofitting Incentives in North America
The U.S. Inflation Reduction Act offers a 30% tax credit on insulation materials up to USD 1,200 annually, while the 179D deduction pays USD 5 per square foot for deep-energy retrofits. Canada’s Greener Homes Grant provided USD 3,700 equivalent per homeowner in 2024-2025 and drove attic and basement projects where heat loss surpasses 35%. Utility rebates such as Pacific Gas & Electric’s USD 0.15 per square foot wall-cavity incentive shorten payback periods to under five years. These fiscal levers have shifted insulation from a long-term payback purchase to near-term cash-flow positive upgrades, lifting renovation demand ahead of the new-build cycle.
Increasing Government Support for Eco-Friendly and Sustainable Materials
From 2027 the EU Construction Products Regulation will require environmental product declarations for all insulation, disadvantaging high-embodied-energy foams. South Korea’s Green Building Certification System grants bonus points for bio-based content above 25%. China’s 14th Five-Year Plan targets 30% recycled content in thermal insulation by 2025. Germany’s BEG subsidy adds five percentage points for materials certified under QUV, steering buyers toward mineral wool. Collectively, procurement rules are embedding circularity and life-cycle carbon limits into every specification.
Growing Preference for Low-VOC Bio-based Foams
California’s Section 01350 caps VOC emissions at 0.5 mg/m³, excluding many traditional polyurethane foams from schools and hospitals. LEED v4.1 supplies up to three credits for disclosed ingredient hazards, steering architects toward soy-based and mycelium foams. Covestro’s cardyon polyol, which replaces 20% of fossil feedstock with captured CO₂, won approvals across 12 U.S. states in 2025. Although bio-based options still cost 25-35% more than petrochemical foams, tightening IAQ limits are transferring that premium from the contractor to the code ledger.
Restraints Impact Analysis of Building Insulation Materials Market*
| Restraints | (~) % Impact on CAGR Forecast | Geographic Relevance | Impact Timeline |
|---|---|---|---|
| High Materials and Installation Cost | -0.9% | Global, acute in emerging markets with limited skilled labor | Short term (≤ 2 years) |
| Availability of Affordable Alternatives | -0.5% | Price-sensitive markets in South America, MEA, South Asia | Medium term (2-4 years) |
| Regulatory Scrutiny on Global Warming Potential of Blowing Agents | -0.3% | EU, North America, Japan; phased rollout in developing economies | Long term (≥ 4 years) |
| Source: Mordor Intelligence | |||
High Materials and Installation Cost
Spray polyurethane foam averages USD 1.50-2.00 per board foot installed in the United States, double fiberglass batts, while delivering only 30-40% higher R-value. Contractor shortages left North America 15,000 insulators short in 2025, pushing lead times to 12 weeks. Glass-fiber rovings rose 9% on Europe’s energy spike, and styrene volatility added USD 80 per cubic meter to foam costs. These economics split the market into premium projects that adopt aerogels and value segments that postpone upgrades.
Availability of Affordable Alternatives
Reflective bubble wraps at USD 0.30-0.50 per square foot meet radiant-barrier codes in hot climates and are displacing rigid foam in U.S. attics. Recycled denim batts cost 10-15% less than fiberglass yet comply with ASTM C764. Emerging-market builders substitute rice husk or coconut coir at one-third the cost of imported mineral wool. Fourteen U.S. states now credit the inherent R-value of mass timber, reducing the amount of supplementary insulation required.
*Our forecasts treat driver/restraint impacts as directional, not additive. The impact forecasts reflect baseline growth, mix effects, and variable interactions.
Building Insulation Materials Market Segment Analysis
By Material Type:
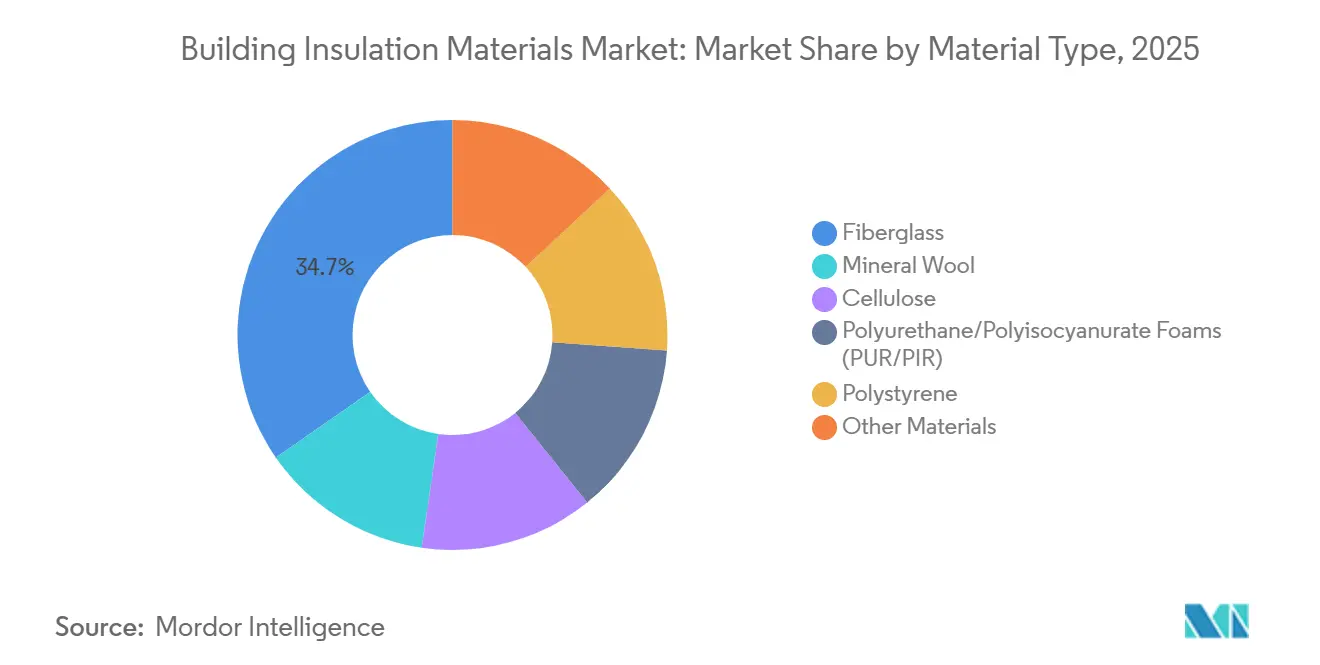
Fiberglass Anchors Volume, Foams AccelerateFiberglass held 34.65% of the building insulation materials market share in 2025, reflecting its low installed cost and contractor familiarity. Polystyrene materials are forecast to grow at a 4.18% CAGR through 2031 as continuous-insulation codes favor rigid boards that break thermal bridges. Mineral wool volume climbed 11% in European high-rise retrofits after tighter flame-spread rules. Polyurethane and polyisocyanurate foams are transitioning to HFO blowing agents, while aerogels and vacuum panels take niche share in space-constrained retrofits.
The building insulation materials market size for premium aerogel solutions commands 40-50% price premiums. Contractors default to fiberglass in code-minimum residential walls, reserve polystyrene for R-30+ commercial envelopes, and adopt bio-based foams for green-certified projects. Mineral wool’s non-combustibility exempts it from costly intumescent coatings, giving it an embedded cost edge where fire testing is strict.



By Application:
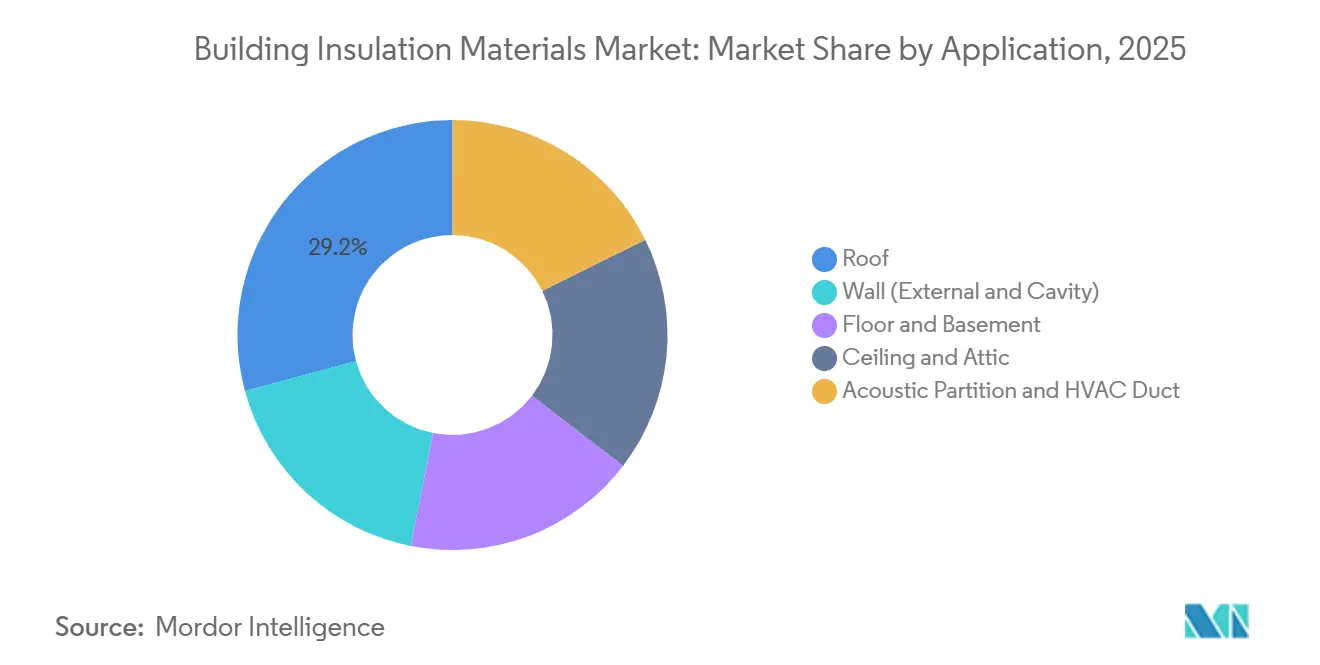
Roofs Dominate, Acoustic and HVAC Lead GrowthRoof assemblies captured 29.19% of the 2025 demand. However, acoustic partitions and HVAC duct wraps are projected to expand at a 4.85% CAGR as open-plan retrofits seek better sound privacy and ASHRAE 90.1-2022 tightens duct leakage limits. Wall insulation applications are mainly driven by EU façade upgrades, which account for a significant share. Floor and basement products grow modestly where frost-protected foundations need under-slab foam.
Ceiling and attic applications favor blown-in cellulose that trims labor costs by 30%. LEED’s new Acoustic Performance credit is pivoting commercial builders toward mineral-wool batts and tiles. The building insulation materials market size for HVAC wraps is poised to reach USD 5 billion by 2031 as data centers specify R-6 duct jackets to cut fan energy, while cool-roof assemblies are pulling polyiso into steep-slope housing.
By End-User:
Residential Holds the Lion’s ShareResidential construction represented 56.77% of 2025 revenue and is advancing at 4.05% CAGR through 2031 on net-zero mandates and aggressive retrofit subsidies. Commercial and civic buildings account for the balance, with office-to-residential conversions generating full envelope re-insulation.
Single-family homes are adopting spray foam faster than multi-family projects because custom builders target low HERS scores. Multi-family relies on fiberglass and rigid foam to manage costs, while manufactured housing is moving to thicker wall batts after the 2024 HUD update. Non-residential retrofits center on adaptive reuse: Kingspan projects that 120 million ft² of U.S. space will require new façades by 2028.
By Installation:
Renovation Surpasses New-Build GrowthNew construction delivered 64.52% of 2025 volume, yet renovation is set to grow faster at 5.36% CAGR through 2031 as fiscal incentives collide with aging building stock. Germany’s BEG program, France’s MaPrimeRénov, and U.S. utility pay-for-performance schemes compress paybacks below six years.
Retrofit complexity adds lead-paint and asbestos abatement costs, but prefabricated panels such as Kingspan’s QuadCore reduce on-site labor by 35% and mitigate schedule risk. The building insulation materials market size for renovation projects now exceeds USD 18 billion and will widen its lead as interest-rate volatility tempers new-build starts.
Geography Analysis
Europe Building Insulation Materials Market
Europe held 36.91% of 2025 revenue as the EPBD recast steers every member state toward zero-emission buildings by 2030. Germany processed 420,000 retrofits in 2024 under BEG, and France’s ban on F- and G-rated rentals from 2025 affects 4.8 million dwellings. Sweden now requires U-values below 0.15 W/m²K, achieved only with thick mineral wool or vacuum panels.
APAC Building Insulation Materials Market
Asia-Pacific is the fastest-growing region at 4.89% CAGR, propelled by China’s plan for 75% of urban buildings to meet green standards by 2025. India’s 2024 code extension covers commercial buildings above 100 m² and tightens wall U-values to 0.40 W/m²K. Japan requires new non-residential buildings to beat baseline energy use by 20% from 2025. Emerging ASEAN markets adopt EDGE and Green Mark in premium projects, though residential penetration remains below 15%.
The Americas and MEA Building Insulation Materials Market
North America commands a significant market share, with growth rooted in tax-driven retrofits rather than new homes, as mortgage rates dampen housing starts. Canada’s interest-free loans up to USD 29,600 are targeting 9.5 million pre-1980 homes. Mexico’s updated NOM-020-ENER introduces mandatory envelope resistance in air-conditioned zones. South America and MEA together contribute under 10% but show episodic surges; Saudi Arabia’s code now mandates R-13 walls in all government projects, relying on 60% imports.

Regulatory Landscape
Building insulation demand is increasingly tied to mandatory building energy performance rules and embodied-carbon disclosure requirements. In Europe, the recast Energy Performance of Buildings Directive (EU/2024/1275) entered into force and must be transposed into national law by 29 May 2026, pushing member states to tighten minimum energy performance requirements. This has a direct knock-on effect on roof and attic insulation specifications through both renovation and new-build compliance.
Regulation is also shifting from operational energy toward life-cycle reporting. Commission Delegated Regulation (EU) 2026/52 (adopted 16 December 2025) establishes a Union framework for national calculation of life-cycle global warming potential of buildings, integrating EN 15978:2011. As a result, verified environmental data for insulation products carries more weight. In the United States, EPA procurement and labeling alignment has raised the bar for eligible low-embodied-carbon construction materials. From 1 January 2026, EPA-recognized Product Category Rules (PCRs) for construction materials, including insulation, must conform with ISO/TS 14027:2017 to participate in the federal program framework.
Value Chain Analysis
The value chain runs from petrochemical and mineral feedstocks (styrene, polyols/isocyanates, glass cullet, basalt/slag, paper fiber) through blowing agents and additives, including low-GWP alternatives. It then covers insulation manufacturing and conversion (batts/rolls, boards, spray foams, composites), third-party testing and certification, distribution via building-product dealers, big-box retail, and direct-to-contractor channels, and finally installation by specialized contractors and general builders. At the product and system level, quality assurance and code compliance (fire, VOC/IAQ, and thermal performance testing) are increasingly deciding what gets specified. This tends to shift bargaining power toward suppliers that can provide verified documentation and BIM-ready submittals.
Upstream and midstream strategies are also leaning toward raw-material security and circularity to manage cost volatility and compliance risk. In EPS, BEWI agreed in February 2025 to combine raw material businesses with The Rock Capital Group, creating a European EPS production entity with 375,000 tonnes of annual capacity. In polyurethane, Plixxent signed a five-year agreement in July 2025 to source plant-based FDCA from Avantium for sustainable insulation foams, pointing to longer-term contracting for alternative feedstocks. For end-of-life and internal scrap, Unilin opened a full-scale PIR insulation recycling plant in Desselgem, Belgium (July 2025), chemically recycling PIR waste boards back into raw materials and demonstrating industrial-scale recycling pathways for thermoset insulation boards.
Competitive Landscape
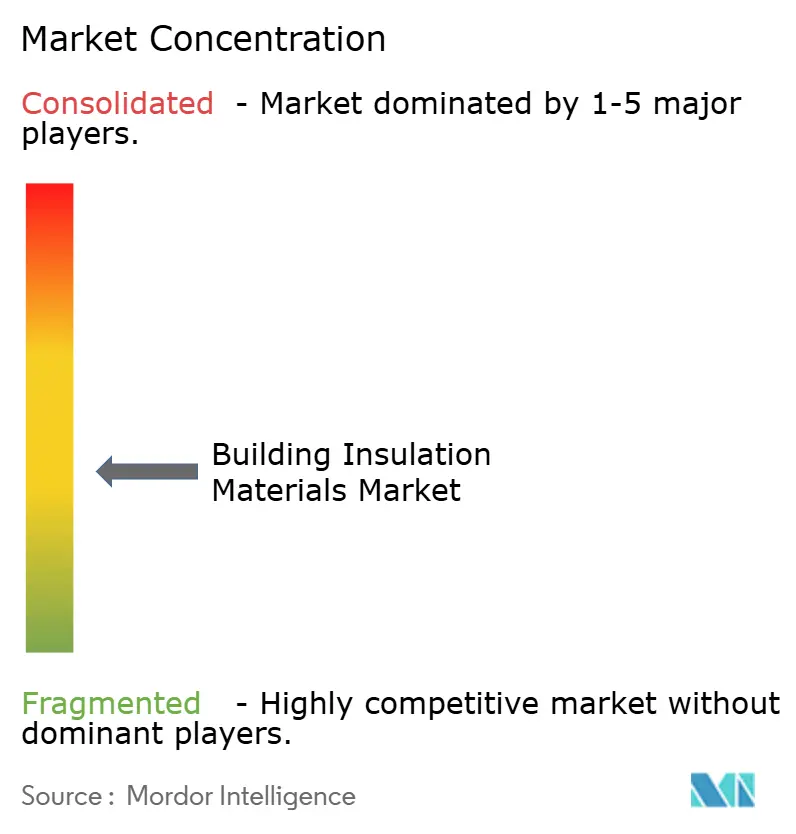
The building insulation materials market is moderately fragmented. Owens Corning’s 2025 purchase of an Indian glass-fiber plant cut costs 8% and bolstered its Asia-Pacific play. Kingspan’s pentane-blown QuadCore captured 12% of UK commercial work by pre-qualifying for BREEAM Excellent. Saint-Gobain leverages direct-to-contractor rebates to lock in 70% repeat sales.
Specialty entrants fill high-performance gaps. Aspen Aerogels supplies R-10 per inch blankets that preserve historic façades. Ecovative’s mycelium foam delivers R-3 per inch at 40% lower embodied carbon than EPS, securing pilots with three U.S. developers in 2025. ROCKWOOL’s BIM-enabled Product Pilot slashed architect specification time 50% and reached 18% European adoption within a year.
Patent filings for 50-year-life vacuum panels rose 28% over 2024-2025. Private-label fiberglass at 15-20% discounts is eroding branded share in North American big-box channels. At the same time, upstream styrene swings and HFO premiums strain foam-maker margins. The competitive emphasis is shifting from commodity volume toward differentiated low-GWP formulas and digital tools that de-risk specification.
Building Insulation Materials Industry Leaders
Owens Corning
Kingspan Group
Saint-Gobain
ROCKWOOL A/S
Knauf Group
- *Disclaimer: Major Players sorted in no particular order
Building Insulation Materials Market Companies Covered in this Report
- Armacell
- Aspen Aerogels Inc.
- Atlas Roofing Corporation
- BASF SE
- Beijing New Building Materials Public Limited Company
- Cellofoam North America Inc.
- Covestro AG
- Dow
- DuPont
- GAF Materials LLC
- Holcim
- Huntsman International LLC
- Johns Manville
- Kingspan Group
- Knauf Group
- Owens Corning
- Recticel NV/SA
- ROCKWOOL A/S
- Saint-Gobain
- Synthos

Market Opportunities and Future Outlook
A clear whitespace is emerging around low-embodied-carbon and disclosed-performance insulation as regulations move beyond U-values toward life-cycle metrics and verifiable product declarations. The EU framework is tightening disclosure and building-level life-cycle GWP calculations through the EPBD trajectory and the EU 2026/52 delegated framework. In the United States, the federal approach is reinforcing ISO-aligned PCR requirements for eligibility in low-embodied-carbon labeling and procurement programs from 1 January 2026. Together, these changes widen the addressable market for suppliers that can offer EPD-ready portfolios across foams, mineral wool, and fiber products, as well as system solutions that pair insulation with airtightness and moisture management.
Capacity localization and electrified manufacturing investments create another opportunity because they address cost, availability, and emissions at the same time. In North America, ROCKWOOL broke ground in April 2026 on a USD 175 million stone wool facility in Wallula, Washington, using electric melting technology, and IKO broke ground in June 2026 on a USD 45 million, 67,000 square-foot XPS plant in Brantford, Ontario. Renovation-driven demand and labor constraints also open room for solutions that reduce site time, including prefabricated insulated panels and high-coverage blown-in systems. In May 2025, Knauf North America announced a new blowing wool line in Shelbyville, Indiana, scheduled for commissioning in Q2 2026, aligning supply additions with retrofit-heavy insulation consumption.
Recent Industry Developments in Building Insulation Materials Market
- July 2026: Saint-Gobain entered into a definitive agreement to acquire a glass fiber plant in Lexington, North Carolina to supply its CertainTeed operations. The move improves local access to a critical insulation input and supports tighter lead times and specification responsiveness in North America.
- May 2026: ROCKWOOL A/S signed an agreement to acquire Ravago’s stone wool factory in Hungary (40,000 tonnes annual capacity), with completion targeted for Q4 2026. The deal expands ROCKWOOL’s regional manufacturing footprint and adds flexibility for serving European demand shaped by stricter building-energy rules.
- November 2025: Owens Corning closed its acquisition of Jiangsu Changhai Composite Materials for USD 215 million. The transaction improves glass-fiber supply economics in Asia-Pacific and supports cost-competitive insulation production as code-driven demand broadens across the region.


Building Insulation Materials Market Report Scope and Research Methodology
Market Definition and Coverage
This market covers the value of insulation materials used in building envelopes and building systems to reduce heat loss or gain, improve comfort, and meet energy-efficiency requirements. It includes products sold into new construction and renovation across residential and non-residential buildings.
Scope exclusions: We exclude industrial process insulation, transportation insulation, and insulation used mainly for non-building equipment applications.
Segments Covered in This Report
- By Material Type
- Fiberglass
- Mineral Wool
- Cellulose
- Polyurethane/Polyisocyanurate Foams (PUR/PIR)
- Polystyrene
- Other Materials (Cork, Aerogel and Vacuum Insulation Panels, Spray Foams, Hemp, Calcium-Silicate, etc.)
- By Application
- Roof
- Wall (External and Cavity)
- Floor and Basement
- Ceiling and Attic
- Acoustic Partition and HVAC Duct
- By End-User
- Residential
- Non-Residential
- Commercial
- Infrastructure
- Other Non-Residential Industries (Education, Healthcare, Civic and Religious,etc.)
- By Installation
- New Construction
- Renovation
- By Geography
- Asia-Pacific
- China
- India
- Japan
- South Korea
- ASEAN Countries
- Rest of Asia-Pacific
- North America
- United States
- Canada
- Mexico
- Europe
- Germany
- United Kingdom
- France
- Italy
- Spain
- Nordics Countries
- Rest of Europe
- South America
- Brazil
- Argentina
- Rest of South America
- Middle East and Africa
- Saudi Arabia
- South Africa
- Rest of Middle East and Africa
- Asia-Pacific
Data Sources, Market Sizing, and Validation
Desk Research
Desk work starts with mapping how insulation demand forms inside construction activity, and then linking it to measurable indicators. We lean on public building and housing starts, renovation activity, and building-permit trends from sources such as national statistics offices, the US Census Bureau construction releases, and Eurostat construction indicators.
To keep material-level assumptions realistic, we also check technical and regulatory signals from sources such as energy code publications, International Energy Agency building-energy reports, standards bodies, and peer-reviewed papers on thermal conductivity and R-value performance. Trade flows and supply shifts are reviewed through customs and UN Comtrade style trade statistics, supported by company annual reports, investor presentations, and reputed press. For calibration, we may reference paid subscriptions for company financials and patent databases to understand product mix shifts and innovation pace, and then apply that context to pricing and adoption assumptions. The sources listed here are illustrative, and many other public documents and datasets were used to collect, validate, and clarify inputs.
Primary Interviews and Surveys
Primary work focuses on translating the desk indicators into market-realistic adoption and pricing behavior. We speak with a mix of manufacturers, distributors, contractors, and specifiers, and then cross-check responses across major regions so local code impacts and renovation cycles are not overgeneralized.
These discussions are used to validate material substitution trends (for example, foam versus mineral wool), typical thickness and performance targets by application, and how prices are negotiated through channels for projects versus retail demand.
Distribution of primary research fieldwork respondents
| Company type | Respondent position | Region |
|---|---|---|
| Top tier: 38% | CXOs: 12% | APAC: 46% |
| Mid tier: 42% | Functional/Unit leaders: 42% | EMEA: 30% |
| Smaller Players: 20% | Managers: 46% | Americas: 24% |
Market-Sizing & Forecasting
Sizing is built using a top-down approach where construction output and renovation spend are reconstructed by region, and then translated into insulation demand using penetration rates and typical insulation intensity by building type and application. Because reporting categories vary by country, the model is structured so that assumptions can be adjusted at the country level before they are rolled up to regions.
To make the totals practical, we corroborate them with selective bottom-up checks, such as sampled average selling price times estimated volume for key material groups, plus channel feedback on the share of demand routed through contractors versus retail. Key inputs that typically move the model include new-build versus renovation mix, housing starts and floor area trends, energy-code tightening and enforcement pace, material-level price direction tied to resin and fiber inputs, and substitution between fiberglass, mineral wool, cellulose, and foam products based on fire and performance requirements. Where coverage gaps exist in smaller countries, we use proxy ratios from similar markets (climate zone, construction type, and code maturity) and then re-test those ratios through interviews.
Forecasts are prepared using scenario analysis, where construction activity outlooks and renovation policy funding are treated as the main demand drivers, and pricing is adjusted with expected cost pass-through behavior discussed by respondents. The final forecast path is selected only after the assumptions are consistent with what suppliers and installers say is achievable for the next planning cycle.
Data Validation & Update Cycle
Outputs are checked against independent signals so the story and the numbers match, and the mismatches are understood before sign-off. We compare implied insulation consumption trends with construction and renovation indicators, test whether pricing movement is consistent with raw material direction, and then review any outliers at the country and regional level.
If a variance is large, we re-check the conversion assumptions, revisit interview notes, and may re-contact sources to confirm whether the change is structural or temporary. Before publication, the full model goes through a step-by-step analyst review, and key calculations are recalculated to catch formula issues. Reports are refreshed annually, and interim updates are made when material events occur, such as major code changes, sharp feedstock price swings, or a meaningful shift in construction outlook.
Mordor Intelligence's Building Insulation Materials Market Size Versus Other Published Estimates
Published market values for building insulation materials can look far apart because different studies draw the market boundary in different places, and they also choose different price timing and conversion practices. Some estimates lean more on shipment-linked supply views, and others build from construction demand pools, so the totals can diverge even before forecasting choices are made.
Building-permit trends, renovation activity, and application-level insulation intensity checks are the evidence that tie the 2025 value in Mordor Intelligence to a defined demand pool, instead of being expanded by adjacent industrial insulation or broader thermal management categories.
Benchmark comparison
| Source | Market Size | Gaps in Research Methodology |
|---|---|---|
| Mordor Intelligence | USD 32.51 B (2025) | |
| Market Research Aggregator A | USD 39.98 B (2025) | This estimate appears to use a broader scope and higher growth framing, and it likely counts additional building-related insulation categories and wider application coverage, which lifts the starting-year value. |
| Industry Newswire B | USD 47.90 B (2025) | Newswire figures are often based on headline vendor inputs and rounded assumptions, and they can blend premium pricing and a wider material basket without clearly separating renovation intensity or country-level code enforcement effects. |
The table shows that the spread is mainly explained by what gets included as building insulation, and how pricing and coverage are treated across regions. Our approach stays traceable to construction activity, renovation mix, and application usage assumptions that can be reviewed and updated with new public signals and fresh interview checks.


Key Questions Answered in the Report
What is the projected value of the building insulation materials market in 2031?
The building insulation materials market is forecast to reach USD 40.99 billion by 2031 at a 3.94% CAGR over 2026-2031.
Which material currently holds the largest share?
Fiberglass commanded 34.65% global share in 2025 due to its low installed cost and contractor familiarity.
Why is renovation demand growing faster than new construction?
Retrofit tax credits, subsidy programs, and an aging building stock push renovation to 5.36% CAGR, outpacing new-build growth tied to slower housing starts.
Which region is expanding fastest?
Asia-Pacific leads with a 4.89% CAGR through 2031, driven by China’s dual-carbon goals and India’s tighter energy codes.
How are regulations influencing material choices?
Low-GWP mandates and VOC limits are steering buyers toward mineral wool, bio-based foams, and pentane-blown polyiso while phasing out high-GWP HFC foams.
What strategic moves define current competition?
Leaders invest in low-GWP technologies, backward integration to cut raw-material costs, and digital BIM tools that simplify specification and lock in repeat sales.
Page last updated on:


 Your data is secure and never sold or shared.


