
Breast Biopsy Devices Market Size and Share
Market Overview
| Study Period | 2020 - 2031 |
|---|---|
| Market Size (2026) | USD 1.35 Billion |
| Market Size (2031) | USD 1.72 Billion |
| Growth Rate (2026 - 2031) | 4.95 % |
| Fastest Growing Market | Asia Pacific |
| Largest Market | North America |
| Market Concentration | Medium |
Major Players *Disclaimer: Major Players sorted in no particular order Image © Mordor Intelligence. Reuse requires attribution under CC BY 4.0. | |
Breast Biopsy Devices Market Analysis by Mordor Intelligence
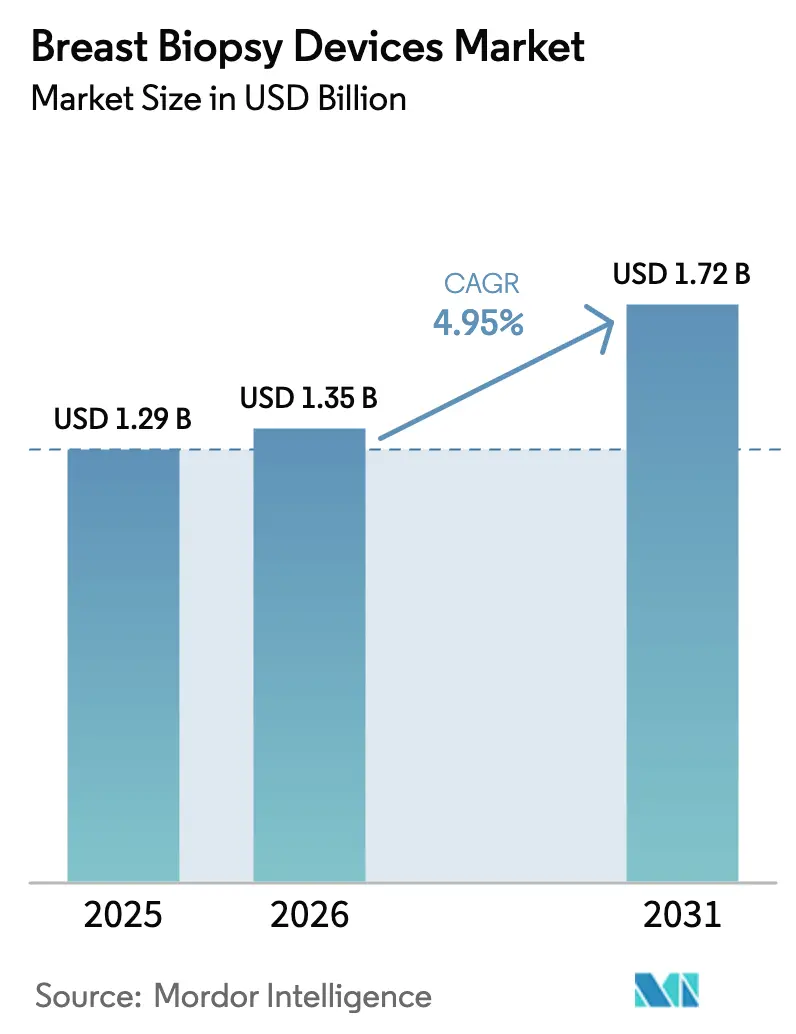
The breast biopsy devices market size is expected to grow from USD 1.29 billion in 2025 to USD 1.35 billion in 2026 and is forecast to reach USD 1.72 billion by 2031 at 4.95% CAGR over 2026-2031. Demand rises as health systems move from traditional tissue sampling toward AI-enabled, image-guided precision diagnostics that shorten procedure time and improve lesion targeting. Higher breast-cancer incidence among women under 55 and broader screening access in emerging economies heighten the need for minimally invasive sampling. Vacuum-assisted platforms gain traction because they deliver larger cores with fewer passes, while liquid-based techniques open a pathway to real-time molecular profiling that guides targeted therapy. Together, shifting clinical guidelines, growing reimbursement for percutaneous approaches and the rollout of AI-driven 3-D imaging keep the breast biopsy devices market on a steady growth trajectory.
Key Report Takeaways
- By product category, breast-biopsy needles led with 42.70% of breast biopsy devices market share in 2025; guidance and imaging systems are projected to expand at a 9.85% CAGR to 2031.
- By procedure, vacuum-assisted biopsy held 35.10% revenue share in 2025, while fine-needle aspiration biopsy records the highest projected CAGR at 9.05% through 2031.
- By technique, image-guided sampling captured 68.10% of the breast biopsy devices market size in 2025 and liquid biopsy is advancing at a 10.15% CAGR through 2031.
- By indication, suspicious microcalcifications accounted for 39.10% share of the breast biopsy devices market size in 2025, whereas recurrent breast cancer is tracking an 11.05% CAGR to 2031.
- By end user, hospitals and clinics held 52.30% revenue share in 2025; independent diagnostic centers are set to grow fastest at 9.20% CAGR through 2031.
- By geography, North America commanded 42.30% share of the breast biopsy devices market in 2025, while Asia-Pacific posts the highest 9.35% CAGR for 2026-2031.
Note: Market size and forecast figures in this report are generated using Mordor Intelligence’s proprietary estimation framework, updated with the latest available data and insights as of 2026.
Market Trends and Insights
Drivers Impact Analysis of Breast Biopsy Devices Market*
| Driver | (~) % Impact on CAGR Forecast | Geographic Relevance | Impact Timeline |
|---|---|---|---|
| Rising prevalence & awareness of breast cancer | +1.8% | Global, strongest in Asia-Pacific and emerging markets | Medium term (2-4 years) |
| Expanding reimbursement for image-guided biopsies | +1.2% | North America and Europe, extending into Asia-Pacific | Short term (≤ 2 years) |
| Accelerating shift toward vacuum-assisted systems | +0.9% | Global, led by North America and Europe | Medium term (2-4 years) |
| AI-enabled 3-D imaging and liquid-biopsy adoption | +1.1% | North America and Europe, spillover to Asia-Pacific | Long term (≥ 4 years) |
| Growing demand for liquid-biopsy companion diagnostics | +0.8% | Early uptake in developed markets, global potential | Long term (≥ 4 years) |
| Source: Mordor Intelligence | |||
Rising Prevalence & Awareness of Breast Cancer
Breast-cancer incidence is climbing in younger cohorts, especially in Asia where median onset now falls between ages 50-54, five to seven years earlier than in Western nations[1]. National screening programs broaden the candidate pool for biopsy, yet China’s participation rate remains 21.7%, signaling significant unmet need. Urban–rural disparity boosts demand for portable, cost-efficient equipment that can operate in secondary hospitals. Lower fertility rates and lifestyle shifts further elevate risk, making continual growth in biopsy procedures likely irrespective of population aging. Governments in India and Southeast Asia amplify awareness campaigns, accelerating equipment turnover as outpatient facilities invest in automated, AI-assisted systems to meet rising case volumes.
Expanding Reimbursement for Image-Guided Biopsies
Medicare covers percutaneous image-guided breast biopsy for BIRADS III–V lesions, providing a template many private payers and foreign insurers now follow. Vacuum-assisted stereotactic biopsies save USD 741 per case compared with surgical excision, strengthening the economic case for minimally invasive options[2]. Europe’s diagnosis-related groups also reward percutaneous sampling, while early directives in Japan and South Korea mirror the U.S. model. AI-based 3-D imaging tools remain variably covered, so vendors that secure billing codes gain a head start. Private-equity-funded imaging chains rely on stable reimbursement streams to finance center expansion and new equipment.
Accelerating Shift Toward Vacuum-Assisted Systems
Clinical studies show 99.2% sensitivity for vacuum-assisted stereotactic biopsy versus 97.7% for automated core needles, driving practitioner preference. Eleven-gauge directional devices avoid surgery in 76% of eligible cases and cut diagnostic costs by USD 264 per patient. Product refinements such as hydrogel-based markers that cling to tissue surfaces improve post-biopsy localization accuracy. When paired with digital breast tomosynthesis, vacuum-assisted kits detect lesions invisible on full-field mammography, extending the addressable population and propelling the breast biopsy devices market forward.
AI-Enabled 3-D Imaging and Liquid-Biopsy Adoption
Hologic’s Genius AI Detection 2.0 decreases false-positive flags and streamlines radiologist workflow. Virtual biopsy algorithms achieve 0.88 AUC while maintaining 99% sensitivity, potentially avoiding 13% of unnecessary procedures. Robotic needle steering for MRI-guided interventions limits targeting error to 2.2 mm, addressing breast deformation challenges[3]. Regulatory momentum continues: the FDA authorized liquid-biopsy companion tests such as FoundationOne Liquid CDx and Guardant360 CDx for breast indications, catalyzing investment in circulating-tumor-DNA assays. These advances reinforce a precision-medicine model where imaging and molecular tools converge, accelerating the breast biopsy devices market.
Restraints Impact Analysis of Breast Biopsy Devices Market*
| Restraint | (~) % Impact on CAGR Forecast | Geographic Relevance | Impact Timeline |
|---|---|---|---|
| Post-Biopsy Infection & Hematoma Risk | -0.7% | Global, with higher impact in resource-constrained settings | Short term (≤ 2 years) |
| High Capital Cost Of Stereotactic Tables | -0.9% | Emerging markets and smaller healthcare facilities | Medium term (2-4 years) |
| Limited Radiology Capacity In Low-Income Regions | -0.6% | Sub-Saharan Africa, rural Asia, Latin America | Long term (≥ 4 years) |
| Source: Mordor Intelligence | |||
Post-Biopsy Infection & Hematoma Risk
Hematomas develop in up to 94% of patients one week after vacuum-assisted biopsy, though most resolve within 21 days. Clinically significant bleeding affects 6.7% of stereotactic cases, with 96.2% classified as mild. Even minor events fuel patient anxiety and can deter follow-up screening. Infection rates remain low in high-income settings but rise where sterile protocols are inconsistent, prompting cautious rollout of advanced equipment in underserved regions.
Capital Cost & Limited Radiology Capacity
Prone stereotactic tables require high upfront spending and dedicated floor space, hampering adoption by rural hospitals and smaller diagnostics centers. Maintenance contracts and technologist training add to the total cost of ownership. Hub-and-spoke service models proposed for India mitigate some barriers but extend patient travel time. Workforce shortages compound the issue; Sub-Saharan Africa has fewer than one radiologist per 1 million inhabitants, limiting procedure capacity even when equipment is available. Collectively, capital constraints slow penetration of the breast biopsy devices market in emerging economies.
*Our forecasts treat driver/restraint impacts as directional, not additive. The impact forecasts reflect baseline growth, mix effects, and variable interactions.
Breast Biopsy Devices Market Segment Analysis
By Product:
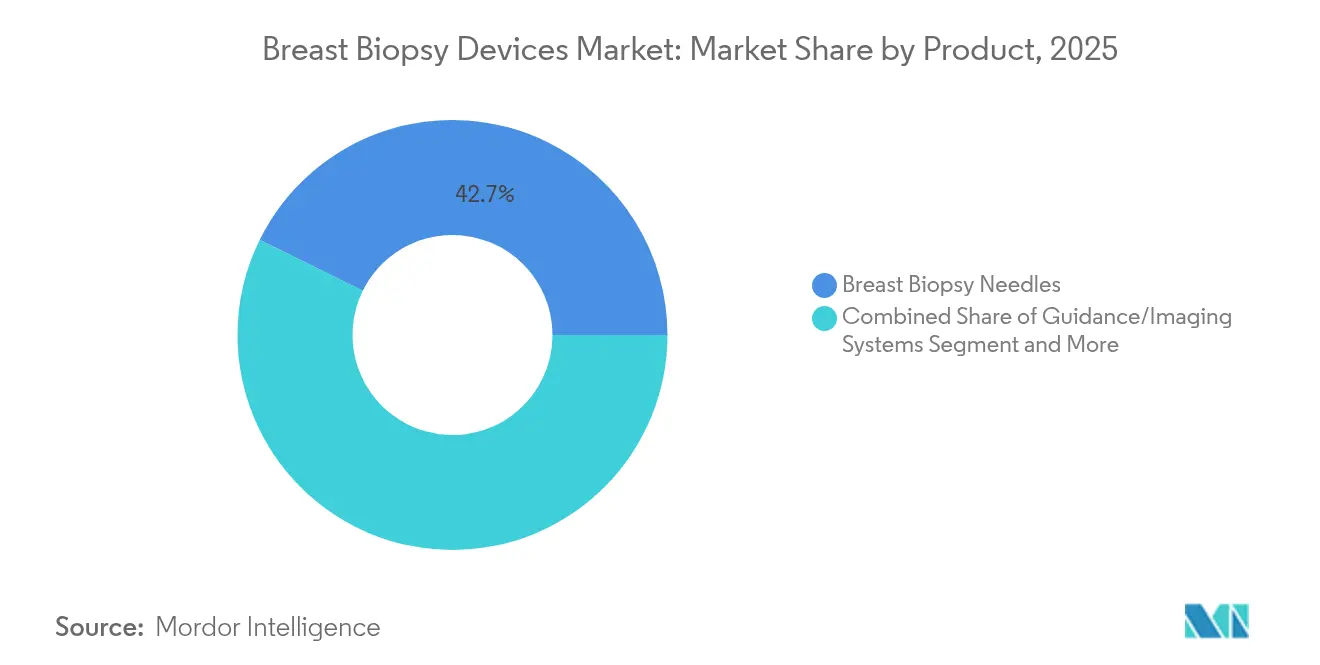
Guidance Systems Scale Fast as Needles Dominate VolumeBreast-biopsy needles retained 42.70% revenue in 2025, a testament to their consumable nature and essential role across every intervention. The breast biopsy devices market size for guidance and imaging systems, although smaller, is forecast to climb at 9.85% CAGR due to AI overlays, robotic controllers and multimodal 3-D visualization that shorten learning curves. Hospitals adopt integrated consoles that combine stereotactic, ultrasound and tomosynthesis modules, allowing seamless switching mid-procedure. Vendors differentiate through user-friendly dashboards, cloud-linked analytics and smaller form factors that fit outpatient suites. Single-use accessory kits are gaining favor among infection-prevention teams, pointing to resilient demand for disposable components linked to each guidance platform.
Healthcare enterprises value the revenue predictability of re-orderable needles but increasingly bundle those consumables with subscription software for workflow analytics. For example, an institution deploying AI-assisted consoles reports a 14% reduction in repeat biopsies, boosting payer confidence and broadening reimbursement eligibility. As guidance platforms carve out larger budgets, cross-selling opportunities multiply, reinforcing a virtuous cycle within the breast biopsy devices market.

By Procedure:
Vacuum-Assisted Biopsy Holds Leadership as FNAB AcceleratesVacuum-assisted biopsy (VAB) commanded 35.10% of breast biopsy devices market share in 2025, prized for extracting contiguous tissue cylinders that support histologic and molecular tests. Cost-effective kits with integrated clip-deployment mechanisms enable in-procedure marking, reducing recalls. Fine-needle aspiration biopsy (FNAB) logs the swiftest growth at 9.05% CAGR, fueled by its role in axillary-node staging and reduced anesthesia requirements. In low-resource settings, FNAB’s minimal consumable demand and short dwell time appeal to budget-conscious providers.
Future protocols combine FNAB with rapid onsite cytology to deliver same-day results, trimming surgical waitlists. Early adopters also explore molecular profiling from residual FNAB samples, extending clinical utility beyond cytology and expanding the breast biopsy devices market size attributed to disposables and ancillary reagents.
By Technique:
Image-Guided Sampling Dominates, Liquid Biopsy Gains GroundImage-guided approaches comprised 68.10% of overall sales in 2025. The breast biopsy devices market thrives on stereotactic, ultrasound and MRI targeting because precise localization curbs repeat procedures. Ultrasound guidance remains the workhorse for palpable or cystic masses, whereas tomosynthesis solves lesion overlap in dense breasts. Simultaneously, liquid biopsy posts a 10.15% CAGR as clinicians adopt circulating-tumor-DNA assays for refractory or metastatic disease, supported by FDA-cleared companion diagnostics. Blockchain-ready cloud platforms now link pathology labs with imaging centers to route plasma-based reports into electronic medical records, streamlining multidisciplinary decisions.
Automation stands out: robotic arms anchored to gantries can reposition in 3 seconds, empowering single-operator suites and raising weekly throughput by 18%. These efficiency gains keep image-guidance at the core of the breast biopsy devices market while liquid biopsy expands the use-case spectrum.
By Indication:
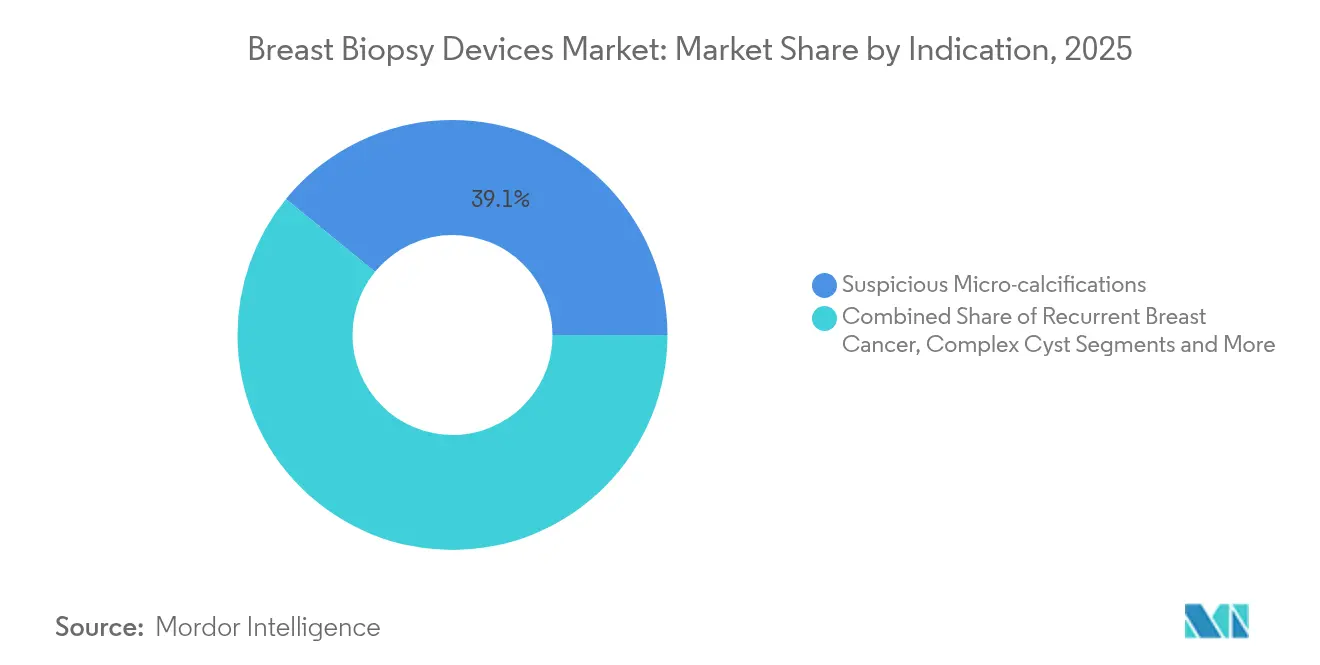
Microcalcifications Lead; Recurrent Cancer SurgesSuspicious microcalcifications represented 39.10% of biopsy volume in 2025, largely because widespread screening mammography detects clustered foci that require histologic verification. Recurrent breast cancer grows at 11.05% CAGR, reflecting longer survivorship and the need for biomarker testing when disease resurfaces. HER2 re-assessment using freshly sampled tissue drives repeat interventions, especially after therapies such as trastuzumab deruxtecan gain indications for ultralow HER2 expression Roche. Vacuum-assisted excision protocols for low-grade ductal carcinoma in situ also emerge, replacing lumpectomy in select cohorts and lowering hospitalization costs.
As precision oncology matures, clinicians request repeat biopsies to confirm evolving molecular profiles, enlarging the breast biopsy devices market. Companies integrating instant immunohistochemistry into core-sample workflows will benefit from this trend.
By End User:
Diagnostic Centers Close Gap on HospitalsHospitals held 52.30% revenue in 2025, reflecting established referral networks and the convenience of on-site pathology. Yet independent diagnostic centers demonstrate a 9.20% CAGR by offering streamlined scheduling, faster reporting and spa-like environments that ease patient anxiety. Private-equity-backed chains scale rapidly, using centralized purchasing to standardize equipment and negotiate bulk rates. Cloud-based AI decision-support tools let radiologists in regional hubs supervise multiple satellite sites, shrinking skill-gap barriers in rural regions and expanding the breast biopsy devices market.
Hospital outpatient departments respond by spinning off breast-care boutiques that mirror stand-alone centers’ efficiency while retaining brand loyalty. Strategic joint ventures, such as those between large hospital systems and specialty imaging networks, indicate the line between provider types will blur over the forecast horizon.
Geography Analysis
North America Breast Biopsy Devices Market
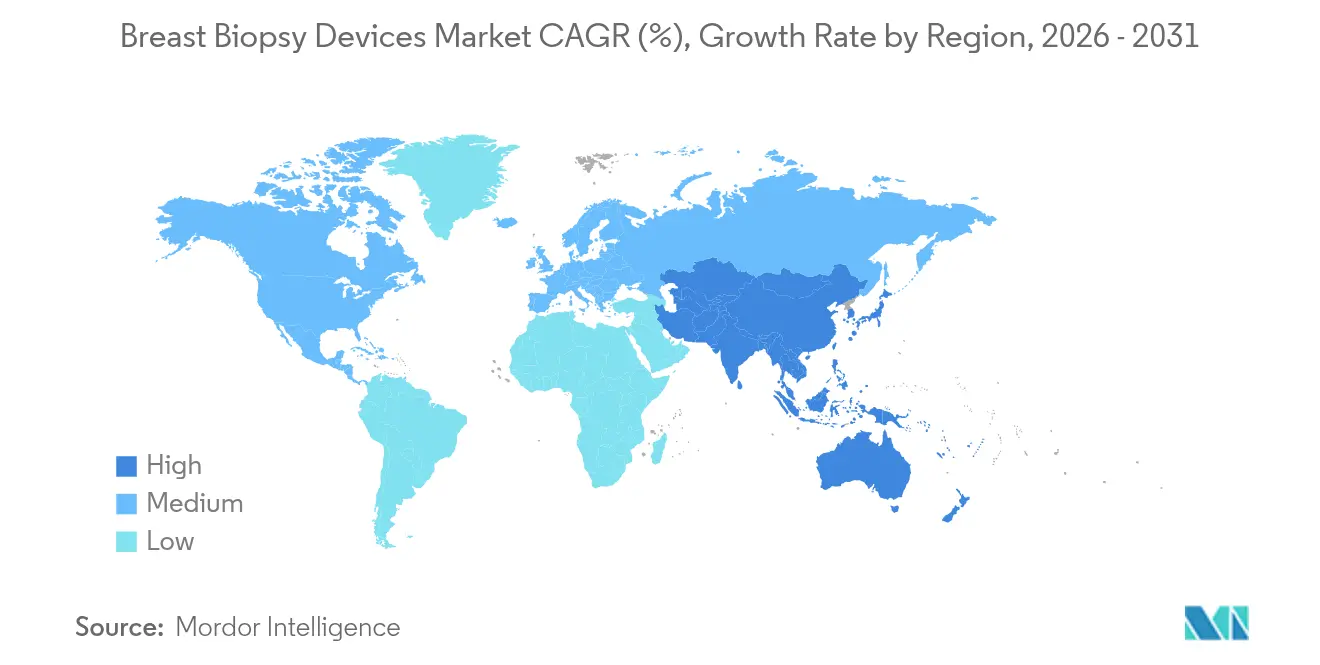
North America commanded 42.30% of 2025 revenue behind comprehensive Medicare coverage and a dense network of fellowship-trained breast radiologists. Widely available tomosynthesis, high AI acceptance and payer willingness to reimburse liquid-biopsy companion diagnostics strengthen the region’s dominance. Consolidation accelerates innovation: RadNet’s acquisition of iCAD channels AI resources into 363 imaging centers, establishing data pipelines to refine algorithm accuracy and maintain the region’s technological edge.
APAC Breast Biopsy Devices Market
Asia-Pacific is the fastest-growing territory at 9.35% CAGR because governments subsidize nationwide screening programs and younger median onset mandates earlier intervention. China’s goal to screen 6 million women per year opens a vast addressable population while revealing logistic gaps that favor portable biopsy carts. Japan pilots magnetic seed localization and low-dose tomosynthesis to reduce radiation anxiety, while South Korea extends national insurance to AI-assisted ultrasound, stimulating equipment upgrades. As middle-income economies scale digital health platforms, regional suppliers collaborate with Western OEMs to customize low-footprint devices, ensuring sustained growth for the breast biopsy devices market.
Europe Breast Biopsy Devices Market
Europe records steady gains thanks to CE-marked innovations and diagnosis-related group payments that reward minimally invasive therapy. Germany expands outpatient quotas for stereotactic procedures, freeing inpatient capacity. Meanwhile, Eastern European countries tap EU structural funds to modernize imaging suites, narrowing technology gaps within the bloc.
South America and MEA Breast Biopsy Devices Market
South America and the Middle East & Africa trail but exhibit pockets of acceleration. Brazil introduces tele-pathology pilots that shorten report cycles, whereas Gulf Cooperation Council states subsidize tomosynthesis for nationals. Infrastructure constraints and currency volatility remain hurdles, yet creative financing—such as pay-per-use models—shows promise for broadening access and nurturing the breast biopsy devices market.
Competitive Landscape
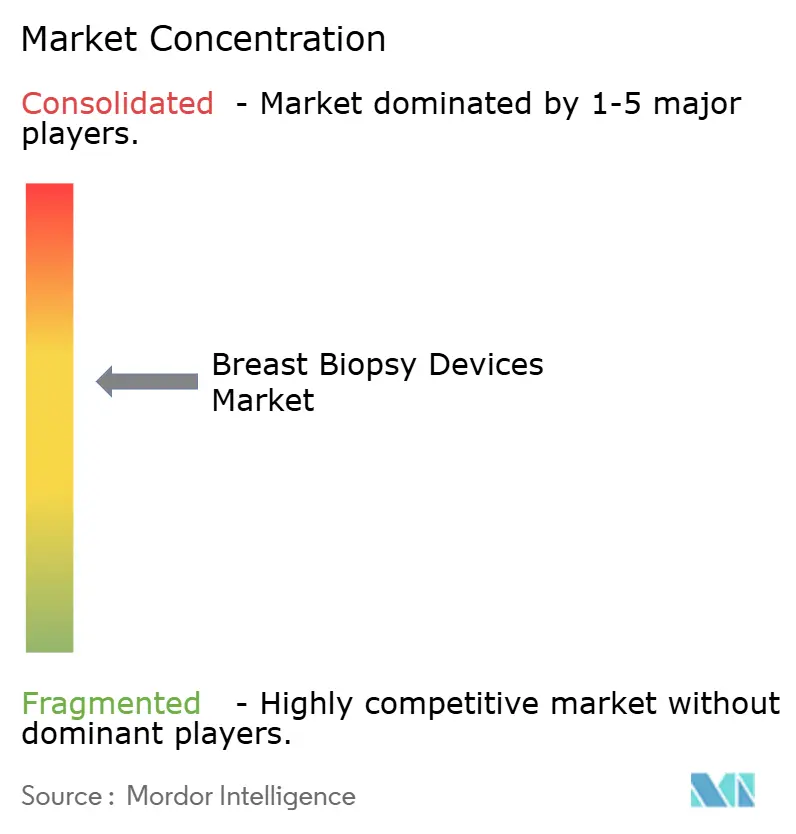
Competition is moderate, with top players integrating hardware, AI software and service contracts to secure critical mass. Hologic’s USD 310 million acquisition of Endomagnetics augments its biopsy line with magnetic seed localization, allowing a contiguous workflow from detection to surgery. GE HealthCare scales its Serena Bright platform to integrate contrast-enhanced mammography and same-session biopsy, positioning itself as a one-stop diagnostic shop.
RadNet’s all-stock purchase of iCAD for USD 103 million marries a national imaging footprint with FDA-cleared algorithms, shifting bargaining power toward providers that control both data and devices. Smaller innovators focus on niche enhancements: Merit Medical’s SCOUT Mini reflector trims overall length by 33%, catering to lymph-node targeting, while robotic-arm developers refine motion stabilization for MRI suites.
Differentiation hinges on user-experience metrics—procedure time, false-positive reduction and workflow interoperability. Vendors that wrap disposables into subscription-based AI analytics lock in recurring revenue and deepen customer stickiness. Price-sensitive markets welcome stripped-down variants, but the long-term prize lies with modular ecosystems that allow incremental add-ons, keeping the breast biopsy devices market dynamic.
Breast Biopsy Devices Industry Leaders
-
Hologic Inc.
-
Becton Dickinson & Co
-
Danaher Corp.
-
Argon Medical Devices
-
Merit Medical Systems
- *Disclaimer: Major Players sorted in no particular order
Breast Biopsy Devices Market Companies Covered in this Report
- Hologic
- Becton Dickinson & Co.
- Danaher Corp.
- Roche
- Argon Medical Devices
- Merit Medical Systems
- Menarini-Silicon Biosystems
- NeoGenomics
- Sysmex Inostics
- Bio-Rad Laboratories
- QIAGEN
- Exact Sciences Corp.
- Guardant Health
- Intact Medical (Philips)
- Boston Scientific
- Cook Group
- Olympus Corp.
- Cardinal Health
- B. Braun
- Sterylab S.R.L.
Market Opportunities and Future Outlook
Workflow-integrated biopsy ecosystems are a clear whitespace as providers seek to reduce repeat sampling and shorten time-to-diagnosis with image-guided platforms that link detection, biopsy, specimen imaging, and localization. Recent US clearances also point to active commercialization in advanced modalities, including Mammotome Prima MR (March 2026) for in-room MR vacuum-assisted breast biopsy and BD's EnCor EnCompass system (January 2026) for breast biopsy and tissue removal. This supports upgrade conversations for hospitals, clinics, and high-throughput diagnostic centers.
Supply resilience and alternative sourcing are a nearer-term opportunity driver as needle availability affects stereotactic breast biopsy workflows. In June 2026, the FDA communicated disruptions in the availability of breast biopsy needles and indicated ongoing constraints into early 2027, which leads providers to qualify substitute needles, rebalance gauge preferences where clinically appropriate, and pursue multi-vendor supply agreements, increasing scrutiny on dependable consumable portfolios. Portfolio expansion into adjacent breast oncology and localization capabilities can also strengthen bundled contracting, supported by Merit Medical Systems' April 2026 acquisition of View Point Medical, which broadened its breast tumor localization offering.
Recent Industry Developments in Breast Biopsy Devices Market
- June 2026: The FDA updated its medical device shortage list, indicating continued supply disruption for stereotactic breast biopsy needles through early 2027. The shortage constrains clinical access to essential biopsy tools. Providers may need to diversify suppliers and adjust procedural workflows to mitigate the impact on imaging-guided biopsy programs.
- February 2026: Argon Medical Devices received FDA clearance for ZeniCore Automatic Biopsy Instrument (510(k) K252795). The clearance expands Argon's portfolio in image-guided biopsy. The instrument supports automated sampling and broadens Argon's offering for hospitals and clinics.
- January 2026: BD (Becton Dickinson) received FDA 510(k) clearance for EnCor EnCompass Breast Biopsy and Tissue Removal System. The clearance adds a multi-modality breast biopsy system to BD's offerings. It strengthens BD's presence in integrated biopsy workflows and complements other BD breast tools.
Breast Biopsy Devices Market Report Scope and Research Methodology
Market Definition and Coverage
For this methodology, the market covers devices and related procedural tools used to collect breast tissue samples for diagnosis in image-guided and minimally invasive settings, across hospitals, diagnostic centers, and specialty clinics.
Scope exclusions: This sizing excludes breast imaging systems used only for screening and diagnosis without tissue sampling, along with broad pathology lab consumables that are not specific to the biopsy procedure.
Segments Covered in This Report
- By Product
- Breast Biopsy Needles
- Breast Biopsy Tables
- Guidance/Imaging Systems
- Localization Wires
- Assay & Reagent Kits
- Others
- By Procedure
- Vacuum-Assisted Biopsy (VAB)
- Core Needle Biopsy (CNB)
- Fine Needle Aspiration Biopsy (FNAB)
- Others
- By Technique
- Image-Guided Biopsy
- Stereotactic-Guided
- Ultrasound-Guided
- CT-Guided
- MRI-Guided
- Liquid-Biopsy Techniques
- Next-Generation Sequencing
- PCR-Based
- Microarray-Based
- Image-Guided Biopsy
- By Indication
- Fibroadenoma
- Suspicious Micro-calcifications
- Complex Cyst
- Recurrent Breast Cancer
- Invasive Lobular Carcinoma
- Other Indications
- By End User
- Breast Care Centres
- Hospitals & Clinics
- Diagnostic Centres
- Geography
- North America
- United States
- Canada
- Mexico
- Europe
- Germany
- United Kingdom
- France
- Italy
- Spain
- Rest of Europe
- Asia-Pacific
- China
- Japan
- India
- South Korea
- Australia
- Rest of Asia-Pacific
- Middle East and Africa
- GCC
- South Africa
- Rest of Middle East and Africa
- South America
- Brazil
- Argentina
- Rest of South America
- North America
Data Sources, Market Sizing, and Validation
Desk Research
We map the care pathway from screening recall to tissue confirmation, so device flows and procedure counts are anchored to real clinical practice. Public sources were used to set the demand context and mix shifts, including cancer incidence and screening participation data from sources such as WHO and GLOBOCAN, plus CDC and the American Cancer Society. We also pulled procedure and utilization signals from OECD health statistics and national health services to triangulate biopsy volumes.
Next, product and procedure assumptions are shaped using regulator and evidence sources, such as the FDA device databases, peer-reviewed clinical literature indexed in PubMed, and published guideline summaries from professional societies. To close gaps, general secondary sources like company filings, investor presentations, reputable press coverage, and tender disclosures were reviewed. We used paid subscriptions for company financials and patent databases selectively to corroborate innovation and portfolio direction. The desk sources listed above are illustrative, and other public documents and datasets were also used for collection, cross-checks, and clarification.
Primary Interviews and Surveys
After desk work, we validate assumptions through expert interviews and structured surveys across device makers, distributors, radiology and breast imaging clinicians, and procurement stakeholders. Inputs focused on how procedure choice varies by lesion type and imaging modality, how adoption changes for vacuum-assisted approaches, and how reimbursement and site of care shifts influence device utilization across APAC, EMEA, and the Americas.
Distribution of primary research fieldwork respondents
| Company type | Respondent position | Region |
|---|---|---|
| Top tier: 33% | CXOs: 13% | APAC: 41% |
| Mid tier: 53% | Functional/Unit leaders: 35% | EMEA: 34% |
| Smaller Players: 14% | Managers: 52% | Americas: 25% |
Market-Sizing & Forecasting
Sizing is built using a top-down approach where screening recall volumes, biopsy rate assumptions, and site-of-care procedure splits are used to reconstruct an annual procedure pool by major geography. Revenue is then derived using typical device use per procedure and average selling price ranges.
Because care pathways differ across countries, we adjust the procedure pool using indicators such as breast cancer incidence trends, screening coverage and age-band participation, the share of image-guided biopsies versus surgical biopsy, and vacuum-assisted penetration in outpatient settings.
To keep the model grounded, we check outputs with selective bottom-up approximations, including supplier revenue sanity checks, distributor channel feedback, and ASP multiplied by procedure counts in priority countries where the data is clearer. Where a direct procedure count is not available, we use proxy ratios from similar health systems, then re-test the assumption with clinician input.
For forecasting, scenario analysis is used so volumes and pricing can move differently under changes in screening uptake, reimbursement policies, and technology shift toward less invasive sampling. Near-term trends are smoothed using recent procedure momentum from primary feedback, and longer-term trajectories are aligned to expected screening expansion and aging population effects.
Data Validation & Update Cycle
We run several validation loops before results are finalized, since single source figures can be noisy in this space. Model outputs are compared against independent signals such as screening participation trends, breast cancer diagnosis counts, and expected biopsy rates, and large variances are investigated using follow-up checks.
Numbers are reviewed across multiple analyst steps so assumptions, conversion factors, and regional rollups remain consistent. Outliers are flagged for re-contact with interviewees when needed. Reports are refreshed annually, with interim updates when major regulatory actions, reimbursement changes, or step-change procedure shifts occur. Before delivery, a final pass is completed so clients receive the most current view available.
Mordor Intelligence's Breast Biopsy Devices Market Size Measured Against Other Published Estimates
Published market values for breast biopsy devices can look far apart because scope and counting rules are not always the same, even when market titles appear similar. Differences usually come from whether disposable procedure kits are included, how procedures are converted into device revenue, and what exchange-rate timing and inflation treatment are applied.
Another common gap driver is how image guidance is handled. Some estimates include imaging platform revenue within the same total, while others treat it as outside the market. When procedure growth is projected, the spread also reflects whether the forecast assumes screening participation stays flat or expands, and whether vacuum-assisted adoption is accelerated without checks against site-of-care capacity and reimbursement realities.
Benchmark comparison
| Source | Market Size | Gaps in Research Methodology |
|---|---|---|
| Mordor Intelligence | USD 1.29 B (2025) | |
| Industry Publisher A | USD 1.80 B (2023) | This figure appears to use a broader scope that can bundle adjacent breast biopsy related tools and accessories, and it also applies a higher growth runway that may assume faster screening expansion and quicker vacuum assisted penetration. |
| Research Group B | USD 2.01 B (2023) | This estimate is closer to a wider breast biopsy market definition, which can include procedure and service related revenue beyond dedicated biopsy devices, and it may rely on less transparent procedure to revenue conversion and currency timing. |
The table indicates that most of the gap is explained by what is counted as device revenue versus broader procedure-related spend, and by how aggressively procedure growth is carried forward. By tying revenue to a defined biopsy procedure pool and keeping imaging platforms and non-specific pathology spend out of the total, the sizing remains more repeatable, which is the approach applied by Mordor Intelligence.
Key Questions Answered in the Report
What is the current value of the breast biopsy devices market?
The breast biopsy devices market is valued at USD 1.35 billion in 2026.
Which product type grows fastest through 2031?
Guidance and imaging systems show the highest 9.85% CAGR as AI integration accelerates through 2031.
Why is Asia-Pacific the quickest-expanding region?
Government-funded screening programs and a younger median age of onset drive a 9.35% regional CAGR.
How does vacuum-assisted biopsy outperform other techniques?
It offers 99.2% sensitivity, larger single-pass samples and avoids surgery in 76% of eligible cases.
Are liquid biopsies replacing tissue sampling?
No; they complement image-guided biopsies by providing molecular insights, but tissue remains essential for histology and microenvironment assessment.
What limits adoption in emerging markets?
High capital cost of stereotactic tables and limited radiology capacity slow installation rates despite strong demand.