Blockchain In Manufacturing Market Size and Share
Market Overview
| Study Period | 2020 - 2031 |
|---|---|
| Market Size (2026) | USD 4.4 Billion |
| Market Size (2031) | USD 68.23 Billion |
| Growth Rate (2026 - 2031) | 73.06% CAGR |
| Fastest Growing Market | Asia Pacific |
| Largest Market | North America |
| Market Concentration | Medium |
Major Players*Disclaimer: Major Players sorted in no particular order Image © Mordor Intelligence. Reuse requires attribution under CC BY 4.0. | |
Blockchain In Manufacturing Market Analysis by Mordor Intelligence
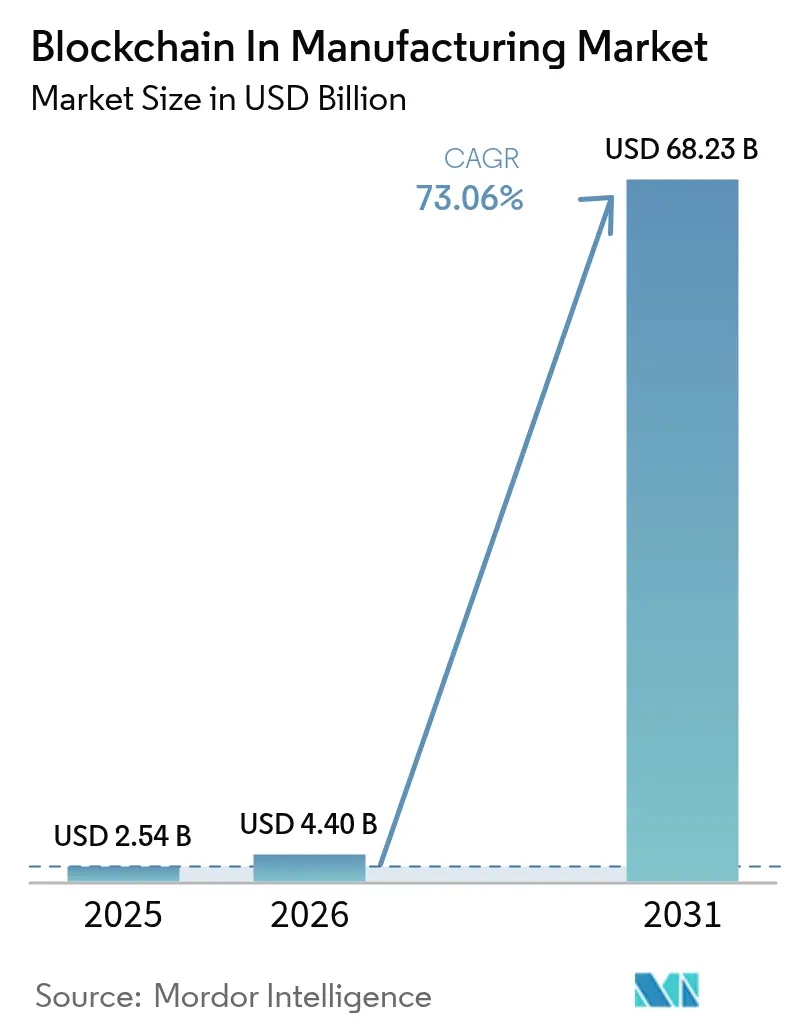
The Blockchain In Manufacturing Market size was valued at USD 2.54 billion in 2025 and estimated to grow from USD 4.4 billion in 2026 to reach USD 68.23 billion by 2031, at a CAGR of 73.06% during the forecast period (2026-2031).
Rising deployment of immutable ledgers for batch provenance, anti-counterfeiting, and equipment tokenization is accelerating the transition from pilot projects to enterprise-wide rollouts. Heightened regulatory scrutiny, especially under the Drug Supply Chain Security Act, is compelling manufacturers to adopt distributed ledgers that automate serialization and recall management. Equipment-as-a-service initiatives are unlocking new revenue streams, while cloud-based Blockchain-as-a-Service (BaaS) platforms lower entry barriers for small and mid-sized factories. Although fragmentation in standards and shortages of blockchain-skilled operational-technology talent temper near-term adoption, strategic partnerships between cloud hyperscalers and industrial OEMs are closing capability gaps.
Key Report Takeaways
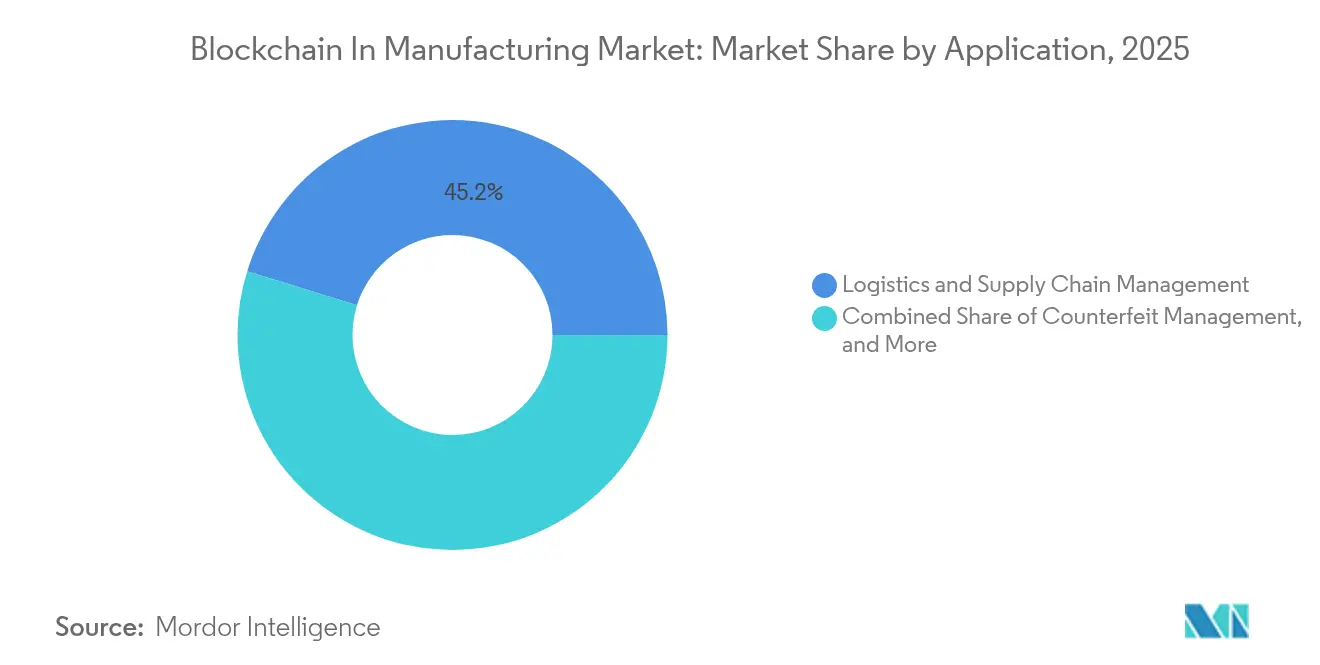
- By application, logistics and supply-chain management led with 45.20% of the blockchain in the manufacturing market share in 2025, whereas quality control and compliance applications are set to expand at a 74.20% CAGR through 2031.
- By end-user vertical, the automotive sector held 30.60% share of the blockchain in manufacturing market size in 2025, while the pharmaceutical and life sciences segment records the fastest CAGR at 75.60% to 2031.
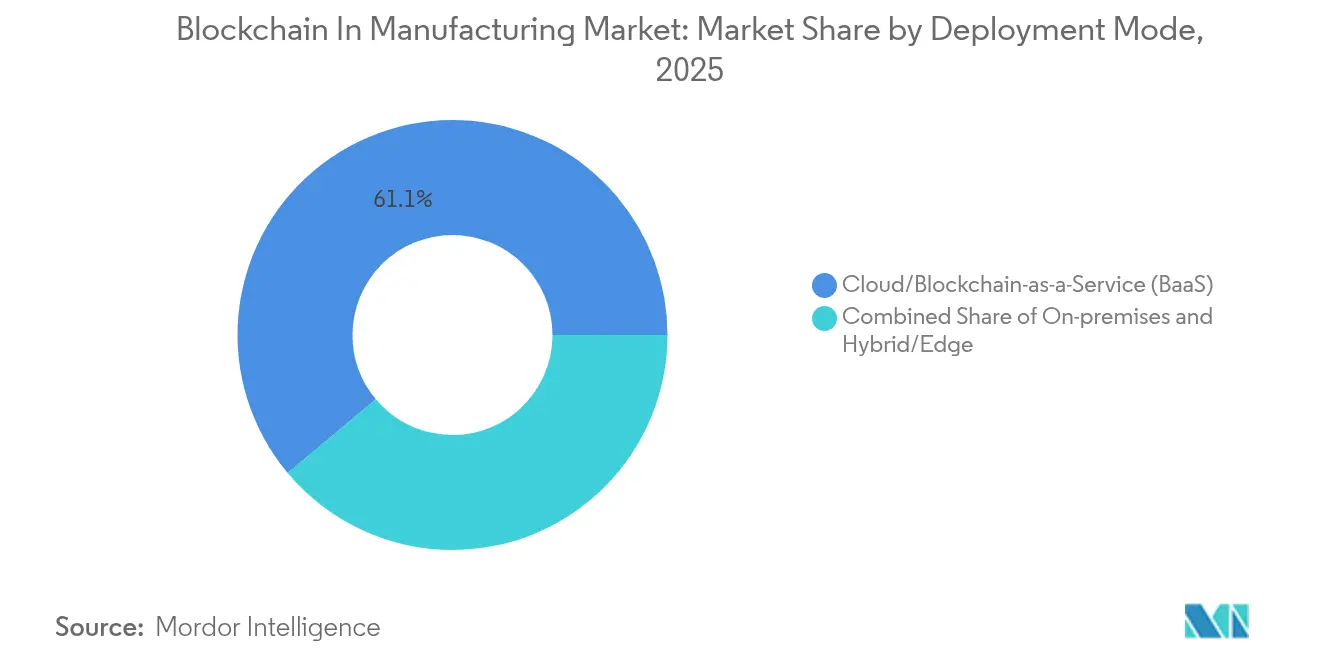
- By deployment mode, cloud-based BaaS platforms commanded 61.10% share of the blockchain in manufacturing market size in 2025; hybrid and edge approaches demonstrate the strongest 74.80% CAGR outlook.
- By blockchain type, private/permissioned led 57.80% of the blockchain in the manufacturing market share in 2025, whereas the public type of blockchain is set to expand at a 73.85% CAGR through 2031.
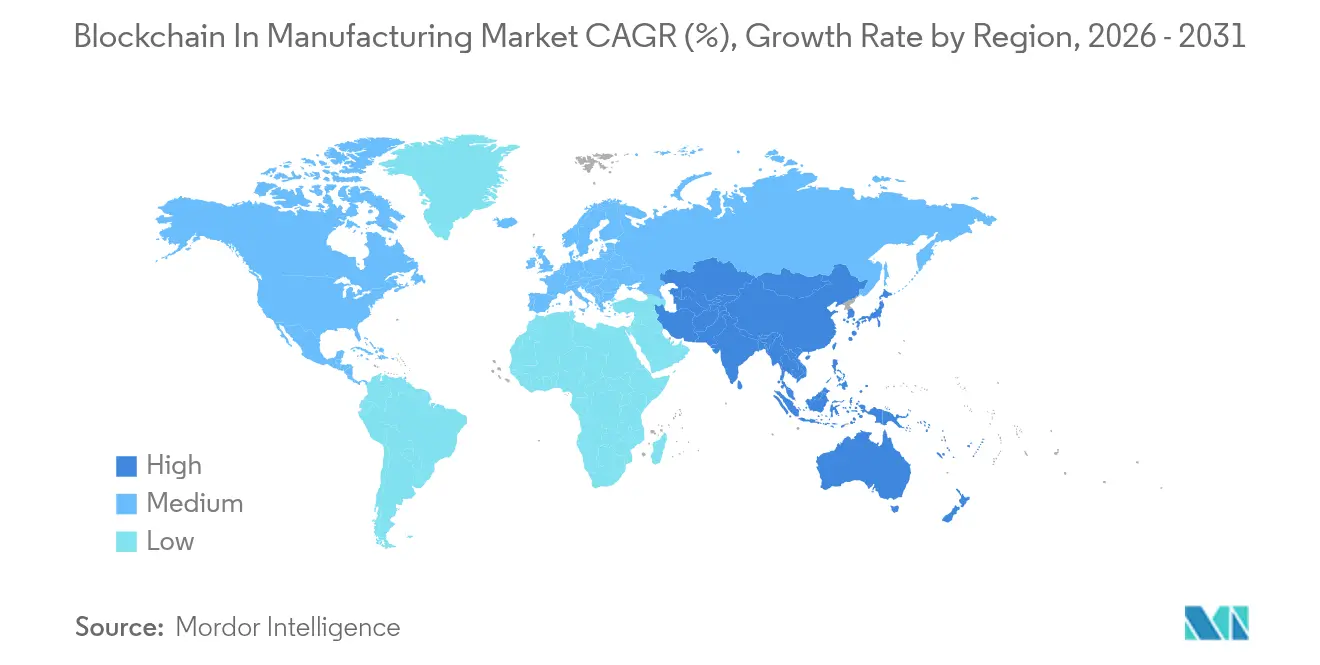
- By geography, North America accounted for 43.80% of the blockchain in manufacturing market share in 2025, whereas Asia Pacific is projected to advance at a 75.20% CAGR through 2031.
Note: Market size and forecast figures in this report are generated using Mordor Intelligence’s proprietary estimation framework, updated with the latest available data and insights as of 2026.
Global Blockchain In Manufacturing Market Trends and Insights
Drivers Impact Analysis*
| Driver | (~) % Impact on CAGR Forecast | Geographic Relevance | Impact Timeline |
|---|---|---|---|
| Escalating adoption of BaaS across discrete manufacturing | +18.50% | Global, North America & Europe lead | Medium term (2–4 years) |
| Supply-chain provenance and traceability mandates | +16.20% | Global; strongest in North America & EU | Short term (≤ 2 years) |
| Demand for counterfeit mitigation in high-value components | +14.80% | Asia Pacific & North America | Medium term (2–4 years) |
| Tokenization enables equipment-as-a-service models | +12.30% | North America and Europe, spreading to the Asia Pacific | Long term (≥ 4 years) |
| Integration with additive manufacturing for secure part genealogy | +8.7% | North America and Europe | Long term (≥ 4 years) |
| Privacy-preserving zero-knowledge-proof pilots for IP protection | +5.9% | Global, high-IP industries | Long term (≥ 4 years) |
| Source: Mordor Intelligence | |||
Escalating Adoption of BaaS Across Discrete Manufacturing
Cloud-delivered BaaS now represents 61.8% of implementation preferences among discrete manufacturers, a share propelled by turnkey environments that eliminate the need for specialized node management. Microsoft’s integration of blockchain telemetry into its Fabric analytics suite allows users to query production-line events alongside enterprise data, reducing system-integration time by 35%[2]Microsoft Corp., “Microsoft Fabric Adds Blockchain Telemetry,” microsoft.com. Cost savings combine with simplified DevOps to ensure that BaaS gains traction in automotive, electronics, and industrial equipment factories that require rapid onboarding yet stringent uptime.
Supply-Chain Provenance and Traceability Mandates
The FDA extended its Food Traceability Rule deadline yet reaffirmed blockchain’s suitability for immutable lot-level reporting requirements. Parallel EU Digital Product Passport rules reinforce the need for distributed records across every product lifecycle phase. Pharmaceutical, aerospace, and consumer electronics producers are embedding serialization data onto shared ledgers to automate recall, thereby trimming manual audit costs by 28%.
Demand for Counterfeit Mitigation in High-Value Components
Counterfeiting exposes aerospace and automotive producers to multi-billion-dollar safety liabilities. Merck’s security-pigment markers combined with blockchain proofs cut fraudulent returns by 60% in pilot runs. As component pedigree moves on-chain, manufacturers report net revenue gains of 2-5% from diverted grey-market sales.
Tokenization Enabling Equipment-as-a-Service Models
Smart-contract-driven usage meters let OEMs shift from capital sales to performance-based billing. Pearson Packaging Systems achieved a 17% year-one margin uplift by monetizing runtime data captured on a permissioned ledger. Predictive maintenance alerts generated from tokenized digital twins reduced downtime by 22%, bolstering the business case for blockchain-enabled servitization.
Restraints Impact Analysis*
| Restraint | (~) % Impact on CAGR Forecast | Geographic Relevance | Impact Timeline |
|---|---|---|---|
| Fragmented standards and interoperability gaps | -12.40% | Global, pronounced in multi-vendor chains | Short term (≤ 2 years) |
| Limited blockchain talent in OT environments | -8.70% | Global, acute in Asia Pacific & emerging markets | Medium term (2–4 years) |
| Rising energy-use concerns for on-chain traceability | -6.3% | Europe & North America | Medium term (2–4 years) |
| Uncertainty around post-quantum security requirements | -4.8% | Global; defense & critical infrastructure | Long term (≥ 4 years) |
| Source: Mordor Intelligence | |||
Fragmented Standards and Interoperability Gaps
The absence of universal data models forces suppliers to build costly middleware bridges for each trading partner. GS1 and ISO working groups are drafting common schemas, yet adoption lags fast-moving implementation deadlines. Consortium-based pilots in automotive and chemicals signal progress but remain pockets rather than norms.
Limited Blockchain Talent in OT Environments
Deloitte’s 2025 Smart Manufacturing Survey shows 65% of factories cite blockchain skills scarcity as their primary hurdle, a rate higher than for AI or 5G deployments[1]Deloitte, “2025 Smart Manufacturing Survey,” deloitte.com . Bridging IT-OT cultures requires retraining control-system engineers in smart-contract logic, a process that stretches average pilot timelines by six months.
*Our forecasts treat driver/restraint impacts as directional, not additive. The impact forecasts reflect baseline growth, mix effects, and variable interactions.
Segment Analysis
By Application: Quality Control Gains Momentum
Quality control and compliance tools are projected to post a 74.20% CAGR to 2031, outpacing logistics management despite the latter’s 45.20% hold on the blockchain in manufacturing market share in 2025. Pharmaceutical firms running FDA serialization pilots report 30% faster deviation resolution when batch histories sit on a distributed ledger. Smart-contract workflows that auto-issue audit certificates replace paper record-keeping, cutting compliance hours by 40%. Second-wave applications include predictive maintenance logs and warranty adjudication, where immutable histories lower dispute rates. Counterfeit detection remains central as luxury-grade chemical tags feed authenticity hashes into public ledgers, enhancing consumer trust. As use cases multiply, the blockchain in the manufacturing market registers significant traction across both greenfield and brownfield plants.
Quality systems also form the backbone for emerging intellectual-property protection schemes in additive manufacturing, where zero-knowledge proofs confirm design compliance without revealing trade secrets. Electronic-component makers integrate on-device cryptographic signatures with the ledger, strengthening recall precision. This convergence of quality, compliance, and anti-counterfeiting accelerates enterprise interest in interoperable platforms, reinforcing the blockchain in the manufacturing market growth narrative.


By End-User Vertical: Pharmaceutical Acceleration
Automotive factories dominated revenue with 30.60% in 2025, reflecting extensive part traceability obligations and mature Industry 4.0 investments. Nonetheless, life-sciences producers will expand the blockchain in the manufacturing market size for their segment at a 75.60% CAGR through 2031 as serialization, cold-chain tracking, and patient-level provenance become mandatory under global health regulations. Drug makers collaborating with IBM and Merck reported 25% faster recall execution during simulated audits. Aerospace and defense integrators adopt secure part genealogy ledgers for 3D-printed components, mitigating tampering risks. Consumer-electronics brands embed warranty tokens into products to streamline after-sales service, while food and beverage processors deploy farm-to-fork tracking to satisfy sustainability audits. Collectively, vertical diversification broadens the blockchain in the manufacturing industry footprint beyond early movers.
By Deployment Mode: Hybrid Edge Emergence
Cloud services captured 61.10% of 2025 revenue, illustrating strong early demand for managed stacks. Yet hybrid and edge frameworks will log a 74.80% CAGR to 2031 as factories embed lightweight nodes directly on equipment to meet sub-second latency thresholds. Siemens and Minima demonstrated that device-level validation upholds data integrity even when connectivity falters, an advantage crucial for high-speed robotics lines. Edge nodes process 90% of transactions locally before anchoring summaries to cloud chains, reducing bandwidth costs while preserving audit trails. On-premises installations persist where data sovereignty rules prevail, particularly in defense sectors, but their growth remains modest. The shift to hybrid architectures positions the blockchain in the manufacturing market for broader adoption across latency-sensitive operations.
By Blockchain Type: Public Network Growth and Interoperability Focus
Private and permissioned networks held 57.80% revenue share in 2025, driven by governance control requirements. Public chains, however, will expand at 73.85% CAGR as proof-of-stake frameworks ease energy burdens and zero-knowledge protocols conceal sensitive data on open ledgers. Firms leverage the liquidity and ecosystem tools of established public networks while anchoring confidential payloads off-chain. Consortium models fill the gap for sector-specific needs, such as automotive parts passports. Cross-chain bridges under development by standards bodies allow manufacturing events logged on private chains to synchronize with public ecosystems, creating unified visibility. As interoperability matures, stakeholders anticipate that public-network adoption will reshape cost structures and scalability expectations across the blockchain in the manufacturing market.
Geography Analysis
North America held 43.80% of 2025 revenue owing to FDA mandates, established cloud infrastructure, and strong venture capital backing for ledger startups. Pharmaceutical serialization and aerospace part pedigree requirements drove early proofs that have since scaled to multi-plant deployments. State-level incentives further supported SME adoption.
Asia Pacific registers the highest 75.20% CAGR forecast between 2026 and 2031, reflecting sweeping digitization initiatives such as China’s industrial blockchain pilots and Japan’s Society 5.0 smart-factory roadmap. The Asian Development Bank’s Project Tridecagon showcases regional commitment to inter-bank distributed settlements that align with manufacturing export-credit flows. India’s electronics clusters and South Korea’s battery-supply chain agreements add momentum, catalyzing adoption by Tier-2 suppliers.
Europe emerges as a sustainability-centric adopter, leveraging Digital Product Passports to document carbon footprints and circular-economy metrics. Germany’s automotive OEMs employ joint ledgers to track recycled steel content, while France’s aerospace primes adopt blockchain to manage additive-manufacturing powders. Nordic manufacturers power permissioned networks with hydro and wind energy, addressing ESG expectations. Cross-border data-spaces projects promote interoperability, suggesting that regional implementations will converge under common governance as the blockchain in the manufacturing market matures globally.

Competitive Landscape
Competitive intensity is moderate with signs of consolidation as enterprises prefer end-to-end platforms. IBM, Microsoft, SAP, and Oracle integrate blockchain orchestration with ERP, IoT, and analytics suites, capturing 38% of 2024 platform billings. Their advantage rests on pre-existing enterprise contracts, turnkey compliance modules, and global cloud points of presence.
Specialists such as VeChain, Chronicled, and SyncFab carve niches in luxury goods, pharmaceutical traceability, and supplier discovery, respectively. They compete through domain depth and lighter-weight deployments. Strategic alliances bridge gaps; for example, IBM and Merck pilot FDA-compliant batch ledgers, and Zebra Technologies teams with Merck KGaA on M-Trust for counterfeit mitigation.
Emerging entrants pursue edge-native stacks, post-quantum cryptography, and zero-knowledge proofs. Siemens’ investment in device-resident nodes underscores OEM appetite for embedded ledgers. Patent filings by BMW and Ford reveal automakers’ focus on proprietary traceability workflows. Sustained R&D outlays and ecosystem alliances signal that platform breadth and standards influence will shape leadership in the blockchain in the manufacturing market through 2030.
Blockchain In Manufacturing Industry Leaders
IBM Corporation
Microsoft Corporation
Intel Corporation
Amazon Web Services, Inc.
Wipro Limited
- *Disclaimer: Major Players sorted in no particular order

Recent Industry Developments
- June 2025: Microsoft integrated blockchain telemetry from Space & Time into its Fabric analytics suite, expanding real-time production insights.
- May 2025: SEALSQ introduced QVault TPM with NIST-approved post-quantum algorithms for defense and automotive applications.
- March 2025: Siemens and Minima embedded IoT-centric blockchains into manufacturing devices, advancing secure edge validation.
- January 2025: Dfns partnered with Arianee to enhance digital product passports on blockchain, helping brands track ownership and service logs for anti-counterfeiting efficiency.


Global Blockchain In Manufacturing Market Report Scope
Blockchain technology, based on peer-to-peer technology, is a distributed ledger that allows data storage globally, allowing any user on the network to see prior entries in real-time.
The Blockchain in Manufacturing Market is segmented by Application (Logistics and Supply Chain Management, Counterfeit Management, Quality Control, and Compliance), End-user Vertical (Automotive, Aerospace and Defense, Pharmaceutical, Consumer Electronics), and Geography (North America, Europe, Asia-Pacific, Rest of the World)
The market sizes and forecasts are provided in terms of value (USD million) for all the above segments.
| Logistics and Supply Chain Management |
| Counterfeit Management |
| Quality Control and Compliance |
| Predictive Maintenance and Asset Tracking |
| Smart Contracts for Procurement |
| Other Applications |
| Automotive |
| Aerospace and Defense |
| Pharmaceutical and Life Sciences |
| Consumer Electronics |
| Industrial Machinery |
| Food and Beverage |
| Other Verticals |
| On-premises |
| Cloud/Blockchain-as-a-Service (BaaS) |
| Hybrid/Edge |
| Public |
| Private/Permissioned |
| Consortium |
| North America | United States | |
| Canada | ||
| Mexico | ||
| South America | Brazil | |
| Argentina | ||
| Rest of South America | ||
| Europe | Germany | |
| United Kingdom | ||
| France | ||
| Italy | ||
| Spain | ||
| Rest of Europe | ||
| Asia-Pacific | China | |
| Japan | ||
| India | ||
| South Korea | ||
| Rest of Asia-Pacific | ||
| Middle East and Africa | Middle East | Saudi Arabia |
| United Arab Emirates | ||
| Turkey | ||
| Rest of Middle East | ||
| Africa | South Africa | |
| Nigeria | ||
| Kenya | ||
| Rest of Africa | ||
| By Application | Logistics and Supply Chain Management | ||
| Counterfeit Management | |||
| Quality Control and Compliance | |||
| Predictive Maintenance and Asset Tracking | |||
| Smart Contracts for Procurement | |||
| Other Applications | |||
| By End-user Vertical | Automotive | ||
| Aerospace and Defense | |||
| Pharmaceutical and Life Sciences | |||
| Consumer Electronics | |||
| Industrial Machinery | |||
| Food and Beverage | |||
| Other Verticals | |||
| By Deployment Mode | On-premises | ||
| Cloud/Blockchain-as-a-Service (BaaS) | |||
| Hybrid/Edge | |||
| By Blockchain Type | Public | ||
| Private/Permissioned | |||
| Consortium | |||
| By Geography | North America | United States | |
| Canada | |||
| Mexico | |||
| South America | Brazil | ||
| Argentina | |||
| Rest of South America | |||
| Europe | Germany | ||
| United Kingdom | |||
| France | |||
| Italy | |||
| Spain | |||
| Rest of Europe | |||
| Asia-Pacific | China | ||
| Japan | |||
| India | |||
| South Korea | |||
| Rest of Asia-Pacific | |||
| Middle East and Africa | Middle East | Saudi Arabia | |
| United Arab Emirates | |||
| Turkey | |||
| Rest of Middle East | |||
| Africa | South Africa | ||
| Nigeria | |||
| Kenya | |||
| Rest of Africa | |||


Key Questions Answered in the Report
What is the current size of the blockchain in the manufacturing market?
The blockchain in the manufacturing market is valued at USD 4.4 billion in 2026.
How fast will the market expand over the next five years?
Revenue is forecast to increase at a 73.06% CAGR, reaching USD 68.23 billion by 2031.
Which application segment is growing the quickest?
Quality control and compliance solutions show the highest growth, advancing at a 74.20% CAGR to 2031.
Why is Asia Pacific considered the most dynamic region?
Government-backed digitization programs in China, Japan, and India push Asia Pacific to a 75.20% CAGR through 2031.
Who are the leading technology providers in this space?
IBM, Microsoft, SAP, and Oracle lead platform revenues, while VeChain and Chronicled specialize in manufacturing-specific deployments.
What major hurdle could slow near-term adoption?
Fragmented interoperability standards pose the largest restraint, potentially trimming the CAGR impact by 12.4%.
Page last updated on:


