
Biomass Power Market Size and Share
Market Overview
| Study Period | 2021 - 2031 |
|---|---|
| Market Size (2026) | USD 127.75 Billion |
| Market Size (2031) | USD 171.02 Billion |
| Growth Rate (2026 - 2031) | 6.01 % |
| Fastest Growing Market | Asia-Pacific |
| Largest Market | Asia-Pacific |
| Market Concentration | Low |
Major Players *Disclaimer: Major Players sorted in no particular order Image © Mordor Intelligence. Reuse requires attribution under CC BY 4.0. | |
Biomass Power Market Analysis by Mordor Intelligence
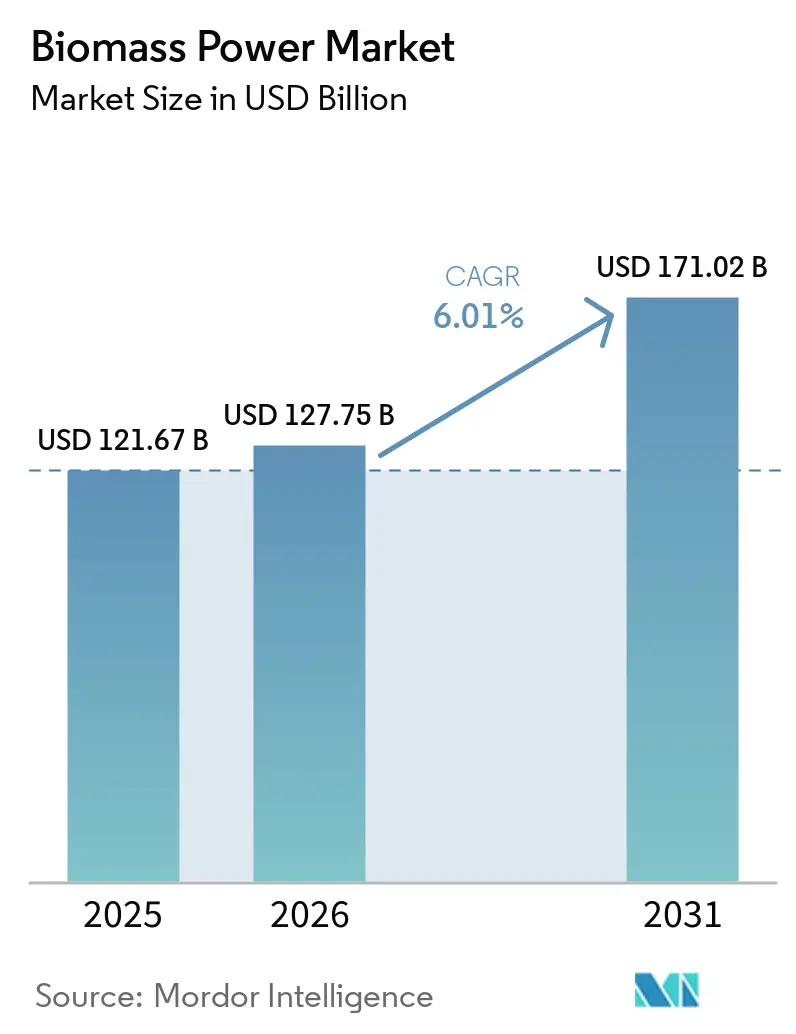
The Biomass Power Market size is expected to grow from USD 121.67 billion in 2025 to USD 127.75 billion in 2026 and is forecast to reach USD 171.02 billion by 2031 at 6.01% CAGR over 2026-2031. The Biomass power market supports power systems that need electricity when solar and wind output is limited. Its value is increasingly tied to flexible generation, grid stability, and industrial heat supply rather than electricity sales alone. Policy support is moving toward projects using residues, waste streams, and certified feedstocks. Coal conversions and co-firing allow operators to reuse turbines and grid connections while reducing coal use. Feedstock sustainability rules, supply-chain costs, and lower solar, wind, and storage costs will continue to shape project selection and investment returns.
Key Report Takeaways
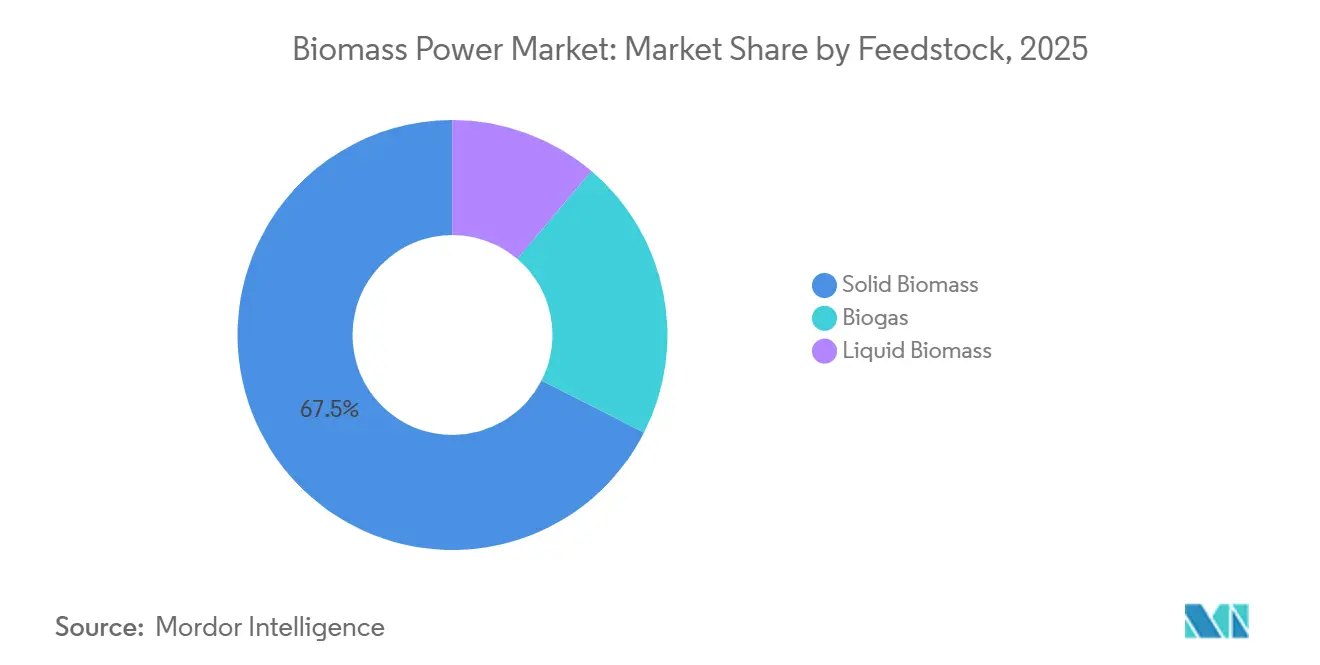
- By feedstock, solid biomass held 67.5% revenue share in 2025, while biogas is forecast to grow at a 9.3% CAGR through 2031.
- By technology, combustion held 62.3% revenue share in 2025, while anaerobic digestion is forecast to grow at an 8.1% CAGR through 2031.
- By capacity, plants above 100 MW held 31.7% revenue share in 2025, while the 1–10 MW segment is forecast to grow at a 7.5% CAGR through 2031.
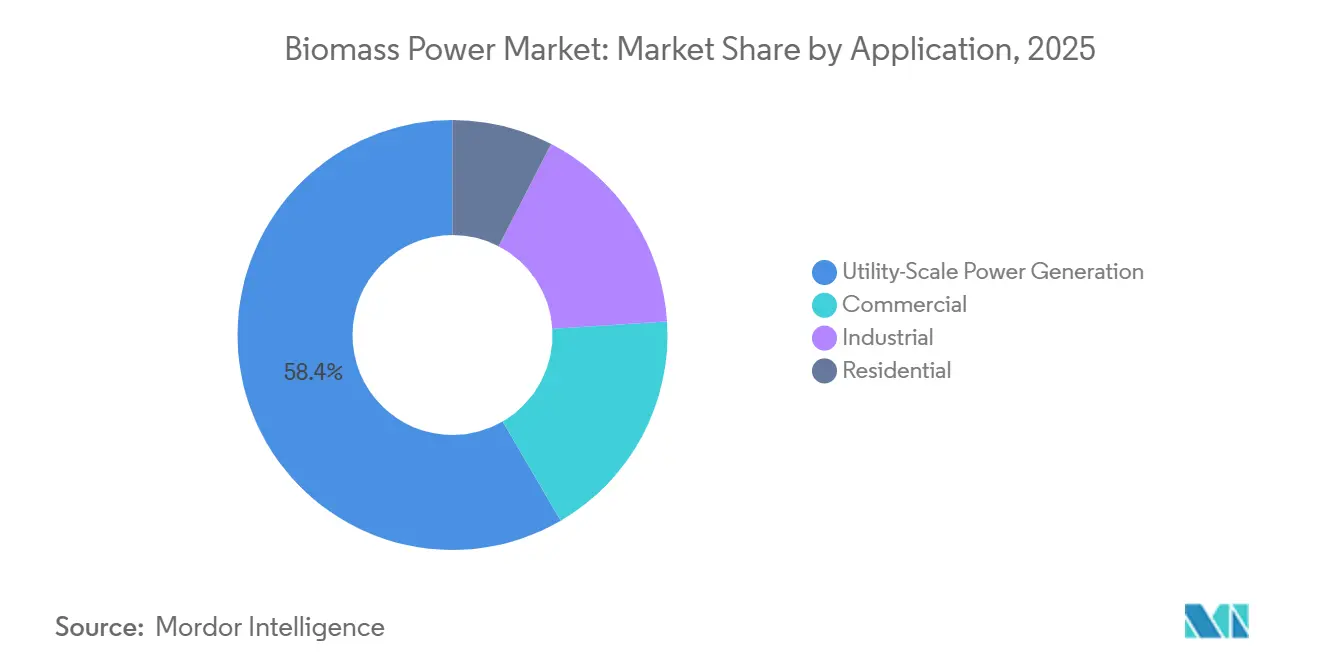
- By application, utility-scale power generation held 58.4% revenue share in 2025, while the commercial segment is forecast to grow at a 7.1% CAGR through 2031.
- By geography, Asia-Pacific held 39.2% revenue share in 2025 and is forecast to grow at a 7.9% CAGR through 2031.
Note: Market size and forecast figures in this report are generated using Mordor Intelligence’s proprietary estimation framework, updated with the latest available data and insights as of January 2026.
Global Biomass Power Market Trends and Insights
Drivers Impact Analysis*
| Driver | (~) % Impact on CAGR Forecast | Geographic Relevance | Impact Timeline |
|---|---|---|---|
| Dispatchable Renewable Power for Grid Flexibility | +1.80% | Global; concentrated in EU, UK, Japan, South Korea | Medium term (2–4 years) |
| Waste-Management and Circular-Economy Mandates | +1.10% | EU, East Asia, South and Southeast Asia | Medium term (2–4 years) |
| Industrial CHP Decarbonization | +0.80% | EU (Poland, Germany, Finland), Japan, Taiwan, India | Short to medium term (≤ 4 years) |
| Renewable Portfolio Standards and Net-Zero Incentives | +0.70% | North America, APAC (China, India, Vietnam), EU | Long term (≥ 4 years) |
| Coal-Plant Repurposing Through Biomass Co-Firing | +0.60% | China, Vietnam, Japan, Bulgaria, Australia | Medium term (2–4 years) |
| Low-Value Residue Monetization in Agricultural Regions | +0.50% | Southeast Asia, India, South America | Long term (≥ 4 years) |
| Source: Mordor Intelligence | |||
Dispatchable Renewable Power for Grid Flexibility
The Biomass power market benefits from generation that can be scheduled regardless of weather conditions. A 2025 study for the Renewable Energy Association found that biomass could provide up to 5.5 GW of firm capacity in Great Britain. This was equivalent to 90% of the country’s operational nuclear capacity. The study also found that wind output fell below 11% of rated capacity for periods of 6 hours or longer on 30 occasions in the year to March 2024. Keeping biomass capacity available could reduce the United Kingdom Capacity Market costs by GBP 900 million in 2028/29. Austria, Denmark, Finland, Sweden, and Germany have included flexible bioenergy in national decarbonization pathways to replace retiring dispatchable coal capacity before enough storage and other firm capacity is available[1]IEA Bioenergy Task 44, “Expectations on Flexible Bioenergy in Different Countries,” IEA Bioenergy, ieabioenergy.com.
Waste Management and Circular Economy Mandates
Waste rules are making municipal waste, agro-industrial effluent, and livestock manure more valuable as energy feedstocks. The European Biogas Association reported EUR 36 billion in biomethane investment commitments in 2026, compared with EUR 28 billion in the prior year. These commitments target 9 billion cubic meters of annual production capacity by 2030[2]European Biogas Association, “EBA Biomethane Investment Outlook 2026,” European Biogas Association, europeanbiogas.eu. Organic waste can produce both a disposal solution and a fuel source. This can reduce feedstock costs for anaerobic digestion projects compared with projects using dedicated energy crops or virgin biomass. The Biomass power market, therefore, has an opportunity where waste policy, local collection systems, and energy demand are aligned.
Industrial CHP Decarbonization
Industrial combined heat and power projects can replace fossil fuel heat and grid electricity at the same site. Valmet began delivery in December 2025 for Fortum’s EUR 85 million Zabrze CHP conversion in Poland. The project will replace coal with certified forest biomass and is expected to reduce annual carbon dioxide emissions by 280,000 tonnes[3]Valmet Oyj, “Valmet in Key Role to Decarbonize Fortum’s Zabrze Combined Heat and Power Plant in Poland,” Valmet Oyj, prnewswire.com. Valmet also received an order in November 2025 for a circulating fluidized bed boiler at Cheng Loong Corporation’s Houli paper mill in Taiwan. The company stated that the installation will cut annual carbon dioxide emissions by 48,000 tonnes and create Taiwan’s largest biomass energy cogeneration system. Biomass CHP can serve manufacturers where process heat needs remain difficult to electrify at scale.
Coal Plant Repurposing Through Biomass Co-Firing
Coal-to-biomass conversion can use existing turbines, grid links, and transmission infrastructure. This can reduce the capital requirement compared with a new power plant. In 2025, CHN Energy’s Unit 2 at Guangdong Qingyuan Power Plant became China’s first 1 GW ultra-supercritical unit to reach a 10% biomass thermal substitution rate. The project addressed storage, pulverization, and conveying issues associated with biomass feedstock. In January 2026, Erex and Vinacomin Power completed a 30% co-firing test at Cao Ngan Power Plant in Vietnam. The result exceeded the original 20% target, and the companies are targeting commercial 20%–30% co-firing at Vietnamese coal plants from fiscal 2026[4]erex Co., Ltd., “Completed Joint Test with Vietnam’s Vinacomin Power Holdings,” erex, erex.co.jp. These projects develop fuel logistics, ash handling, and operating practices that could support later full conversions.
Restraints Impact Analysis*
| Restraint | (~) % Impact on CAGR Forecast | Geographic Relevance | Impact Timeline |
|---|---|---|---|
| Feedstock Sustainability and Competing Land Uses | -0.90% | EU, North America, Southeast Asia | Long term (≥ 4 years) |
| Seasonal, Distributed Feedstock Logistics | -0.50% | India, Southeast Asia, South America | Medium term (2–4 years) |
| Solar, Wind and Storage Cost Competition | -0.80% | Global; particularly APAC, North America | Medium to long term (2–5 years) |
| Policy and Carbon-Credit Dependence | -0.40% | EU, UK, Japan, South Korea | Short to medium term (≤ 4 years) |
| Source: Mordor Intelligence | |||
Feedstock Sustainability and Competing Land Uses
Feedstock certification and competition for land remain persistent constraints for the Biomass power market. The World Resources Institute found that biomass demand across energy, aviation fuel, and industrial chemicals could exceed sustainable supply. It also found that dedicated energy crops can create indirect land-use-change risk when they displace natural ecosystems. The European Commission’s Joint Research Centre documented competing demands from energy, food, and material uses of biomass in the European Union. Its report emphasized governance that gives priority to higher-value cascading uses before energy use. Developers increasingly need traceable supply chains and recognized certification to secure long-term offtake and financing.
Solar, Wind, and Storage Cost Competition
Lower solar, wind, and battery costs pressure biomass electricity projects that depend on support schemes. This effect is strongest where projects compete mainly on delivered power prices. Japan is excluding new woody biomass plants of 10 MW or more using general timber from feed-in tariff and feed-in premium support from fiscal 2026. Smaller facilities and plants using waste-based feedstocks remain eligible under the policy direction described in the supplied research draft. The Biomass power market can respond by focusing on grid support, carbon capture, and industrial process heat. These services are distinct from intermittent power output and may have separate sources of value. The resulting project case depends on whether those services are recognized in contracts and market rules.
*Our forecasts treat driver/restraint impacts as directional, not additive. The impact forecasts reflect baseline growth, mix effects, and variable interactions.
Segment Analysis
By Feedstock: Solid Biomass Leads While Biogas Builds Momentum
Solid biomass held 67.5% of Biomass power market share in 2025. Its position reflects established wood pellet supply chains, dedicated combustion assets, and trading links from North America and the Baltics to Europe and Asia. Liquid biomass remains concentrated in agro-industrial settings. Brazil’s sugarcane bagasse contributed to the country’s bioenergy capacity base in 2024. Solid biomass remains important for large plants with predictable fuel specifications. Its long-term position will depend on sustainable forestry practices, certification, and the availability of residues.
Biogas is forecast to grow at a 9.3% CAGR through 2031. The Biomass power market benefits where municipal waste, livestock manure, and agro-industrial effluent can be used as local feedstocks. European biomethane capacity reached 8.2 billion cubic meters per year by mid-2026. The reported total was more than 1 billion cubic meters higher than a year earlier, supported by EUR 36 billion in investment commitments. These feedstocks can avoid the land-use concerns associated with dedicated energy crops. This gives waste-based projects a stronger fit with emerging sustainability frameworks.



By Technology: Combustion Retains Scale While Anaerobic Digestion Grows
Combustion held 62.3% revenue share in 2025. Direct-fired boilers and circulating fluidized bed systems remain established options for utility and industrial facilities. Combustion systems can use solid fuels at large scale. Gasification and co-firing are receiving attention as coal retirement schedules advance. They can reuse turbines and grid interconnections at converted coal locations. Landfill gas, biomass CHP, and other conversion routes serve localized waste streams and specific energy needs.
Anaerobic digestion is forecast to grow at an 8.1% CAGR through 2031. The Biomass power market can use this technology where waste disposal obligations and methane control policies create steady feedstock availability. A 2025 peer-reviewed study assessed agricultural-residue anaerobic digestion in Southeast Asia. It identified Indonesia, Malaysia, and Vietnam as priority locations under its modeled economics. Anaerobic digestion projects can earn waste tipping fees as well as revenue from electricity sales. This reduces reliance on a single revenue source. It can also make the projects more attractive to infrastructure investors.
By Capacity: Large Plants Provide Scale While Smaller Plants Expand
Plants above 100 MW accounted for 31.7% of the Biomass power market size in 2025. These assets often serve national grids and large industrial systems. Drax Power Station generated 15 TWh from its 4 biomass units in 2025. It provided 2.6 GW of dispatchable capacity during the year. The 50–100 MW range supports regional utilities, particularly where district heating provides stable demand. The 10–50 MW range is relevant to industrial estates in South and Southeast Asia.
The 1–10 MW segment is forecast to grow at a 7.5% CAGR through 2031. In this part of the Biomass power market, commercial and light-industrial buyers use these systems to manage grid tariffs and supply heat. Facilities below 1 MW can support rural electricity access in Sub-Saharan Africa and South Asia. A consortium led by Kansai Electric Power announced a 7.1 MW woody biomass facility in Tochigi, Japan, in December 2025. The project is intended to supply Tokyo Metro through a virtual power purchase agreement. The arrangement shows how corporate buyers can support smaller projects through new offtake structures. It also links project development to corporate clean-energy procurement.
By Application: Utility Scale Remains Central While Commercial Demand Rises
Utility-scale power generation held 58.4% of the Biomass power market in 2025. Within the Biomass power market, large plants support grid reliability in Europe, Asia-Pacific, and North America. They can provide output during periods when variable renewable generation is low. Industrial users include paper mills, chemical plants, sugar refineries, and cement facilities. These users can combine heat and electricity supply through CHP systems. Residential heating in Northern and Central Europe also adds to regional demand for biomass feedstocks.
The commercial segment is forecast to grow at a 7.1% CAGR through 2031. The Biomass power market is gaining commercial demand from hospitals, universities, and data-center campuses seeking continuous low-carbon energy. Nippon Steel Engineering commercialized a biomass CHP supply arrangement for Shin-Etsu Chemical Group sites in Thailand in February 2025. The project was developed under Japan’s Joint Crediting Mechanism. This model joins corporate decarbonization commitments with localized energy supply. It also broadens demand beyond utility procurement. Commercial buyers can value both reliability and on-site heat provision.
Geography Analysis
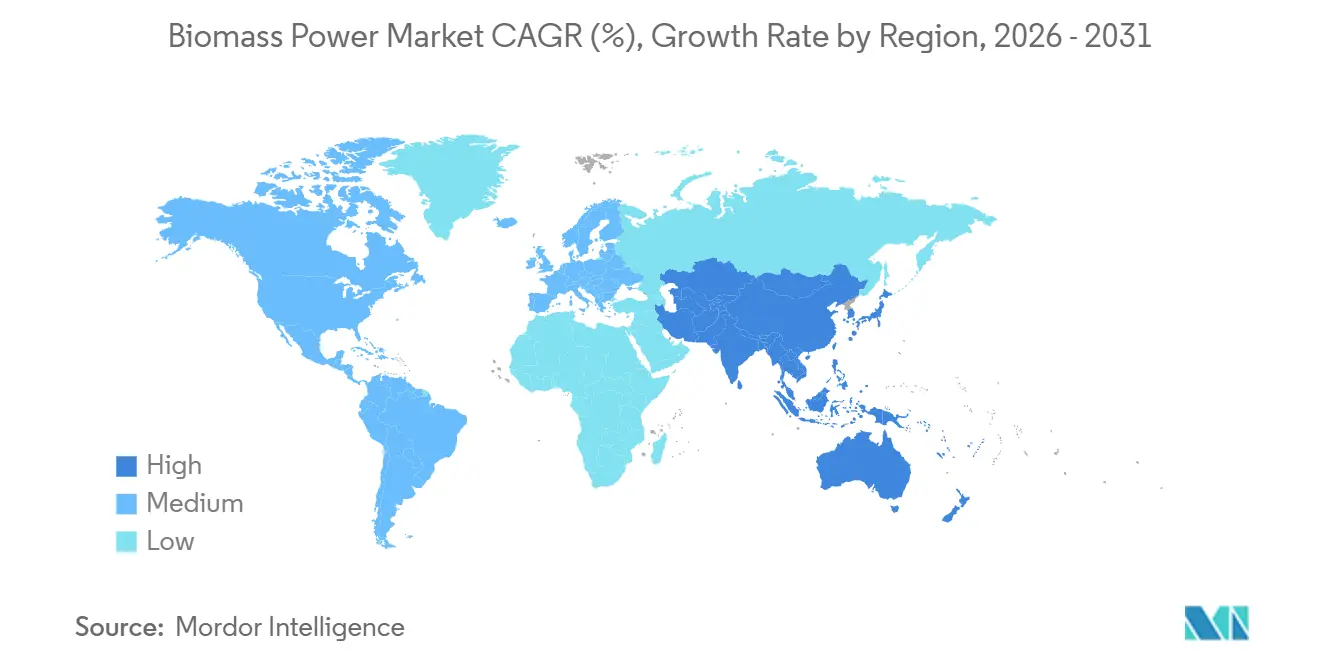
Asia-Pacific held 39.2% of Biomass power market share in 2025 and is forecast to grow at a 7.9% CAGR through 2031. China’s installed biopower capacity was 47.4 GW. New additions slowed to 200 MW in 2025 from 2.3 GW in 2021, according to the supplied research draft. Japan commissioned 2 plants of 50 MW in 2025 and has additional capacity planned. India’s installed bioenergy capacity reached 11.58 GW in fiscal 2025. India also had an estimated 295 million tonnes of biomass surplus in fiscal 2025, supporting a large potential resource base.
Europe is restructuring its Biomass power market toward CHP, biomethane, and carbon capture rather than standalone biomass electricity. France’s December 2025 DDADUE legislation transposed parts of the European Union RED III framework. The legislation withdraws public support for certain electricity-only biomass installations from mid-2026. Poland is drawing investment through CHP conversions in Zabrze and Częstochowa and through biomass logistics expansion at Polaniec. A 2025 academic review reported that bioenergy represented 14% of Europe’s total energy supply and 60% of its renewable energy mix. The shift favors projects that deliver heat, waste management, or carbon benefits alongside power.
North and South America give the Biomass power market resource bases in forest residues and sugarcane bagasse. Canada has more than 2,000 MW of forest-residue biomass power, according to the supplied research draft. Brazil had 18 GW of bioenergy capacity, mainly from sugarcane bagasse cogeneration, in 2024. Interest in bioenergy with carbon capture and storage is growing in the United States. In West Africa, Unit 2 of Côte d’Ivoire’s 46 MW Biovéa project began commercial operation in July 2026. The facility uses palm petioles and nutshells and is expected to generate 348 million kWh annually. Morocco, South Africa, and Egypt are identified in the supplied research draft as potential next locations for development.

Competitive Landscape
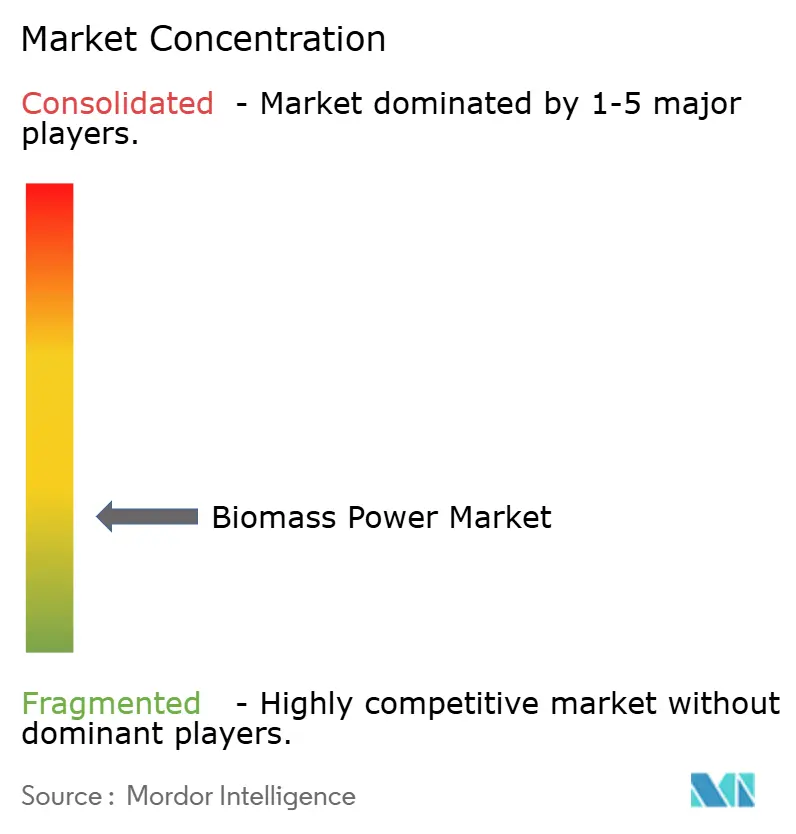
The Biomass power market is fragmented across utilities, equipment suppliers, and waste-management companies. It contains operators that own generation assets, manufacturers that supply boilers and controls, and companies that collect or process waste. Drax, Vattenfall, E.ON, and RWE operate or manage major European power assets. ENGIE, Enel, and EDF have biomass-related activities within wider energy portfolios. Valmet, ANDRITZ, Babcock & Wilcox, Mitsubishi Heavy Industries, Siemens Energy, and Hitachi Zosen provide engineering or equipment. Veolia and SUEZ connect waste management with energy recovery. Competition includes fuel procurement, plant conversion capability, project development, and services for grid operations. The range of business models means companies do not compete on the same terms in every project or location.
Coal-to-biomass conversion is a central strategy in the Biomass power market because it can limit stranded-asset exposure. Waste-stream integration can improve feedstock security while providing waste-management income. Grid services such as inertia, reserve, and voltage support can provide income beyond electricity sales. Drax is diversifying into battery storage, solar, and wind as its biomass revenue model changes. From April 2027, its capped contract for difference will be GBP 109.9/MWh in 2012 real terms. The company expects biomass to fall from 65% to 35% of its portfolio by 2029.
Valmet’s work on Fortum’s Zabrze conversion is an example of equipment suppliers benefiting from CHP transition projects. Its boiler order for Cheng Loong in Taiwan is another example of suppliers supporting industrial decarbonization. erex’s Cao Ngan co-firing test shows how developers are establishing operating experience before commercial deployment. Smaller firms such as Thermax and Ameresco compete through locally integrated development and operations. Process controls, gasification improvements, and torrefaction remain areas for technical differentiation. The Biomass power market therefore includes firms with different positions in power generation, equipment, and waste recovery. Their decisions can depend on local fuel availability, plant age, grid needs, policy rules, and industrial heat demand. This makes partnerships between utilities, fuel suppliers, and engineering firms relevant to project delivery.
Biomass Power Industry Leaders
Drax Group plc
Ørsted A/S
ENGIE SA
RWE AG
Enel SpA
- *Disclaimer: Major Players sorted in no particular order

Recent Industry Developments
- July 2026: Unit 2 of Côte d’Ivoire’s 46 MW Biovéa biomass power plant commenced commercial operations, making it the largest biomass clean energy project in West Africa. The facility generates 348 million kWh annually from palm petioles and nutshells.
- January 2026: erex and Vinacomin Power completed biomass co-firing tests at Cao Ngan Power Plant achieving a 30% co-firing ratio. Commercial 20%–30% biomass co-firing at Vietnamese coal plants is targeted from fiscal 2026.
- December 2025: Valmet commenced delivery for Fortum’s EUR 85 million Zabrze CHP coal-to-biomass conversion in Poland, reducing annual carbon dioxide emissions by 280,000 tonnes.
- November 2025: Valmet secured an order from Cheng Loong Corporation for a circulating fluidized bed boiler at the Houli paper mill in Taiwan, reducing annual carbon dioxide emissions by 48,000 tonnes.


Global Biomass Power Market Report Scope
Biomass power is the generation of electricity and/or heat from organic materials of biological origin, such as wood residues, agricultural waste, animal manure, municipal organic waste, and dedicated energy crops. Biomass can be converted into electricity through technologies such as direct combustion, gasification, anaerobic digestion, and co-firing. Biomass power is considered a renewable energy source when the biomass is sustainably sourced and managed, as the organic material can be replenished through natural or managed biological processes.
The Global Biomass Power Market is segmented by feedstock, technology, capacity, application, and geography. By feedstock, the market is segmented into solid biomass, biogas, and liquid biomass. By technology, the market is segmented into combustion, gasification, anaerobic digestion, co-firing, and other technologies. By capacity, the market is segmented into below 1 MW, 1–10 MW, 10–50 MW, 50–100 MW, and above 100 MW. By application, the market is segmented into residential, commercial, industrial, and utility-scale. The report also covers the market size and forecasts for the global biomass power market across 26 countries in key regions. For each segment, the market sizing and forecasts have been provided on the basis of value (USD).
| Solid Biomass |
| Biogas |
| Liquid Biomass |
| Combustion |
| Gasification |
| Anaerobic Digestion |
| Co-firing |
| Combined Heat and Power (CHP) |
| Landfill Gas-to-Power |
| Other Technologies |
| Below 1 MW |
| 1–10 MW |
| 10–50 MW |
| 50–100 MW |
| Above 100 MW |
| Residential |
| Commercial |
| Industrial |
| Utility-Scale Power Generation |
| North America | United States |
| Canada | |
| Mexico | |
| Europe | Germany |
| France | |
| Italy | |
| Spain | |
| United Kingdom | |
| Poland | |
| Russia | |
| Rest of Europe | |
| Asia-Pacific | China |
| India | |
| Japan | |
| South Korea | |
| Australia | |
| Indonesia | |
| Vietnam | |
| Thailand | |
| Rest of Asia-Pacific | |
| South America | Brazil |
| Argentina | |
| Chile | |
| Rest of South America | |
| Middle East and Africa | Saudi Arabia |
| United Arab Emirates | |
| Egypt | |
| South Africa | |
| Morocco | |
| Rest of Middle East and Africa |
| By Feedstock | Solid Biomass | |
| Biogas | ||
| Liquid Biomass | ||
| By Technology | Combustion | |
| Gasification | ||
| Anaerobic Digestion | ||
| Co-firing | ||
| Combined Heat and Power (CHP) | ||
| Landfill Gas-to-Power | ||
| Other Technologies | ||
| By Capacity | Below 1 MW | |
| 1–10 MW | ||
| 10–50 MW | ||
| 50–100 MW | ||
| Above 100 MW | ||
| By Application | Residential | |
| Commercial | ||
| Industrial | ||
| Utility-Scale Power Generation | ||
| By Geography | North America | United States |
| Canada | ||
| Mexico | ||
| Europe | Germany | |
| France | ||
| Italy | ||
| Spain | ||
| United Kingdom | ||
| Poland | ||
| Russia | ||
| Rest of Europe | ||
| Asia-Pacific | China | |
| India | ||
| Japan | ||
| South Korea | ||
| Australia | ||
| Indonesia | ||
| Vietnam | ||
| Thailand | ||
| Rest of Asia-Pacific | ||
| South America | Brazil | |
| Argentina | ||
| Chile | ||
| Rest of South America | ||
| Middle East and Africa | Saudi Arabia | |
| United Arab Emirates | ||
| Egypt | ||
| South Africa | ||
| Morocco | ||
| Rest of Middle East and Africa | ||


Key Questions Answered in the Report
How large is the Biomass Power Market?
The sector is estimated at USD 127.75 billion in 2026 and is forecast to reach USD 171.02 billion by 2031, growing at an 6.01 % CAGR.
What is driving biomass power demand through 2031?
Demand is supported by dispatchable generation needs, waste management rules, industrial CHP, and coal conversion opportunities. These needs are strongest where power systems require reliable output and industrial sites need both power and heat.
Which feedstock is growing fastest in biomass power?
Biogas is forecast to grow at a 9.3% CAGR through 2031. Growth is linked to municipal waste, livestock manure, agro-industrial effluent, and rules that encourage methane recovery and better waste handling.
Which technology is growing fastest through 2031?
Anaerobic digestion is forecast to grow at an 8.1% CAGR through 2031. It can combine revenue from waste services with revenue from electricity sales when dependable local feedstock collection is in place.
Which region is growing fastest for biomass power?
Asia-Pacific is forecast to grow at a 7.9% CAGR through 2031 after holding 39.2% revenue share in 2025. The region combines China’s installed capacity, Japanese projects, Indian residues, and coal co-firing activity.
Why are CHP projects important for industrial users?
CHP can provide electricity and process heat at the same facility, helping manufacturers reduce fossil fuel use. This is relevant to paper, chemical, sugar, and cement sites with continuing heat requirements.
Page last updated on:





