Market Overview
| Study Period | 2021 - 2031 |
|---|---|
| Forecast Data Period | 2026 - 2031 |
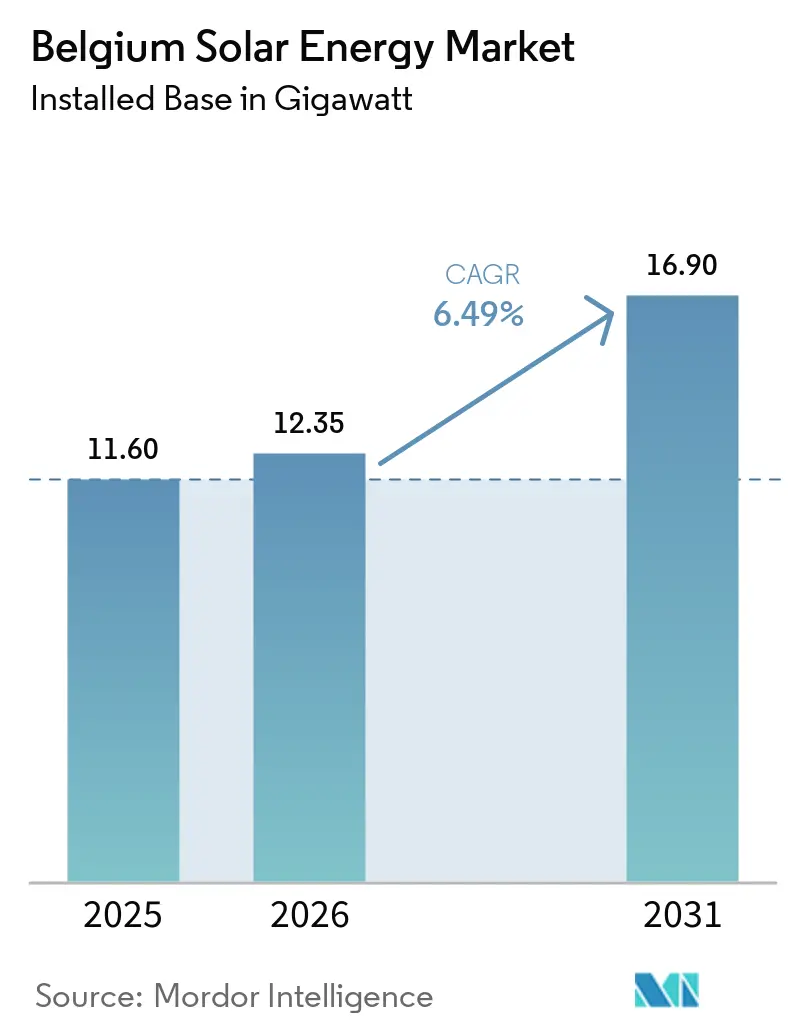
| Base Year Market Size (2025) | 11.60 gigawatt |
| Market Volume (2026) | 12.35 gigawatt |
| Market Volume (2031) | 16.90 gigawatt |
| Growth Rate (2026 - 2031) | 6.49% CAGR |
| Market Concentration | Low |
Major Players *Disclaimer: Major Players sorted in no particular order Image © Mordor Intelligence. Reuse requires attribution under CC BY 4.0. | |
Belgium Solar Energy Market Analysis by Mordor Intelligence
The Belgium Solar Energy Market size is expected to grow from 11.60 gigawatt in 2025 to 12.35 gigawatt in 2026 and is forecast to reach 16.9 gigawatt by 2031 at 6.49% CAGR over 2026-2031.
The expansion stems from the post-residential realignment toward commercial-and-industrial (C&I) rooftops and utility-scale arrays, propelled by tax deductions of 30%-40% on renewable assets and the Flemish obligation that large power users install photovoltaics. Equipment prices fell 35% during 2024, tightening EPC margins yet raising project returns for corporate buyers. Grid-management warnings from Elia about springtime curtailment, paired with capacity-based tariffs, are accelerating investments in storage and self-consumption tools. Competitive intensity is elevated as domestic EPC contractors face pan-European utilities and low-cost Asian suppliers.
Key Report Takeaways
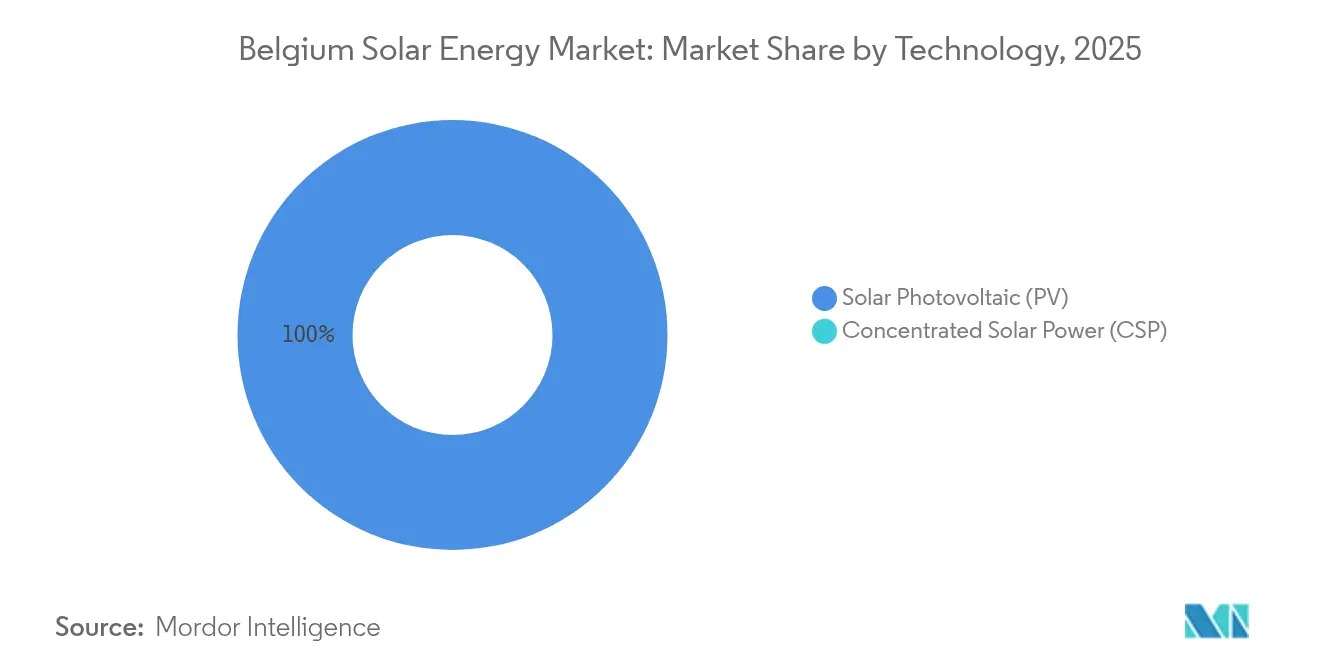
- By technology, solar photovoltaic captured 100.00% of installations in 2025 and is poised to grow at a 6.52% CAGR through 2031.
- By grid type, on-grid systems accounted for 99.10% of the Belgian solar energy market size in 2025, and off-grid applications are set to expand at a 9.88% CAGR to 2031.
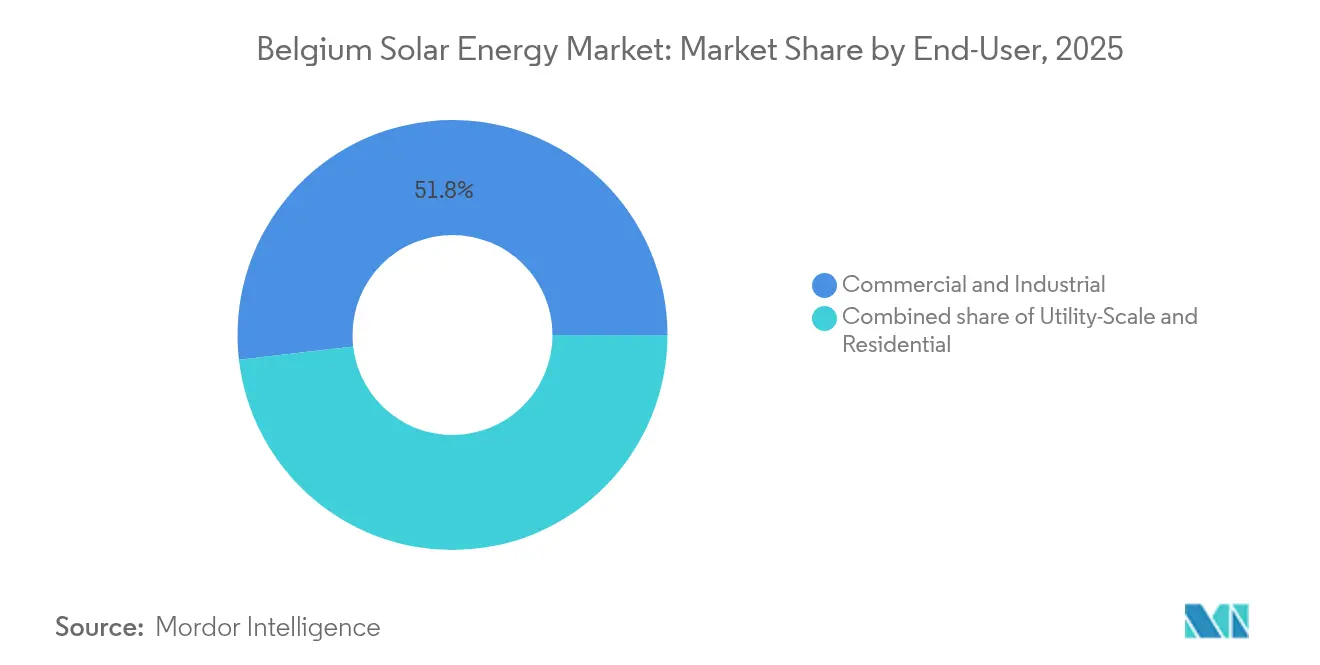
- By end-user, commercial-and-industrial installations led with 51.83% of Belgium's solar energy market share in 2025, while utility-scale projects are forecast to advance at an 8.52% CAGR through 2031.
Note: Market size and forecast figures in this report are generated using Mordor Intelligence’s proprietary estimation framework, updated with the latest available data and insights as of 2026.
Belgium Solar Energy Market Trends and Insights
Drivers Impact Analysis*
| Driver | (~) % Impact on CAGR Forecast | Geographic Relevance | Impact Timeline |
|---|---|---|---|
| Rooftop-solar VAT cut & green loan boom | +1.2% | Flanders, Brussels; limited Wallonia uptake | Short term (≤ 2 years) |
| EU and national 2030 RES targets | +1.5% | National; Wallonia & Brussels spearhead | Long term (≥ 4 years) |
| Steep module-price decline post-2023 | +1.8% | National, cross-border spill-over | Medium term (2-4 years) |
| Smart-meter roll-out enabling dynamic tariffs | +0.9% | Flanders, Brussels pilot zones | Medium term (2-4 years) |
| Residential battery subsidy legacy effect | +0.6% | Flanders | Short term (≤ 2 years) |
| Fibre-to-the-home densification | +0.4% | Urban Flanders, Brussels; rural Wallonia | Long term (≥ 4 years) |
| Source: Mordor Intelligence | |||
Rooftop-Solar VAT Cut and Green-Loan Boom
Belgium continues to levy a reduced 6% VAT on retrofit rooftop systems for homes over 10 years old, softening the withdrawal of the 0% rate on new builds that expired in 2024. Regional banks and credit unions channel dedicated green-finance lines that shave 1-1.5 percentage points off typical lending rates, converting many C&I projects into cash-flow-positive propositions from day one.[1]BNP Paribas Fortis, “Green Loan Programs,” bnpparibasfortis.be The 2025 investment deduction that allows companies to write off 30%-40% of renewable-asset costs against taxable income moves procurement from operating leases into outright ownership, consolidating purchasing power among corporates. Flanders, home to dense industrial roofs, captures a disproportionate share of this fiscal benefit; Wallonia’s pipeline relies more on contract-for-difference auctions where VAT treatments are irrelevant. Group-purchase schemes in East Flanders have aggregated 14,000 installations since 2019, slicing soft costs 12%-18% compared with single-buyer transactions.
EU and National 2030 Renewable-Energy Targets
Belgium’s National Energy and Climate Plan commits to a 47% greenhouse-gas reduction relative to 2005 by 2030, while Flanders targets just 40%, introducing policy dissonance that complicates inter-regional grid planning.[2]European Commission, “Renewable Energy Directive III,” ec.europa.eu The EU Renewable Energy Directive III orders every member state to hit 42.5% renewables in final energy use by 2030, forcing Belgium to average roughly 1.2 GW of solar additions yearly when nuclear-phase-out delays and offshore-wind bottlenecks are considered. Wallonia’s pivot from green certificates to competitive CfDs by 2028 matches EU state-aid rules yet imposes learning-curve risk on developers.[3]Walloon Government, “Green Certificate Phase-Out,” energie.wallonie.be Brussels sticks with a net-billing model that retains wholesale-rate credits for prosumers but caps system size at 10 kW. EnergyVille’s Perspective 2050 study says 40 GW of solar is essential by mid-century, signaling a quadrupling requirement from the 10.77 GW installed in 2024.
Steep Module-Price Decline After 2023
Spot prices for crystalline-silicon modules dropped 35% in 2024 as Chinese producers liquidated inventory created during the 2023 polysilicon glut, landing at EUR 0.09-0.13 / Wp.[4]SolarPower Europe, “European Module Price Trends,” solarpowereurope.org Although EPC margins narrowed 200-300 basis points, corporate off-takers saw internal rates of return climb 1.5-2 percentage points, igniting a spike in long-term power-purchase agreements. The European Commission’s termination of anti-dumping duties in September 2025 will sharpen competition and pressure Belgium’s sole panel maker, BelgaSolar, which added a 50 MWp line in 2024. Wallonia’s proposed 500 MW assembly plant, scheduled for 2025, will need local-content clauses or carbon-border-adjustment credits to protect margin. Advanced n-type TOPCon and heterojunction designs now exceed 60% of imports, meaning differentiation revolves around warranties and delivery reliability rather than converting efficiency alone.[5]VITO, “TOPCon and HJT Cell Research,” vito.be
Smart-Meter Roll-Out Enabling Dynamic Tariffs
Fluvius has already installed 4.4 million digital meters, aiming to convert the remaining 403,000 prosumers during 2025. Capacity-based tariffs introduced in 2023 levy charges on peak injection and withdrawal, penalizing midday exports and steering customers toward batteries or flexible loads. Scheduled 2026 time-of-use rates will price off-peak power at EUR 0.08-0.12 /kWh and evening peaks at EUR 0.25-0.35 /kWh. Elia’s PICASSO platform, live since 2024, already lets aggregators trade pooled residential batteries in balancing markets worth EUR 40-60 /MWh. Wallonia’s operator ORES trails the digital-meter curve by 3-5 years, meaning dynamic pricing advantages arrive later in the south.
Restraints Impact Analysis*
| Restraint | (~) % Impact on CAGR Forecast | Geographic Relevance | Impact Timeline |
|---|---|---|---|
| Distribution-grid congestion and curtailment risk | −1.4% | Flanders high-penetration zones, Brussels core | Medium term (2-4 years) |
| Phase-out of net-metering and green-certificate support | −1.1% | Flanders and Wallonia | Short term (≤ 2 years) |
| Rise of anti-green political parties | −0.5% | Flanders political arena | Long term (≥ 4 years) |
| EU CBAM and antidumping uncertainty on Chinese modules | −0.7% | National; manufacturing exposure in Wallonia | Medium term (2-4 years) |
| Source: Mordor Intelligence | |||
Distribution-Grid Congestion and Curtailment Risk
Elia forecasts that solar generation could exceed demand by 1.5-2 GW on bright spring days in 2025, triggering curtailment orders. Fluvius compensates generators above 10 kW at EUR 0.06-0.08 /kWh, but smaller prosumers go unpaid, raising fairness concerns. An estimated EUR 1.2-1.5 billion of network reinforcement is required before 2030, yet tariff recovery is politically sensitive. ORES faces parallel transformer constraints near Liège and Charleroi, forcing developers to co-fund EUR 0.5-1.5 million substation upgrades. Without locational marginal pricing, capital continues to flow into saturated zones, hampering efficient build-out.
Phase-Out of Net-Metering and Green-Certificate Support
Flanders scrapped net-metering for its final 403,000 prosumers in 2025, switching from retail equivalence to EUR 0.04-0.06 /kWh wholesale credits. Wallonia ended net-metering in 2023 and will phase out green certificates by 2028, exposing developers to pure merchant risk. Brussels keeps wholesale plus EUR 0.02 /kWh, but caps system size at 10 kW. Supplier certificate quotas fall from 13% in 2024 to 9% by 2030, depressing certificate prices 20%-30%. Payback periods lengthen for households, tilting the Belgian solar energy market toward C&I and utility-scale segments where tax shields and PPAs drive returns.
*Our forecasts treat driver/restraint impacts as directional, not additive. The impact forecasts reflect baseline growth, mix effects, and variable interactions.
Segment Analysis
By Technology: Photovoltaic Dominance, CSP Absent
Solar photovoltaic technology accounted for 100.00% of the Belgian solar energy market size in 2025 and is predicted to maintain 6.52% growth through 2031. The shift from polycrystalline toward n-type TOPCon and heterojunction cells lifted module efficiencies to 22%-24%, eclipsing older multicrystalline lines by 200-300 basis points. Bifacial panels represented about 40% of utility new-builds, adding 10%-15% yield on reflective surfaces. Domestic R&D consortia led by VITO, imec, and Hasselt University target >30% tandem efficiencies before 2027, but encapsulation and RoHS-driven lead limits still hinder commercialization. Building-integrated photovoltaics (BIPV) hovered near 1% of distributed capacity in 2024; imec’s BIPV4ALL initiative, launched in 2024, aims to cut system costs 30% via standardized mounting.
The Belgium solar energy market share for photovoltaics, therefore, remains absolute, as the nation’s flat topography and moderate irradiance render concentrated solar power uneconomical. Innovation has migrated from silicon wafers to balance-of-system components such as lightweight composite frames and recyclable backsheets, allowing EPCs to protect margin in an environment of relentless module commoditization.


By Grid Type: On-Grid Hegemony, Off-Grid Niche Acceleration
On-grid projects controlled 99.10% of the Belgian solar energy market in 2025. Dense urban load centers, simple interconnection procedures, and legacy feed-in policies encouraged grid dependence, yet capacity charges and curtailment warnings are prompting developers to co-site storage or design islanding functionality. Off-grid systems, although small, are forecast to grow 9.88% annually through 2031 as telecoms, agriculture, and edge-computing operators value resilience over export revenues. Proximus installed more than 500 solar-plus-battery micro-sites by 2024, each saving EUR 500-800 per year in diesel and maintenance. In Wallonia’s remote farms, solar pumps negate EUR 15 000-25 000 per-kilometer transmission trenches.
Within on-grid growth, Flemish C&I rooftops dominate because the 1 GWh-consumption mandate is triggering 300-400 MW of rapid procurement. Utility-scale developers face 18-24-month interconnection queues in saturated Flemish nodes and therefore flock to Wallonia, where transformer headroom remains. New utility assets now integrate co-located batteries to duck midday curtailment and arbitrage evening peaks, blurring the line between grid-connected and hybrid micro-grids.
By End-User: C&I Leadership, Utility-Scale Surge
Commercial-and-industrial rooftops captured a 51.83% Belgium solar energy market share in 2025, owing to tax breaks and the Flemish mandate imposing EUR 400 penalties per missing kWp. Residential uptake fell 60% once net-metering ended, but existing households with batteries still reach 7-9-year paybacks under capacity tariffs. Utility-scale projects will record the fastest 8.52% CAGR as Wallonia transitions from green certificates to CfDs, and corporate PPAs guarantee 15-20-year revenue streams.
Corporate PPAs are multiplying: Google contracted 118 MW with Engie in 2024, while AB InBev shields 250 GWh of demand through a virtual cross-border deal with ENGIE. Public buildings consuming above 250 MWh annually must install solar by 2026 in Flanders, dragging schools, universities, and hospitals into the procurement funnel. Land scarcity motivates agrivoltaic schemes such as the SYMBIOSYST demo, where elevated panels shelter sugar beets while yielding clean power.
Geography Analysis
Flanders accounted for roughly 64.35% of installations in 2025, topping 7.46 GW and 842 Wp-per-capita penetration, the world’s highest outside Australia. Annual builds are expected at 600-700 MW, a moderation from the 1 GW per-year peaks of 2021-2023, yet sufficient to reach the 10 GW regional goal for 2030. Complete smart-metering coverage (4.4 million devices) positions Flanders as a sandbox for battery aggregation; Elia’s PICASSO platform already enrolls household fleets at EUR 40-60 /MWh balancing prices.
Wallonia held 30.55% of capacity and is pivoting to utility-scale solar paired with local module production under a 500 MW assembly plant. The 90,000-panel HELIOS project near Liège and agrivoltaic pilots in the Charleroi corridor illustrate the mix of brownfield and agricultural sites on offer. Developers, however, must help finance substations costing EUR 0.5-1.5 million because ORES lacks tariff room for rapid upgrades. Lower population density makes dual-land-use more attractive, with elevated panels allowing crops or grazing beneath.
Brussels contributed 5.10% of the installed stock, hampered by protected architecture and roof-load limits. The capital leans on extra-territorial generation, such as the 37 MWp array at Ostend-Bruges airport in West Flanders, set for 2026 commissioning. Heritage constraints confine rooftop growth to modern commercial districts and public facilities. The region retains net-billing support, preserving modest residential returns but capping system scale at 10 kW.
Inter-regional power flows matter: Belgium remains well-interconnected with France, the Netherlands, and Germany, reducing curtailment frequency by exporting surplus midday generation to ELIA. Even so, Elia’s spring-2025 over-generation alert shows regional coordination must deepen. Floating PV prototypes in the North Sea (SWiM) could unlock 500 MW-1 GW by 2030, pending maritime-spatial planning approvals.
Competitive Landscape
The Belgian solar energy market is semi fragmented. Engie Electrabel and EDF Luminus together control major utility and large-C&I capacity, complemented by EPC firms Enerdeal, Soltech, and 3E that dominate sub-5 MW segments. Chinese module makers JinkoSolar, Canadian Solar, and Trina Solar supply more than 70% of panels, leveraging 30%-40% cost advantages over European production. Inverters pit European leaders SMA and Fronius against Chinese entrants Sungrow and Huawei, with hybrid designs claiming 35%-40% of C&I deployments.
Strategically, vertical integration is expanding: Engie bundles 300 MW of PV with 200 MW / 800 MWh storage to provide firm renewable power strips to corporates ENGIE. Cooperatives such as Ecopower offer community equity, evidenced by a 4.7 MWp array at Peutie military base serving 60,000 members. Software is the new moat; 3E’s AI-powered asset-management platform, monitoring more than 2 GW in Belgium, predicts curtailment events and optimizes dispatch to lift yields 3%-5%. Compliance with IEC 61215 module testing and ISO 50001 energy-management standards is now routinely requested in PPA tenders, advantaging suppliers with robust quality control.
White-space niches include building-integrated photovoltaics, where imec’s BIPV4ALL aims for 30% cost reduction, and agrivoltaics, where SYMBIOSYST and HyPErFarm pilots prove elevated panels can coexist with cereal crops. Meanwhile, the European Commission’s Net-Zero Industry Act could funnel incentives to domestic manufacturing, offering lifelines to BelgaSolar and Wallonia’s planned 500 MW line.
Belgium Solar Energy Industry Leaders
Engie Electrabel
EDF Luminus
Eneco Belgium
7C Solarparken AG
Orka Power
- *Disclaimer: Major Players sorted in no particular order

Recent Industry Developments
- February 2025: Giga Storage expanded the Green Turtle battery in Dilsen-Stokkem to 700 MW/2,800 MWh, with construction 2025-2028, creating Europe’s largest storage asset.
- January 2025: Engie Electrabel energized a 200 MW / 800 MWh battery at Vilvoorde and a 2.3 MW lightweight rooftop on SABIC’s Genk plant.
- December 2024: TotalEnergies commissioned a 25 MW / 75 MWh battery in Feluy, scheduled for full operation by late 2025.
- November 2024: Ostend-Bruges International Airport granted EnergyVision a EUR 35 million contract for a 37 MWp solar plant with battery integration, set for 2026.
- October 2024: Flanders recorded its one-millionth PV installation, exceeding 7 GW cumulative and reaffirming a 10 GW goal for 2030.
- September 2024: Wallonia announced a 500 MW module line for 2025 commissioning under the Net-Zero Industry Act.


Belgium Solar Energy Market Report Scope
Solar energy is radiant light and heat from the Sun that is harnessed using a range of technologies such as solar power to generate electricity and solar thermal energy (including solar water heating), and solar architecture. The report offers the market sizing and forecasts for each segment based on installed capacity (in MW). The Belgian Solar Energy Market report includes:
By Technology
| Solar Photovoltaic (PV) |
| Concentrated Solar Power (CSP) |
By Grid Type
| On-Grid |
| Off-Grid |
By End-User
| Utility-Scale |
| Commercial and Industrial (C&I) |
| Residential |
By Component (Qualitative Analysis)
| Solar Modules/Panels |
| Inverters (String, Central, Micro) |
| Mounting and Tracking Systems |
| Balance-of-System and Electricals |
| Energy Storage and Hybrid Integration |
| By Technology | Solar Photovoltaic (PV) |
| Concentrated Solar Power (CSP) | |
| By Grid Type | On-Grid |
| Off-Grid | |
| By End-User | Utility-Scale |
| Commercial and Industrial (C&I) | |
| Residential | |
| By Component (Qualitative Analysis) | Solar Modules/Panels |
| Inverters (String, Central, Micro) | |
| Mounting and Tracking Systems | |
| Balance-of-System and Electricals | |
| Energy Storage and Hybrid Integration |


Key Questions Answered in the Report
How fast is the Belgium solar energy market expected to grow between 2026 and 2031?
Installed capacity is forecast to rise from 12.35 GW to 16.9 GW at a 6.49% CAGR.
Which user segment leads current capacity?
Commercial-and-industrial rooftops held 51.83% Belgium solar energy market share in 2025.
What policy most impacts household project economics?
The 2025 end of net-metering in Flanders replaced retail-rate credits with wholesale payments, extending paybacks to 7-9 years.
Who supplies most of Belgium's solar modules?
Chinese firms such as JinkoSolar, Canadian Solar, and Trina Solar deliver more than 70% of panels.
How are grid-congestion problems being mitigated?
Elia issues curtailment warnings, Fluvius compensates large arrays, and developers co-locate batteries while EUR 1.2-1.5 billion in upgrades are planned.
Is domestic manufacturing expanding?
Yes, Wallonia will open a 500 MW module line in 2025 and BelgaSolar added a 50 MWp circular-economy line in 2024.
Page last updated on:


