Belgium Data Center Power Market Size and Share
Market Overview
| Study Period | 2020 - 2031 |
|---|---|
| Forecast Data Period | 2026 - 2031 |
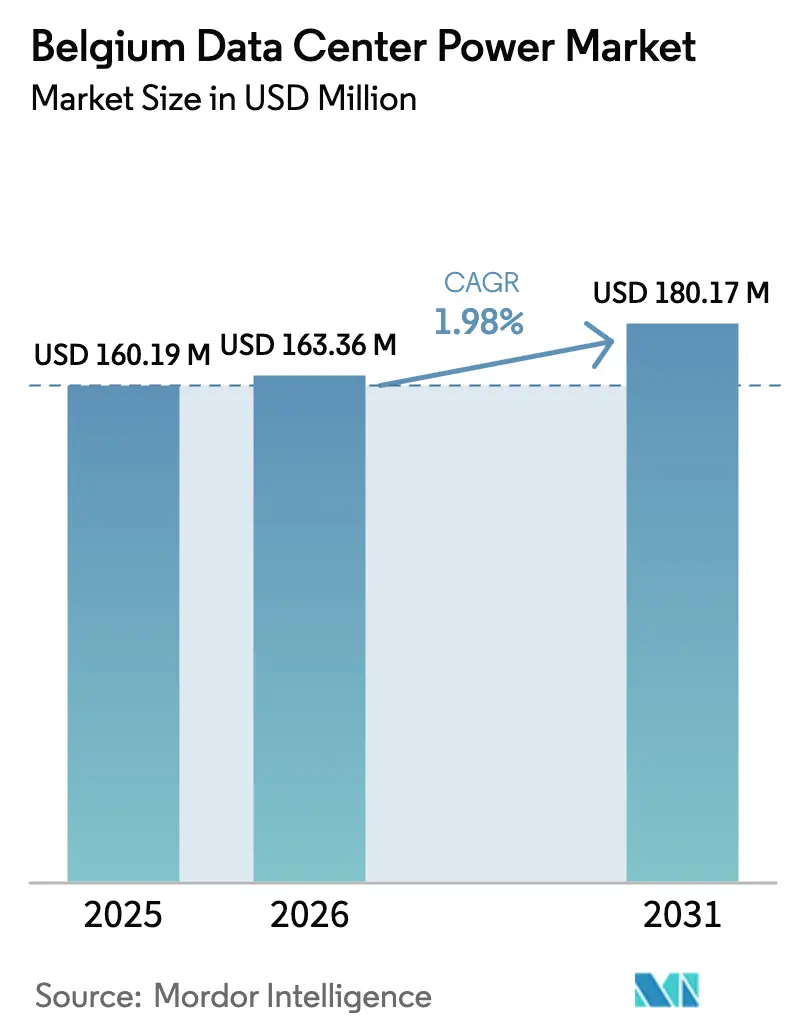
| Base Year Market Size (2025) | USD 160.19 Million |
| Market Size (2026) | USD 163.36 Million |
| Market Size (2031) | USD 180.17 Million |
| Growth Rate (2026 - 2031) | 1.98% CAGR |
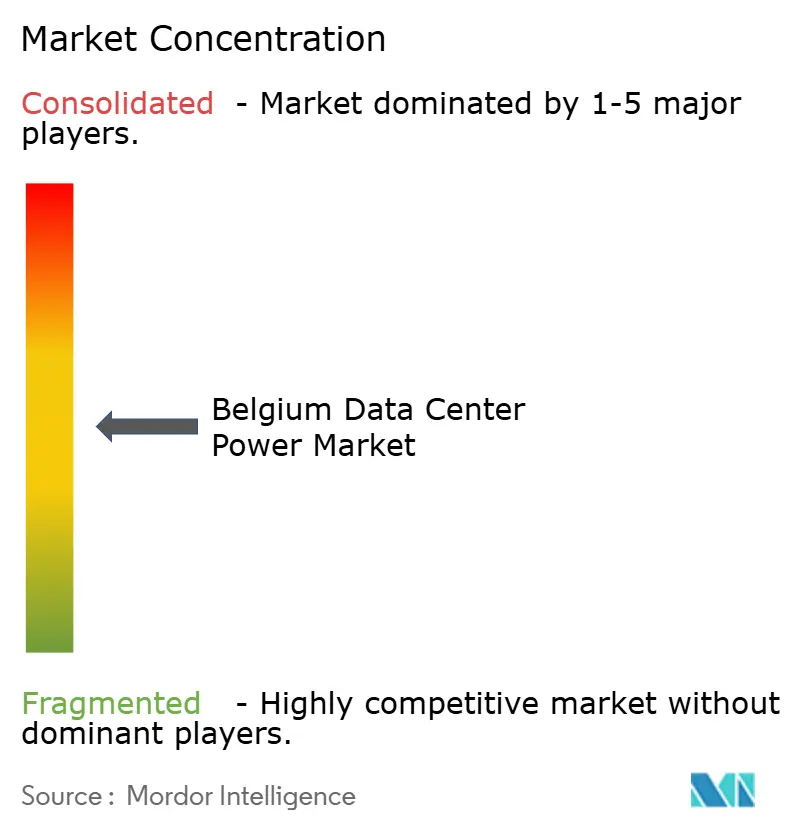
| Market Concentration | Medium |
Major Players *Disclaimer: Major Players sorted in no particular order Image © Mordor Intelligence. Reuse requires attribution under CC BY 4.0. | |
Belgium Data Center Power Market Analysis by Mordor Intelligence
The Belgium data center power market size was valued at USD 160.19 million in 2025 and estimated to grow from USD 163.36 million in 2026 to reach USD 180.17 million by 2031, at a CAGR of 1.98% during the forecast period (2026-2031). Continued hyperscale investmentillustrated by Google’s groundbreaking of a USD 1 billion second campus in April 2024, anchors steady demand for high-efficiency power infrastructure. Power density requirements are rising fast as sovereign AI programs push rack loads from typical 10 kW into the 100 kW-plus range, accelerating liquid-cooling adoption and reshaping power distribution architectures. Stringent EU sustainability rules, together with corporate renewable-energy purchase agreements, are pivoting backup strategies toward battery storage that can also support grid services. Supply-chain friction remains a brake: delivery lead times for UPS systems and generators now reach two years, forcing operators to lock in commitments early. Meanwhile, Belgium’s capacity auctions awarded 357 MW of battery storage for 2027-28, foreshadowing grid-interactive data centers that earn ancillary-services revenue instead of drawing passive loads
Key Report Takeaways
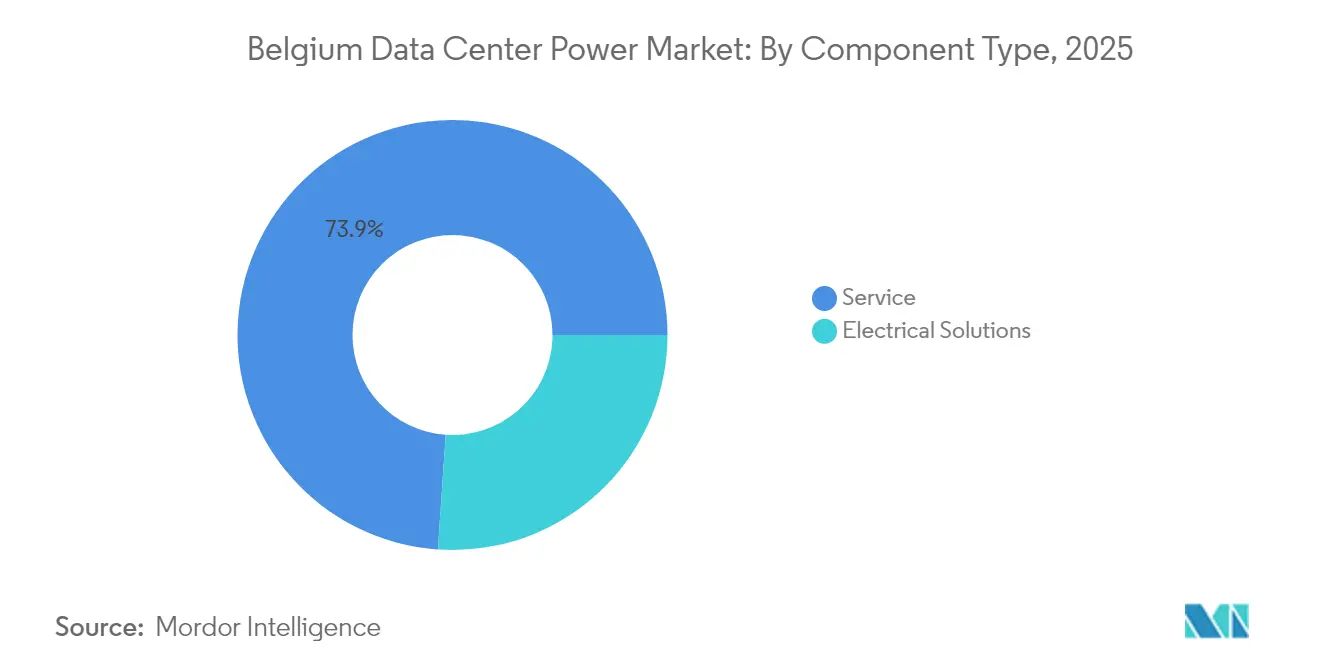
- By component, UPS systems led with 26.08% of the Belgium data center power market share in 2025; power distribution units (PDUs) are forecast to grow at a 3.92% CAGR through 2031.
- By data center type, colocation providers held 47.05% of the Belgium data center power market share in 2025, while hyperscale/cloud service providers are projected to post the fastest 6.06% CAGR to 2031.
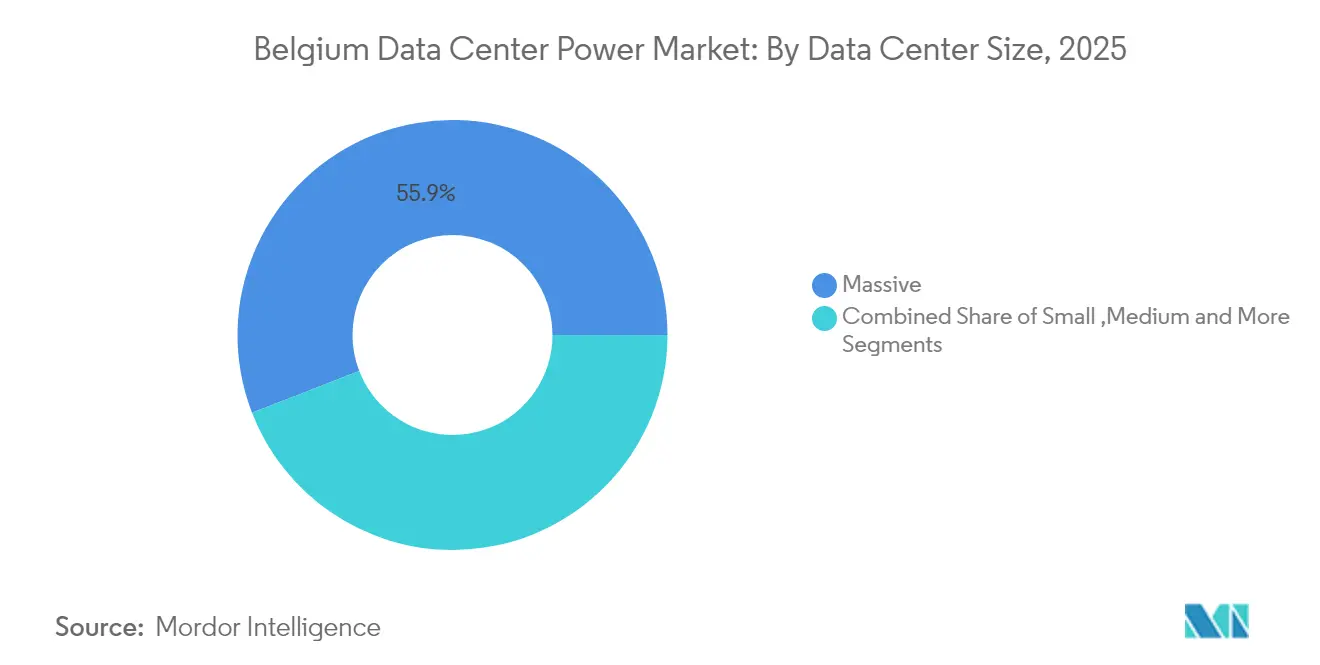
- By size, massive facilities accounted for 55.88% of the Belgium data center power market size in 2025; the mega segment is expected to advance at a 7.1% CAGR through 2031.
- By tier level, Tier III captured 76.65% revenue in 2025; Tier IV is the quickest-growing category with a 6.16% CAGR outlook.
Note: Market size and forecast figures in this report are generated using Mordor Intelligence’s proprietary estimation framework, updated with the latest available data and insights as of 2026.
Belgium Data Center Power Market Trends and Insights
Drivers Impact Analysis*
| Driver | (~)% Impact on CAGR Forecast | Geographic Relevance | Impact Timeline |
|---|---|---|---|
| Rising adoption of mega data centers and cloud computing | +0.8% | Brussels metro, with spillover to Flanders and Wallonia | Medium term (2-4 years) |
| Increasing demand to reduce operational costs via high-efficiency power architectures | +0.4% | National, with concentration in industrial clusters | Short term (≤ 2 years) |
| Expansion of hyperscale and colocation footprints across Brussels metro | +0.6% | Brussels metro core, extending to Antwerp corridor | Medium term (2-4 years) |
| Corporate renewable-energy PPAs accelerating onsite green backup power adoption | +0.3% | National, with early adoption in Brussels and Antwerp | Long term (≥ 4 years) |
| Roll-out of smart-grid-ready UPS enabling participation in ancillary services markets | +0.2% | National grid integration points | Long term (≥ 4 years) |
| Government incentives for large-scale battery energy-storage integration | +0.3% | National, with regional variations in Flanders and Wallonia | Medium term (2-4 years) |
| Source: Mordor Intelligence | |||
Rising adoption of mega data centers and cloud computing
Hyperscale operators have pivoted from dispersed edge footprints toward consolidated mega campuses that exceed 100 MW, improving both capital efficiency and PUE. Google’s EUR 600 million fourth Belgian campus proved the model and set off a wave of equal-or-larger builds driving fresh demand for high-capacity UPS, switchgear, and sub-station upgrades.[1]Data Center Dynamics, “Google breaks ground on second Belgian campus,” datacenterdynamics.com Consolidation also raises interest in district-level energy systems where multiple sites pool battery storage to earn capacity-market revenue.
Increasing demand to reduce operational costs via high-efficiency power architectures
Belgian industrial power tariffs jumped 33% in 2025, turning efficiency from nice-to-have into board-level mandate.[2]The Brussels Times, “Industrial power tariffs to jump 33%,” brusselstimes.com Operators are shifting toward holistic DC-powered topologies, distributed satellite UPS, and predictive load-balancing analytics that trim lifecycle cost by up to 20%. Equipment vendors responded: Schneider Electric opened a dedicated AI-power test lab as part of its USD 700 million global investment plan
Expansion of hyperscale and colocation footprints across Brussels metro
Brussels now offers sub-5 ms latency to four major EU hubs via redundant dark-fiber routes designed into Kevlinx’s BRU01 complex kevlinx.com. Digital Realty’s three Brussels sites connect directly to BNIX and NL-ix, attracting enterprise clients requiring multi-cloud interconnect.[3]Digital Realty, “Brussels campus overview,” digitalrealty.com Colocation leaders extend power demand beyond their walls by anchoring edge nodes and promoting district-level microgrids
Corporate renewable-energy PPAs accelerating on-site green backup power adoption
Google’s 118 MW off-take deal with Engie in July 2024 represents the sector’s largest Belgian clean-power contract and accompanies a lithium-ion battery pilot that eliminates diesel gensets at St. Ghislain. The model links emission reduction with ancillary-services revenue, encouraging peers such as LCL Data Centers to integrate solar and battery arrays sized at 10.3 MW
Restraints Impact Analysis*
| Restraint | (~)% Impact on CAGR Forecast | Geographic Relevance | Impact Timeline |
|---|---|---|---|
| High installation and maintenance costs of tier-graded power systems | -0.3% | National, with higher impact in Tier IV deployments | Short term (≤ 2 years) |
| Grid connection delays and limited spare capacity in industrial clusters | -0.4% | Brussels metro and Antwerp industrial zones | Medium term (2-4 years) |
| Political uncertainty around environmental permits for hyperscale builds | -0.2% | National, with regional variations | Medium term (2-4 years) |
| Stricter emission rules increasing lifecycle cost of diesel generator sets | -0.3% | National, with EU-wide regulatory alignment | Long term (≥ 4 years) |
| Source: Mordor Intelligence | |||
High installation and maintenance costs of tier-graded power systems
Tier IV architecture commands a 40–60% capex premium over Tier III because of double-bus distribution and maintenance bypasses. Belgium’s limited pool of certified power engineers inflates O&M budgets, diminishing ROI for colocation providers targeting price-sensitive enterprise workloads. LuxConnect’s twin 10 MVA feeds highlight the financial hurdle many Belgian peers face
Grid connection delays and limited spare capacity in industrial clusters
Transmission operator Elia warns that electrification is outpacing grid upgrades, pushing lead times for new high-capacity feeds beyond 18 months in Brussels and Antwerp. Large battery parks—such as the 800 MWh Vilvoorde project—absorb further margin in the connection queue, leaving data centers competing on both timing and cost
*Our forecasts treat driver/restraint impacts as directional, not additive. The impact forecasts reflect baseline growth, mix effects, and variable interactions.
Segment Analysis
By Component: Intelligent PDUs accelerate AI transition
The segment opened 2025 with UPS systems holding 26.08% of Belgium data center power market share, underscoring their legacy dominance. Yet the Belgium data center power market size attributable to PDUs is set to expand fastest as AI-ready liquid cooling forces sophisticated branch-circuit monitoring in every rack. Intelligent PDUs that couple metering with AI-based load orchestration help operators squeeze 1–2 percentage points from power-usage effectiveness while satisfying EU sustainability audits.
Second, energy-storage systems outpace all other categories as Belgium’s 1.1 GW of capacity-auction awards transform batteries from standby assets into revenue-earning grid tools. Generators remain vital for extended outages but face tightening NOx rules. Remote power panels gain relevance among edge nodes where floor space is scarce yet compliance with Tier III electrical segregation is non-negotiable. Modular skids that combine switchgear, rectifiers, and lithium-ion strings in ISO containers shorten build schedules by 50% and are now standard in hyperscale RFPs.


By Data Center Type: Hyperscale momentum reshapes demand
Colocation providers still account for 47.05% of 2025 revenue, but hyperscale/cloud operators drive almost all incremental power-infrastructure spending. Their 6.06% CAGR reflects AI training clusters requiring 80–120 MW per hall and PDUs rated for 130 kW racks, lifting the Belgium data center power market. Hyperscale design also introduces flywheel-assisted UPS and grid-interactive batteries that rewrite standby economics by exporting synthetic inertia and frequency response.
Enterprise footprints continue a gradual retreat into colocation halls except where data sovereignty or latency dictates on-prem deployment. Edge facilities remain niche; many enterprises instead adopt regional cloud zones reachable in sub-10 ms. For suppliers, the shift moves revenue mix toward fully-engineered power rooms shipped pre-wired rather than discrete UPS boxes. Contract structures likewise shift to outcome-based SLAs that price resilience and efficiency, not hardware.
By Data Center Size: Mega facilities claim capital-efficiency lead
Mega sites—those above 30 MW—register a forecast 7.1% CAGR, overtaking massive sites in new build count by 2027. Kevlinx’s BRU01, designed for 32 MW, exemplifies the scale advantage: shared chillers, onsite 100 kV sub-station, and battery arrays configurable for frequency-regulation revenue. These factors let operators recoup capital faster, tilting procurement toward high-capacity ring-bus switchgear and 13.8 kV UPS systems made in Belgium’s Evergem plant opened by ABB in 2024..
Smaller tiers—large, medium, and small—retain specialized roles such as low-latency trading or regulated workloads requiring in-country isolation. However, without scale to justify advanced energy-storage integration, many rely on diesel gensets facing EU Stage V compliance cost increases. The Belgium data center power market size flowing into small and medium categories therefore trails headline growth, even as refurbishment budgets rise for containment retrofits and PDU upgrades.
By Tier Level: Mission-critical workloads lift Tier IV
Tier III still represents 76.65% of installed capacity, but Tier IV attracts the most vigorous 6.16% CAGR through 2031 as banks and public agencies refuse the risk of concurrent repair downtime. Tier IV designs now integrate dual-fed battery storage so either path supports grid-services participation, monetizing surplus capacity during off-peak windows. That commercial upside makes the Belgium data center power market share shifting to Tier IV less about pure resilience and more about revenue potential.
Tier I and II footprints continue to wane except for lab and content-distribution nodes where redundancy can be virtual. Insurance premiums linked to downtime now encourage enterprises to upgrade legacy Tier II halls into Tier III via modular UPS benches and ring-bus switchgear rather than greenfield rebuilds. Suppliers of scalable power trains thus capture mid-life refresh cycles as well as new builds.
Geography Analysis
Belgium’s federal structure produces three subtly different value propositions for the Belgium data center power market. Brussels-Capital Region processes the majority of hyperscale and colocation energy demand because its cross-border fiber routes deliver sub-5 ms round-trip latency to London, Paris, Frankfurt, and Amsterdam. That network advantage, coupled with EU political institutions and a mature permitting regime, allows operators to secure quicker approvals for high-density halls. Grid stress is, however, acute; new 150 kV interconnects will not complete until 2027, so forthcoming sites embed battery storage as hedge against curtailment.
Flanders—centered on Antwerp—leans on industrial-scale generation assets and deep-water port logistics to attract logistics-and manufacturing-adjacent compute. Regional authorities sweeten deals with tax credits tied to cogeneration and waste-heat reuse, but available grid headroom is tighter than policy rhetoric suggests. Consequently, developers favor modular skids shipped through the port and commissioned in phases, aligning power draws with staggered connection allotments.
Wallonia differentiates on cost and renewable-energy abundance. Cheap land and favorable cooling ambient conditions appeal to enterprises less concerned with ultra-low latency yet eager for green credentials. The Digital Wallonia programme’s EUR 500 million incentive package supports local renewables that can supply data-center microgrids via long-term PPAs, cushioning operators against future carbon taxes. Collectively, these regional traits underpin Belgium’s position as Europe’s neutral digital gateway and sustain the Belgium data center power market through 2030.
Competitive Landscape
Competition is moderate but tightening as full-stack solution providers out-maneuver component-only vendors. ABB’s EUR 22.6 million Evergem plant underscores the importance of local manufacturing that shortens lead times—currently the sector’s main pain point abb.com. Schneider Electric, Vertiv, and Eaton intensify rivalry by bundling power, cooling, and digital-twin monitoring under outcome-based contracts that guarantee PUE and uptime. These integrated offers compress decision cycles and marginalize niche suppliers lacking systems-integration muscle.
Battery-storage specialists such as NHOA enter the fray on the back of Belgium’s 800 MWh Vilvoorde project, bringing grid-market savvy that legacy UPS firms are racing to emulate. Rolls-Royce’s mtu division, benefiting from a 56% profit surge in 1H 2024, leverages Tier IV generator expertise yet is under pressure to pair gensets with hydrogen or synthetic-fuel readiness. New entrants promoting prefabricated lithium-ion modules gain traction where hyperscalers demand 9-month delivery cycles, impossible with traditional steel-in-the-ground builds.
Artificial-intelligence overlays that forecast load and automate battery dispatch now tip RFP outcomes. Vendors embedding AI into power-train controllers command premiums, while hardware-only bids face commoditization. Expect continued consolidation as major OEMs acquire niche software firms to round out digital-services gaps, echoing Vertiv’s December 2024 chiller-technology buyout
Belgium Data Center Power Industry Leaders
ABB Ltd.
Eaton Corporation
Schneider Electric SE
Caterpillar Inc.
Vertiv Holdings Co
- *Disclaimer: Major Players sorted in no particular order

Recent Industry Developments
- June 2025: Schneider Electric and NVIDIA partnered on liquid-cooling systems aimed at European AI data centers
- May 2025: NHOA and Engie began construction of a 400 MWh battery storage system in Belgium to bolster grid stability and data-center resilience
- April 2025: Vertiv posted Q1 2025 net sales of USD 2.036 billion, up 24% on AI power-solution demand Rolls-Royce invested USD 24 million to double mtu generator output for data centers
- March 2025: Rolls-Royce invested USD 24 million to double mtu generator output for data centers
- February 2025: Vantage Data Centers committed EUR 1.4 billion to expand its EMEA platform, including Belgian assets.
- January 2025: Tractebel confirmed the 800 MWh Vilvoorde battery park will be operational in early 2026


Research Methodology Framework and Report Scope
Market Definitions and Key Coverage
Our study considers the Belgium data center power market as the yearly revenue earned inside the country from electrical equipment that conditions, stores, distributes, or switches power within purpose-built data center halls. Included are UPS systems, diesel or gas generators, power distribution units, switchgear, automatic transfer switches, remote power panels, and their related installation and upkeep services.
Scope Exclusion: Cooling hardware, building construction, IT equipment, and the cost of grid electricity lie outside this scope.
Segmentation Overview
- By Component
- Electrical Solutions
- UPS Systems
- Generators
- Diesel Generators
- Gas Generators
- Hydrogen Fuel-cell Generators
- Power Distribution Units
- Switchgear
- Transfer Switches
- Remote Power Panels
- Energy-storage Systems
- Service
- Installation and Commissioning
- Maintenance and Support
- Training and Consulting
- Electrical Solutions
- By Data Center Type
- Hyperscaler/Cloud Service Providers
- Colocation Providers
- Enterprise and Edge Data Center
- By Data Center Size
- Small Size Data Centers
- Medium Size Data Centers
- Large Size Data Centers
- Massive Size Data Centers
- Mega Size Data Centers
- By Tier Level
- Tier I and II
- Tier III
- Tier IV
Detailed Research Methodology and Data Validation
Primary Research
Mordor analysts held structured interviews with facility engineers, colocation managers in Brussels and Flanders, generator assemblers, and battery integrators to verify load factors, price spreads, and pipeline timing that public data could not capture.
Desk Research
We began with Elia Transmission load data, ENTSO-E generation statistics, and Belgian customs imports for UPS and generator HS codes. Reports from the EU Data Center Code of Conduct, DigitalEurope, and the Belgian Cloud Community outlined technology shifts, while company 10-Ks, investor decks, and D&B Hoovers gave pricing and installed-base clues. These sources are illustrative; many additional open and subscription references informed our groundwork.
Market-Sizing & Forecasting
A top-down model starts with installed and announced IT load (MW), applies typical electrical capex per MW curves, and then cross-checks totals with sampled vendor shipment revenue and channel checks. Core inputs include annual IT load additions, average UPS price, N+1 generator ratios, renewable share mandates, and tier mix shifts. Forecasts use a multivariate regression tied to IT load, grid tariff outlook, and GDP, with scenario analysis framing upside and downside ranges. Bottom-up gaps around edge sites were bridged using penetration factors agreed during interviews.
Data Validation & Update Cycle
Outputs pass two analyst reviews where anomalies are flagged against historic spend curves and vendor earnings. Reports refresh each year, with interim updates triggered by major capacity announcements or tariff moves, and a last-mile check ensures clients receive the most current view.
Why Our Belgium Data Center Power Baseline Commands Reliability
Published estimates often differ because firms mix equipment baskets, currency bases, and project assumptions.
Mordor Intelligence screens each Belgian project filing and corroborates spend ratios through on-ground calls, which keeps our baseline anchored to realities, not aspirations.
Benchmark comparison
| Market Size | Anonymized source | Primary gap driver |
|---|---|---|
| USD 160.19 million (2025) | Mordor Intelligence | |
| USD 651 million (2024) | Regional Consultancy A | Bundles cooling gear and grid energy; single exchange rate snapshot |
| EUR 600 million (2024) | Trade Journal B | Uses regional averages and assumes full funding of announced sites |
The comparison shows that by choosing a disciplined scope, applying probability weights to projects, and refreshing figures annually, Mordor Intelligence delivers the dependable baseline Belgian decision makers need.


Key Questions Answered in the Report
What is the current size of the Belgium data center power market?
The Belgium data center power market size is USD 163.36 million in 2026 and is projected to reach USD 180.17 million by 2031.
Which component segment is growing fastest?
Power distribution units lead growth at a 3.92% CAGR as AI-ready racks demand higher power-density management.
Why are batteries replacing diesel generators in Belgian data centers?
Corporate renewable-energy PPAs and EU emission rules push operators toward lithium-ion storage, which also earns ancillary-services revenue while meeting backup requirements.
Which data center type contributes most to new power-infrastructure demand?
Hyperscale/cloud service providers, expanding at a 6.06% CAGR, drive the majority of incremental investment through 2031.
How do grid constraints affect project timelines?
Connection queues in Brussels and Antwerp can add 18-24 months, making early engagement with Elia and on-site battery integration critical to meeting launch dates.
What tier level is gaining popularity and why?
Tier IV is gaining traction at a 6.16% CAGR because financial and government clients require the highest uptime and can monetize redundant battery capacity through grid-service participation.
Page last updated on:


