Belgium Data Center Market Size and Share
Market Overview
| Study Period | 2020 - 2031 |
|---|---|
| Forecast Data Period | 2026 - 2031 |
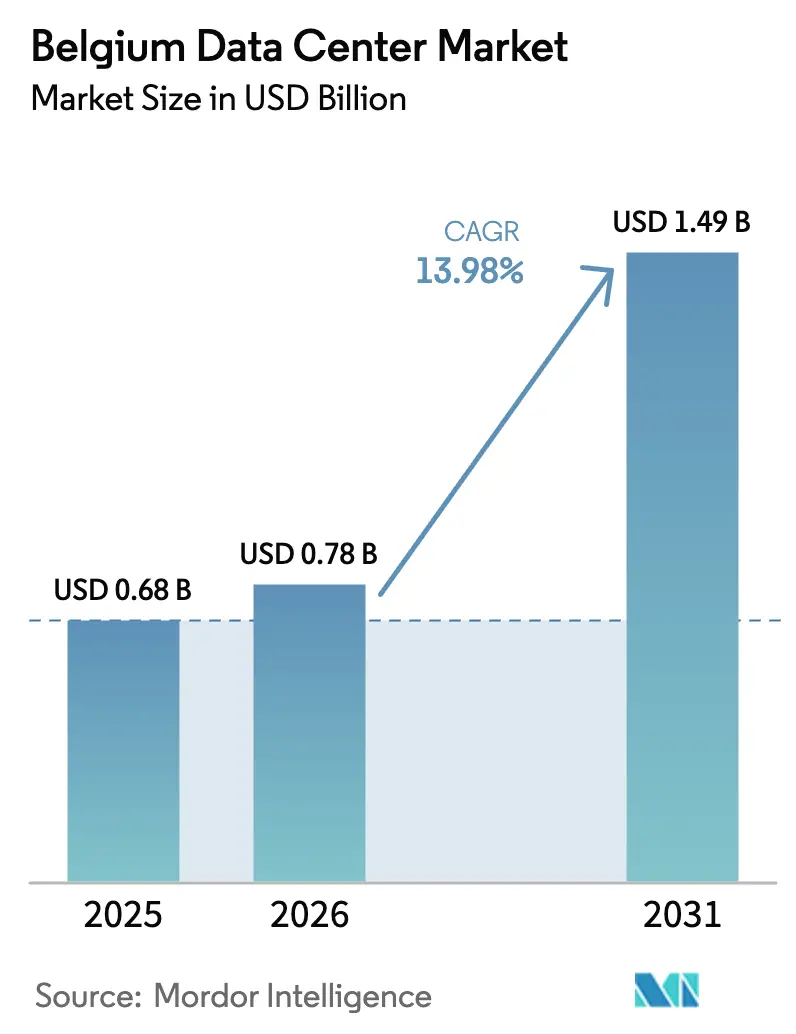
| Base Year Market Size (2025) | USD 0.68 Billion |
| Market Size (2026) | USD 0.78 Billion |
| Market Size (2031) | USD 1.49 Billion |
| Growth Rate (2026 - 2031) | 13.98% CAGR |
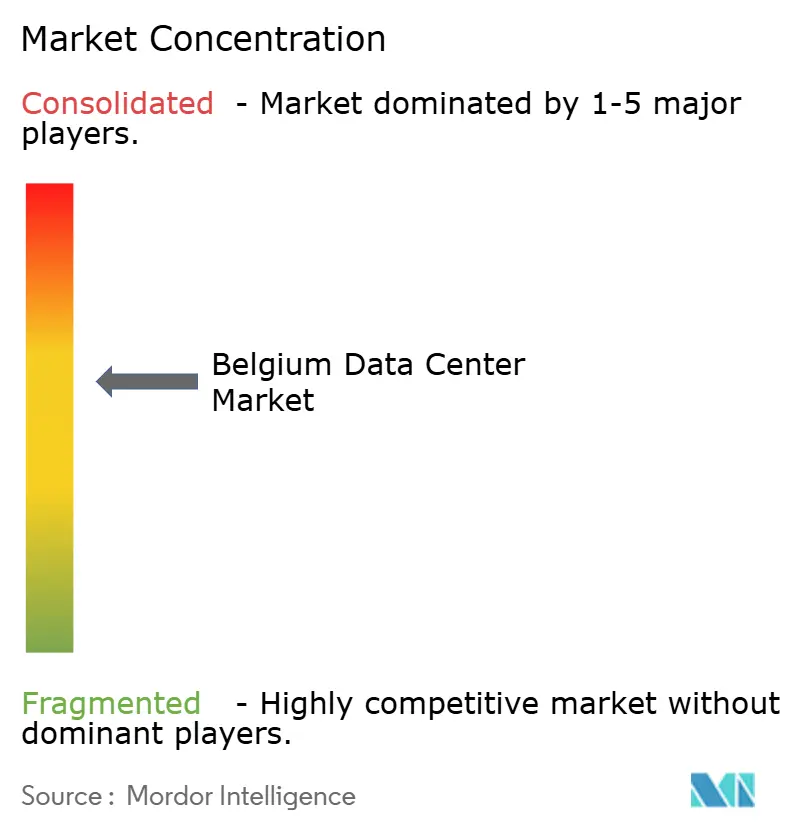
| Market Concentration | Medium |
Major Players *Disclaimer: Major Players sorted in no particular order Image © Mordor Intelligence. Reuse requires attribution under CC BY 4.0. | |
Belgium Data Center Market Analysis by Mordor Intelligence
Belgium Data Center Market size in 2026 is estimated at USD 0.78 billion, growing from 2025 value of USD 0.68 billion with 2031 projections showing USD 1.49 billion, growing at 13.98% CAGR over 2026-2031. In terms of installed base, the market is expected to grow from 420.10 thousand megawatt in 2025 to 644.40 thousand megawatt by 2030, at a CAGR of 8.93% during the forecast period (2025-2030). The market segment shares and estimates are calculated and reported in terms of MW. Flanders offers below-average industrial electricity tariffs, Brussels provides carrier-dense subsea connectivity, and a nationwide fiber build-out underpins high-bandwidth applications. Together, these factors position the Belgium data center market as a rising European alternative hub. Rapid adoption of artificial intelligence is driving up power density requirements, which in turn accelerates upgrades from Tier 3 to Tier 4 designs. Meanwhile, hyperscale operators prefer Belgium over saturated Amsterdam, and municipal tax incentives for heat-reuse projects help offset rising grid costs. Consolidation remains moderate as global cloud providers compete with regional specialists for the growing pool of repatriated enterprise workloads.
Key Report Takeaways
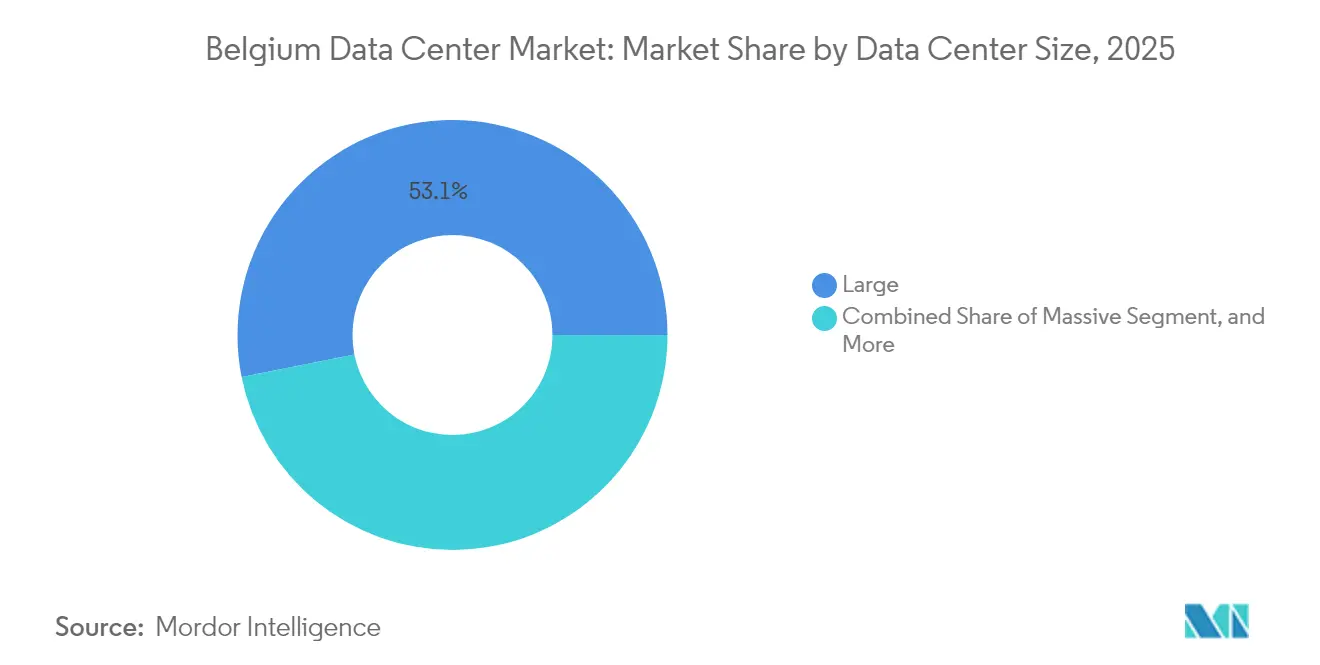
- By data center size, large facilities accounted for 53.12% of the Belgium data center market share in 2025, whereas medium-sized sites are forecast to expand at a 14.64% CAGR to 2031.
- By tier type, Tier 3 captured 82.05% of the 2025 Belgium data center market size, while Tier 4 is set to grow at an 15.12% CAGR through 2031.
- By data center type, hyperscale and self-built sites held a 52.78% share of the Belgian data center market size in 2025 and are expected to advance at a 9.12% CAGR to 2031.
- By end user, IT and telecom led the Belgian data center market with a 65.10% revenue share in 2025; banking, financial services, and insurance are forecast to expand at a 8.97% CAGR through 2031.
- By hotspot, Brussels dominated the capacity deployment in the Belgian data center market in 2025, whereas the rest of Belgium is projected to log a 9.02% CAGR through 2031.
Note: Market size and forecast figures in this report are generated using Mordor Intelligence’s proprietary estimation framework, updated with the latest available data and insights as of 2026.
Belgium Data Center Market Trends and Insights
Drivers Impact Analysis*
| Driver | (~) % Impact on CAGR Forecast | Geographic Relevance | Impact Timeline |
|---|---|---|---|
| Strong fiber backhaul densification | +2.1% | National, concentrated in Brussels and Antwerp | Medium term (2-4 years) |
| Below-EU-average electricity tariff for industrial buyers | +1.8% | Flanders region with competitive exemptions | Short term (≤ 2 years) |
| Growing enterprise cloud repatriation to colocation facilities | +2.3% | National, with early gains in Brussels, Ghent, Antwerp | Medium term (2-4 years) |
| Accelerating AI/ML workload adoption among Belgian corporates | +2.9% | National, spill-over to neighboring markets | Long term (≥ 4 years) |
| Brussels-Frankfurt-Amsterdam submarine cable redundancy | +1.6% | Brussels metro, extending to Flemish corridor | Long term (≥ 4 years) |
| Under-the-radar tax incentives for heat-reuse projects | +1.4% | Municipal level, expanding to regional programs | Medium term (2-4 years) |
| Source: Mordor Intelligence | |||
Strong Fiber Backhaul Densification
Proximus plans to invest EUR 10-15 billion (USD 10.8-16.2 billion) in fiber to reach 95% of premises by 2030, and has already connected 2.3 million homes by early 2025. [1]Proximus, “Proximus Fiber Ambition,” proximus.com Massive point-of-presence units weighing more than 25 tons require dedicated logistics, so demand is shifting from cabinet-level aggregation to metro-edge data centers. Medium-sized facilities, therefore, outpace the overall Belgium data center market. The Belgian Infrastructure Fund’s joint-venture funding ensures rural roll-outs progress alongside urban builds, making edge locations viable. Wider fiber reach also increases interconnection density, a key criterion for AI inference workloads that require sub-5 millisecond latency.
Below-EU-Average Electricity Tariff for Industrial Buyers
Industrial buyers paid 13.1 eurocents per kWh in February 2025, which is cheaper than the Amsterdam and Frankfurt benchmarks. [2]European Commission, “Energy Statistics - Electricity Prices,” ec.europa.eu Flanders magnifies the advantage via exemptions for electro-intensive users, trimming total supply costs that often exceed 60% of data-center opex. Google cited predictable power pricing as a key factor when committing EUR 1 billion (USD 1.08 billion) to its second Belgian campus. Although network surcharges rose in 2025, capacity-based tariffs remain negotiable for qualifying hyperscalers. The pricing cushion supports additional high-density racks needed for AI training, helping Belgium preserve its cost edge as neighboring grids tighten.
Growing Enterprise Cloud Repatriation to Colocation Facilities
Barclays finds 86% of global CIOs intend to migrate some workloads out of public cloud. [3]Barclays, “Enterprise Cloud Repatriation Survey,” barclays.co.uk Belgian firms echo the sentiment, citing data sovereignty and AI cost spirals. Colocation providers report rising take-rates for half-rack and cage footprints bundled with direct cloud on-ramps, letting enterprises tune hybrid architectures without owning hardware. BFSI institutions, newly covered under NIS2, prioritize on-prem cryptography modules and disaster-recovery zoning. This demand spike lifts the Belgium data center market’s medium-facility segment and underpins wholesale contracts with minimum 5 MW blocks.
Accelerating AI-ML Workload Adoption Among Belgian Corporates
EY’s 2024 survey shows 70.9% of Belgian companies deploy at least one AI application. Transformer models used in legal and fintech services require 5-10× the power density of legacy web stacks, making conventional server rooms obsolete. Tier 4 projects gain traction because AI training cannot tolerate the 1-hour maintenance windows allowed under Tier 3. Operators thus integrate 2N+1 electrical paths and direct-to-chip cooling. Hyperscalers also build smaller AI pods near industrial campuses, meeting latency targets for computer-vision use cases in manufacturing.
Restraints Impact Analysis*
| Restraint | (~) % Impact on CAGR Forecast | Geographic Relevance | Impact Timeline |
|---|---|---|---|
| Slower permitting timelines after 2025 sustainability decree | -1.9% | National, with stricter enforcement in Brussels | Short term (≤ 2 years) |
| Tight power-grid capacity in Flemish region | -2.4% | Flanders, affecting industrial corridor expansion | Medium term (2-4 years) |
| Heightened competition from Paris and Amsterdam hyperscale hubs | -1.7% | National, competitive pressure from neighboring markets | Long term (≥ 4 years) |
| Rising water-use restrictions in Brussels metro | -1.3% | Brussels Capital Region, extending to surrounding municipalities | Medium term (2-4 years) |
| Source: Mordor Intelligence | |||
Slower Permitting Timelines After 2025 Sustainability Decree
Flanders introduced energy performance certificates for new server halls in January 2025, extending approval cycles by six to twelve months. Brussels enforces stricter limits on fossil fuels under its PACE climate plan, requiring lifecycle carbon studies before any trenching. Large-footprint hyperscale sites feel the drag most, even though they represent over half of the Belgium data center market. Municipal heat-reuse mandates, such as those in Mechelen’s Energy Broker, require applicants to negotiate tripartite contracts with utilities and city planners. Early movers benefit because existing campuses can phase-add power modules without restarting the entire permit sequence, a barrier that deters greenfield entrants.
Tight Power-Grid Capacity in the Flemish Region
Elia’s Federal Development Plan 2024-2034 flags persistent congestion across Antwerp and Ghent industrial belts. Fluvius, the local DSO, schedules grid reinforcement in multi-year tranches, yet 50 MW data-center taps still wait up to 36 months. Operators increasingly split deployments into 10 MW blocks to stagger energization dates. Some shift new builds south to Wallonia, accepting longer backhaul distances but shorter interconnection queues. Grid bottlenecks, if unresolved, could hinder the growth of the Belgium data center market by eliminating prime brownfield plots that are otherwise ready for quick conversion.
*Our forecasts treat driver/restraint impacts as directional, not additive. The impact forecasts reflect baseline growth, mix effects, and variable interactions.
Segment Analysis
By Data Center Size: Medium Facilities Drive Distributed Growth
Large sites retained a 53.12% share of the Belgium data center market in 2025, a legacy of early hyperscale roll-outs. Google’s modular EUR 1 billion (USD 1.08 billion) St. Ghislain expansion illustrates continued capital concentration. However, medium facilities—those with an IT load between 2 MW and 10 MW-are set to grow at a 14.64% CAGR, twice the overall pace. The Belgium data center market size for medium sites is projected to reach USD 460 million by 2031, reflecting enterprise preference for proximity nodes that remain within NIS2 jurisdictional boundaries. Distributed footprints also hedge against grid caps in Flanders, allowing staged power allocations. Operators package short-term leases and cloud-on-ramp bundles, a profile that resonates with CFOs wary of multi-year hyperscale contracts.
The move toward medium footprints is reinforced by Proximus’s fiber agenda, which plants edge aggregation shelters every few kilometers. Because each shelter weighs roughly 25 tons, developers integrate micro-data-center rooms rather than street cabinets. These rooms often become tenants in existing light-industrial parks, thereby speeding up the time-to-market. Meanwhile, mega campuses exceeding 50 MW remain scarce because land assemblage near 150 kV substations faces community pushback over water use and traffic concerns. Thus, medium nodes knit the Belgium data center market into a nation-wide mesh while still anchoring to Brussels for low-latency financial routing.


By Tier Type: Tier 4 Acceleration Reflects AI Demands
Tier 3 accounted for 82.05% of 2025 capacity, delivering sufficient resilience for most SaaS and CDN workloads. Yet, AI inference pipelines demand constant GPU availability; any planned outage can corrupt training checkpoints, which are valued at millions of compute cycles. Consequently, Tier 4’s CAGR of 15.12% outstrips all other tiers, and the Belgium data center market share for Tier 4 is expected to exceed 10.00% by 2031. LCL’s EUR 30 million (USD 32.4 million) Brussels-North build features dual 2N UPS rings and on-site battery energy storage to meet the requirements of BFSI trading desks. Tier 1 and Tier 2 footprints decline as dev-test sandboxes migrate to the cloud, eliminating the last refuge where sub-99.95% uptime was tolerated.
Operators also leverage Tier 4 credentials to win sovereign AI contracts from ministries that must comply with European trusted cloud rules. While the capex premium can reach 25%, clients offset the uplift by activating demand-response programs that monetize idle generators. Regulatory pull is strong: NIS2 declares data centers part of critical infrastructure, meaning availability violations attract administrative fines. Thus, the Belgium data center market increasingly treats Tier 4 not as a niche but as the architectural default for anything involving AI inference or real-time payments.
By Data Center Type: Hyperscale Dominance Persists
Hyperscale and self-built sites accounted for 52.78% of 2025 revenue and are expected to continue leading at a 9.12% CAGR. They anchor cloud-region roll-outs and reserve room for internal AI labs. Microsoft’s addition of an Azure availability zone in Belgium underscores a broader shift toward multi-zone redundancy within a single country, a strategy made possible by dense fiber rings. Colocation wholesalers benefit as enterprises repatriate AI workloads; they often pre-sell 70% of a new hall before the first slab is poured. Enterprise-edge and micro-edge form a long tail that expands in step with 5G private-network adoption, but their absolute contribution to the Belgian data center market size remains modest.
Unused colocation hall space still exists, the residue of pre-COVID speculative builds. Operators, however, keep it online to capture unexpected bursts from model-training contracts. For their part, hyperscalers strike renewable PPAs ahead of demand, locking in power cost ceilings. Google’s 118 MW wind PPA, finalized in July 2024, resets the industry benchmark for carbon-free energy within Belgium. Such deals also influence lease conversations because enterprises want evidence that their tenancy aligns with science-based target pathways.

By End User: BFSI Acceleration Outpaces IT Leadership
IT and telecom generated 65.10% of 2025 billings, as BNIX handled a peak traffic of 13.2 Tbps. Yet BFSI, though smaller, will grow the fastest at 8.97% CAGR. Algorithmic-trading platforms require latency symmetry to London and Frankfurt, making Brussels an attractive triangulation point. As the Belgium data center market adds AI-driven anti-fraud engines and reg-tech sandboxes, banks seek cages with low-jitter cross-connects. Manufacturing gains ground as automotive suppliers deploy vision-based defect detection, while public-sector workloads jump after federal cloud directives mandate local data processing for citizen IDs.
Telecom firms such as Proximus prefer network-neutral hubs over proprietary halls, a reversal of past practice. The carrier sold its data-center portfolio for EUR 130 million (USD 140.4 million) to focus on fiber and 5G, opening the share for independent colocation vendors. Media-streaming spikes during large sporting events still surge traffic 3-4× baseline, but caching nodes absorb much of that load, tempering incremental space demand in core metros.
Geography Analysis
Brussels hosts most subsea cable landing stations and EU institutions, so it naturally concentrated workloads in 2024. However, tight land supply and water-reuse rules nudge new projects toward the Flemish industrial corridor. The rest of the Belgium sub-market will post a 9.02% CAGR, with Antwerp and Ghent emerging as secondary loops, still within 25 milliseconds of Amsterdam. Developers target reclaimed brownfields where zoning boards favor digital infrastructure over heavy manufacturing. Wallonia remains a frontier, though Proximus’s rural fiber push could unlock micro-edge builds colocated with agri-tech sensor arrays.
Data-center sprawl into peri-urban zones also mitigates the risk of single-city outages, satisfying NIS2 redundancy clauses. Brussels will retain command-and-control nodes and banking core systems, but batch analytics and archive tiers migrate outward. This geographic spread marks the evolution of the Belgium data center market from a hub-and-spoke to a mesh, mirroring network architecture best practices.
Brussels remains the linchpin of the Belgium data center market, thanks to its dual role as the political capital and a hub for cross-border traffic exchange. Around 75% of households have access to fiber, and the city is situated on redundant subsea links that align latency paths to both North America and the Nordics. Land zoned for industrial use within the ring road is scarce and expensive, and PACE climate rules restrict the use of fossil-fuel backup systems. Operators therefore retrofit closed office parks, trading higher refurbishment costs for shorter permitting windows. Water-use caps introduced in 2024 stipulate the use of closed-loop cooling or municipal heat reuse, nudging builders toward immersion or rear-door heat-exchanger technologies.
Flanders drives the rest of Belgium's growth story. Competitive electricity exemptions and proximity to major industrial customers lure developers even as Elia warns of substation congestion. Targeted grid-upgrade funds in the 2024-2034 plan prioritize 150 kV loop closures around Antwerp. Cities such as Mechelen market their district heating networks, using waste-heat revenue to offset municipal climate budgets. Edge nodes near new onshore wind clusters pair 6–8 MW IT load with behind-the-meter storage, giving tenants access to power directly sourced from renewables. These attributes are pushing the Belgian data center market toward a two-core model: Brussels for its high interconnection density and Flanders for its scalable land and power resources.
Wallonia contributes a smaller but rising share. Fiber line-haul upgrades along the E42 corridor cut round-trip latency to Paris below 4 milliseconds, making Charleroi attractive for DR seats tied to French headquarters. Incentives under the Digital Wallonia program reimburse up to 25% of site preparation costs for facilities that meet EU tax-eligibility requirements. Although the region trails Flanders in multi-tenant capacity, its lower real-estate prices appeal to wholesale operators looking to pre-position for future AI demand. Nationwide, the Belgium data center market benefits from the country’s central location, delivering sub-30-millisecond reach to 200 million European consumers.
Competitive Landscape
The competitive field is moderately concentrated. Google, Microsoft, and Amazon run self-built campuses and hold long-term land options for future megawatts. LCL Belgium, Datacenter United, and Interxion (Digital Realty) supply multi-tenant colocation focused on compliance-sensitive customers. Google’s latest EUR 1 billion (USD 1.08 billion) capex round indicates hyperscalers still see Belgium as a cost-efficient low-latency node. LCL leverages Tier 4 design and 100% renewable mix to win government AI contracts. Datacenter United targets medium enterprises with carrier-neutral meet-me rooms spanning eight Belgian cities.
Strategic differentiation hinges on power sourcing and sustainability metrics. Google secured a 118 MW wind PPA in 2024, while Microsoft explores on-site hydrogen fuel cells for backup. Regional specialists counter with heat-reuse projects integrated into municipal grids. Edge operators bundle private 5G and local GPU clusters for manufacturing clients, a niche yet to be fully penetrated by hyperscalers. Mergers remain on the table as Proximus’s asset sale demonstrates telecom operators’ willingness to divest real estate. Foreign entrants, especially those from France, view Belgium as a means of relief from Paris grid caps, adding competitive pressure while also validating the market’s long-term prospects.
The technology roadmap is shifting toward liquid cooling, quantum-safe interconnects and on-chip optical links. Regional firms partner with academic labs in Leuven and Ghent to prototype next-generation network fabrics. Contract awards are increasingly requiring ISO 14001 and soon EU Green Deal Taxonomy alignment. Those without a clear decarbonization plan risk exclusion from blue-chip tenders, accelerating a flight to quality within the Belgium data center market.
Belgium Data Center Industry Leaders
Google LLC
Datacenter United NV
SAP SE
EdgeConneX Inc.
Digital Realty Trust Inc.
- *Disclaimer: Major Players sorted in no particular order

Recent Industry Developments
- October 2025: Belgian industrial electricity prices stabilized at 13.1 EUR cents per kWh following sharp network cost increases earlier in the year, creating operational cost pressures for data center operators while maintaining Belgium’s competitive position relative to Amsterdam and Frankfurt markets.
- September 2025: Elia Group published updated grid adequacy assessments highlighting continued transmission constraints in Flemish industrial corridors, prompting data center operators to explore alternative locations and distributed capacity strategies; the assessment influences long-term facility planning and investment decisions across the Belgian market.
- August 2025: Belgium’s data center sector recorded 1Q 2025 capacity utilization rates above 85%, reflecting strong demand from AI workload adoption and enterprise cloud repatriation; the sustained utilization supports fresh investment in additional facilities despite regulatory constraints.
- July 2025: CSRD sustainability reporting requirements took full effect for Belgian data center operators, mandating comprehensive environmental impact disclosures that shape facility design and operational strategies, creating competitive advantages for firms with established ESG programs and heat-reuse systems.


Belgium Data Center Market Report Scope
Brussels are covered as segments by Hotspot. Large, Massive, Medium, Mega, Small are covered as segments by Data Center Size. Tier 1 and 2, Tier 3, Tier 4 are covered as segments by Tier Type. Non-Utilized, Utilized are covered as segments by Absorption.| Large |
| Massive |
| Medium |
| Mega |
| Small |
| Tier 1 and 2 |
| Tier 3 |
| Tier 4 |
| Hyperscale/Self-built | ||
| Enterprise/Edge | ||
| Colocation | Non-Utilized | |
| Utilized | Retail Colocation | |
| Wholesale Colocation | ||
| BFSI |
| IT and ITES |
| E-Commerce |
| Government |
| Manufacturing |
| Media and Entertainment |
| Telecom |
| Other End Users |
| Brussels |
| Rest of Belgium |
| By Data Center Size | Large | ||
| Massive | |||
| Medium | |||
| Mega | |||
| Small | |||
| By Tier Type | Tier 1 and 2 | ||
| Tier 3 | |||
| Tier 4 | |||
| By Data Center Type | Hyperscale/Self-built | ||
| Enterprise/Edge | |||
| Colocation | Non-Utilized | ||
| Utilized | Retail Colocation | ||
| Wholesale Colocation | |||
| By End User | BFSI | ||
| IT and ITES | |||
| E-Commerce | |||
| Government | |||
| Manufacturing | |||
| Media and Entertainment | |||
| Telecom | |||
| Other End Users | |||
| By Hotspot | Brussels | ||
| Rest of Belgium | |||


Market Definition
- IT LOAD CAPACITY - The IT load capacity or installed capacity, refers to the amount of energy consumed by servers and network equipments placed in a rack installed. It is measured in megawatt (MW).
- ABSORPTION RATE - It denotes the extend to which the data center capacity has been leased out. For instance, a 100 MW DC has leased out 75 MW, then absorption rate would be 75%. It is also referred as utilization rate and leased-out capacity.
- RAISED FLOOR SPACE - It is an elevated space build over the floor. This gap between the original floor and the elevated floor is used to accommodate wiring, cooling, and other data center equipment. This arrangement assist in having proper wiring and cooling infrastructure. It is measured in square feet (ft^2).
- DATA CENTER SIZE - Data Center Size is segmented based on the raised floor space allocated to the data center facilities. Mega DC - # of Racks must be more than 9000 or RFS (raised floor space) must be more than 225001 Sq. ft; Massive DC - # of Racks must be in between 9000 and 3001 or RFS must be in between 225000 Sq. ft and 75001 Sq. ft; Large DC - # of Racks must be in between 3000 and 801 or RFS must be in between 75000 Sq. ft and 20001 Sq. ft; Medium DC # of Racks must be in between 800 and 201 or RFS must be in between 20000 Sq. ft and 5001 Sq. ft; Small DC - # of Racks must be less than 200 or RFS must be less than 5000 Sq. ft.
- TIER TYPE - According to Uptime Institute the data centers are classified into four tiers based on the proficiencies of redundant equipment of the data center infrastructure. In this segment the data center are segmented as Tier 1,Tier 2, Tier 3 and Tier 4.
- COLOCATION TYPE - The segment is segregated into 3 categories namely Retail, Wholesale and Hyperscale Colocation service. The categorization is done based on the amount of IT load leased out to potential customers. Retail colocation service has leased capacity less than 250 kW; Wholesale colocation services has leased capacity between 251 kW and 4 MW and Hyperscale colocation services has leased capacity more than 4 MW.
- END CONSUMERS - The Data Center Market operates on a B2B basis. BFSI, Government, Cloud Operators, Media and Entertainment, E-Commerce, Telecom and Manufacturing are the major end-consumers in the market studied. The scope only includes colocation service operators catering to the increasing digitalization of the end-user industries.
| Keyword | Definition |
|---|---|
| Rack Unit | Generally referred as U or RU, it is the unit of measurement for the server unit housed in the racks in the data center. 1U is equal to 1.75 inches. |
| Rack Density | It defines the amount of power consumed by the equipment and server housed in a rack. It is measured in kilowatt (kW). This factor plays a critical role in data center design and, cooling and power planning. |
| IT Load Capacity | The IT load capacity or installed capacity, refers to the amount of energy consumed by servers and network equipment placed in a rack installed. It is measured in megawatt (MW). |
| Absorption Rate | It denotes how much of the data center capacity has been leased out. For instance, if a 100 MW DC has leased out 75 MW, then the absorption rate would be 75%. It is also referred to as utilization rate and leased-out capacity. |
| Raised Floor Space | It is an elevated space built over the floor. This gap between the original floor and the elevated floor is used to accommodate wiring, cooling, and other data center equipment. This arrangement assists in having proper wiring and cooling infrastructure. It is measured in square feet/meter. |
| Computer Room Air Conditioner (CRAC) | It is a device used to monitor and maintain the temperature, air circulation, and humidity inside the server room in the data center. |
| Aisle | It is the open space between the rows of racks. This open space is critical for maintaining the optimal temperature (20-25 °C) in the server room. There are primarily two aisles inside the server room, a hot aisle and a cold aisle. |
| Cold Aisle | It is the aisle wherein the front of the rack faces the aisle. Here, chilled air is directed into the aisle so that it can enter the front of the racks and maintain the temperature. |
| Hot Aisle | It is the aisle where the back of the racks faces the aisle. Here, the heat dissipated from the equipment’s in the rack is directed to the outlet vent of the CRAC. |
| Critical Load | It includes the servers and other computer equipment whose uptime is critical for data center operation. |
| Power Usage Effectiveness (PUE) | It is a metric which defines the efficiency of a data center. It is calculated by: (𝑇𝑜𝑡𝑎𝑙 𝐷𝑎𝑡𝑎 𝐶𝑒𝑛𝑡𝑒𝑟 𝐸𝑛𝑒𝑟𝑔𝑦 𝐶𝑜𝑛𝑠𝑢𝑚𝑝𝑡𝑖𝑜𝑛)/(𝑇𝑜𝑡𝑎𝑙 𝐼𝑇 𝐸𝑞𝑢𝑖𝑝𝑚𝑒𝑛𝑡 𝐸𝑛𝑒𝑟𝑔𝑦 𝐶𝑜𝑛𝑠𝑢𝑚𝑝𝑡𝑖𝑜𝑛). Further, a data center with a PUE of 1.2-1.5 is considered highly efficient, whereas, a data center with a PUE >2 is considered highly inefficient. |
| Redundancy | It is defined as a system design wherein additional component (UPS, generators, CRAC) is added so that in case of power outage, equipment failure, the IT equipment should not be affected. |
| Uninterruptible Power Supply (UPS) | It is a device that is connected in series with the utility power supply, storing energy in batteries such that the supply from UPS is continuous to IT equipment even during utility power is snapped. The UPS primarily supports the IT equipment only. |
| Generators | Just like UPS, generators are placed in the data center to ensure an uninterrupted power supply, avoiding downtime. Data center facilities have diesel generators and commonly, 48-hour diesel is stored in the facility to prevent disruption. |
| N | It denotes the tools and equipment required for a data center to function at full load. Only "N" indicates that there is no backup to the equipment in the event of any failure. |
| N+1 | Referred to as 'Need plus one', it denotes the additional equipment setup available to avoid downtime in case of failure. A data center is considered N+1 when there is one additional unit for every 4 components. For instance, if a data center has 4 UPS systems, then for to achieve N+1, an additional UPS system would be required. |
| 2N | It refers to fully redundant design wherein two independent power distribution system is deployed. Therefore, in the event of a complete failure of one distribution system, the other system will still supply power to the data center. |
| In-Row Cooling | It is the cooling design system installed between racks in a row where it draws warm air from the hot aisle and supplies cool air to the cold aisle, thereby maintaining the temperature. |
| Tier 1 | Tier classification determines the preparedness of a data center facility to sustain data center operation. A data center is classified as Tier 1 data center when it has a non-redundant (N) power component (UPS, generators), cooling components, and power distribution system (from utility power grids). The Tier 1 data center has an uptime of 99.67% and an annual downtime of <28.8 hours. |
| Tier 2 | A data center is classified as Tier 2 data center when it has a redundant power and cooling components (N+1) and a single non-redundant distribution system. Redundant components include extra generators, UPS, chillers, heat rejection equipment, and fuel tanks. The Tier 2 data center has an uptime of 99.74% and an annual downtime of <22 hours. |
| Tier 3 | A data center having redundant power and cooling components and multiple power distribution systems is referred to as a Tier 3 data center. The facility is resistant to planned (facility maintenance) and unplanned (power outage, cooling failure) disruption. The Tier 3 data center has an uptime of 99.98% and an annual downtime of <1.6 hours. |
| Tier 4 | It is the most tolerant type of data center. A Tier 4 data center has multiple, independent redundant power and cooling components and multiple power distribution paths. All IT equipment are dual powered, making them fault tolerant in case of any disruption, thereby ensuring interrupted operation. The Tier 4 data center has an uptime of 99.74% and an annual downtime of <26.3 minutes. |
| Small Data Center | Data center that has floor space area of ≤ 5,000 Sq. ft or the number of racks that can be installed is ≤ 200 is classified as a small data center. |
| Medium Data Center | Data center which has floor space area between 5,001-20,000 Sq. ft, or the number of racks that can be installed is between 201-800, is classified as a medium data center. |
| Large Data Center | Data center which has floor space area between 20,001-75,000 Sq. ft, or the number of racks that can be installed is between 801-3,000, is classified as a large data center. |
| Massive Data Center | Data center which has floor space area between 75,001-225,000 Sq. ft, or the number of racks that can be installed is between 3001-9,000, is classified as a massive data center. |
| Mega Data Center | Data center that has a floor space area of ≥ 225,001 Sq. ft or the number of racks that can be installed is ≥ 9001 is classified as a mega data center. |
| Retail Colocation | It refers to those customers who have a capacity requirement of 250 kW or less. These services are majorly opted by small and medium enterprises (SMEs). |
| Wholesale Colocation | It refers to those customers who have a capacity requirement between 250 kW to 4 MW. These services are majorly opted by medium to large enterprises. |
| Hyperscale Colocation | It refers to those customers who have a capacity requirement greater than 4 MW. The hyperscale demand primarily originates from large-scale cloud players, IT companies, BFSI, and OTT players (like Netflix, Hulu, and HBO+). |
| Mobile Data Speed | It is the mobile internet speed a user experiences via their smartphones. This speed is primarily dependent on the carrier technology being used in the smartphone. The carrier technologies available in the market are 2G, 3G, 4G, and 5G, where 2G provides the slowest speed while 5G is the fastest. |
| Fiber Connectivity Network | It is a network of optical fiber cables deployed across the country, connecting rural and urban regions with high-speed internet connection. It is measured in kilometer (km). |
| Data Traffic per Smartphone | It is a measure of average data consumption by a smartphone user in a month. It is measured in gigabyte (GB). |
| Broadband Data Speed | It is the internet speed that is supplied over the fixed cable connection. Commonly, copper cable and optic fiber cable are used in both residential and commercial use. Here, optic cable fiber provides faster internet speed than copper cable. |
| Submarine Cable | A submarine cable is a fiber optic cable laid down at two or more landing points. Through this cable, communication and internet connectivity between countries across the globe is established. These cables can transmit 100-200 terabits per second (Tbps) from one point to another. |
| Carbon Footprint | It is the measure of carbon dioxide generated during the regular operation of a data center. Since, coal, and oil & gas are the primary source of power generation, consumption of this power contributes to carbon emissions. Data center operators are incorporating renewable energy sources to curb the carbon footprint emerging in their facilities. |


Research Methodology
Mordor Intelligence follows a four-step methodology in all our reports.
- Step-1: Identify Key Variables: In order to build a robust forecasting methodology, the variables and factors identified in Step-1 are tested against available historical market numbers. Through an iterative process, the variables required for market forecast are set and the model is built on the basis of these variables.
- Step-2: Build a Market Model: Market-size estimations for the forecast years are in nominal terms. Inflation is not a part of the pricing, and the average selling price (ASP) is kept constant throughout the forecast period for each country.
- Step-3: Validate and Finalize: In this important step, all market numbers, variables and analyst calls are validated through an extensive network of primary research experts from the market studied. The respondents are selected across levels and functions to generate a holistic picture of the market studied.
- Step-4: Research Outputs: Syndicated Reports, Custom Consulting Assignments, Databases & Subscription Platforms


